

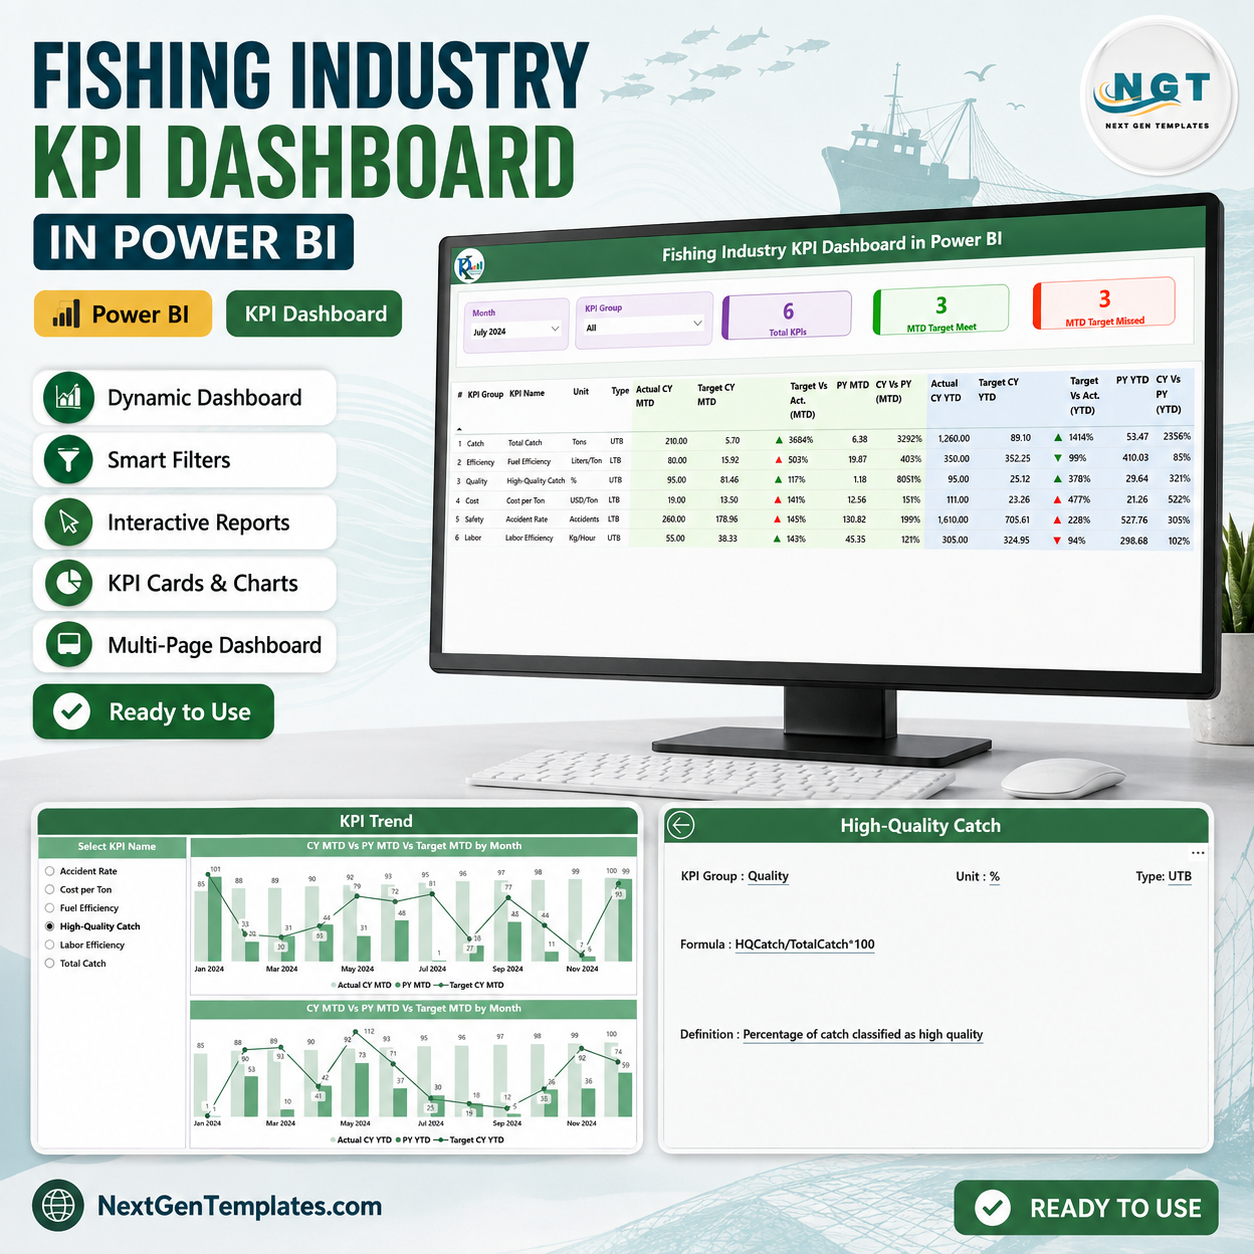
Fishing Industry KPI Dashboard in Power BI gives fishing businesses, fleet managers, processors, and seafood operations teams a ready KPI monitoring system for monthly performance review. For a $11.99 sale price, you get a Power BI report with 3 focused pages, Excel-based data input, MTD and YTD KPI comparisons, target tracking, previous-year comparison, and drill-through KPI definitions. Built by PK, a Microsoft Certified Professional with 15+ years of Excel and Power BI experience, this template is designed to save setup time and reduce reporting risk before management review.
Key Features of Fishing Industry KPI Dashboard in Power BI
- 3 Power BI pages: Summary, KPI Trend, and hidden KPI Definition drill-through page.
- Top slicers: filter the main dashboard by Month and KPI Group.
- Executive KPI cards: Total KPIs, MTD Target Meet Count, and MTD Target Missed Count.
- MTD and YTD tracking: compare Actual, Target, Previous Year, Target vs Actual, and Current Year vs Previous Year.
- Status icons: red and green up/down indicators show whether KPIs are meeting target logic.
- KPI direction support: works with LTB (Lower the Better) and UTB (Upper the Better) metric types.
- Excel data source: update actuals, targets, and KPI definitions in structured workbook tabs.
What’s Inside the Fishing Industry KPI Dashboard in Power BI
1. Summary Page
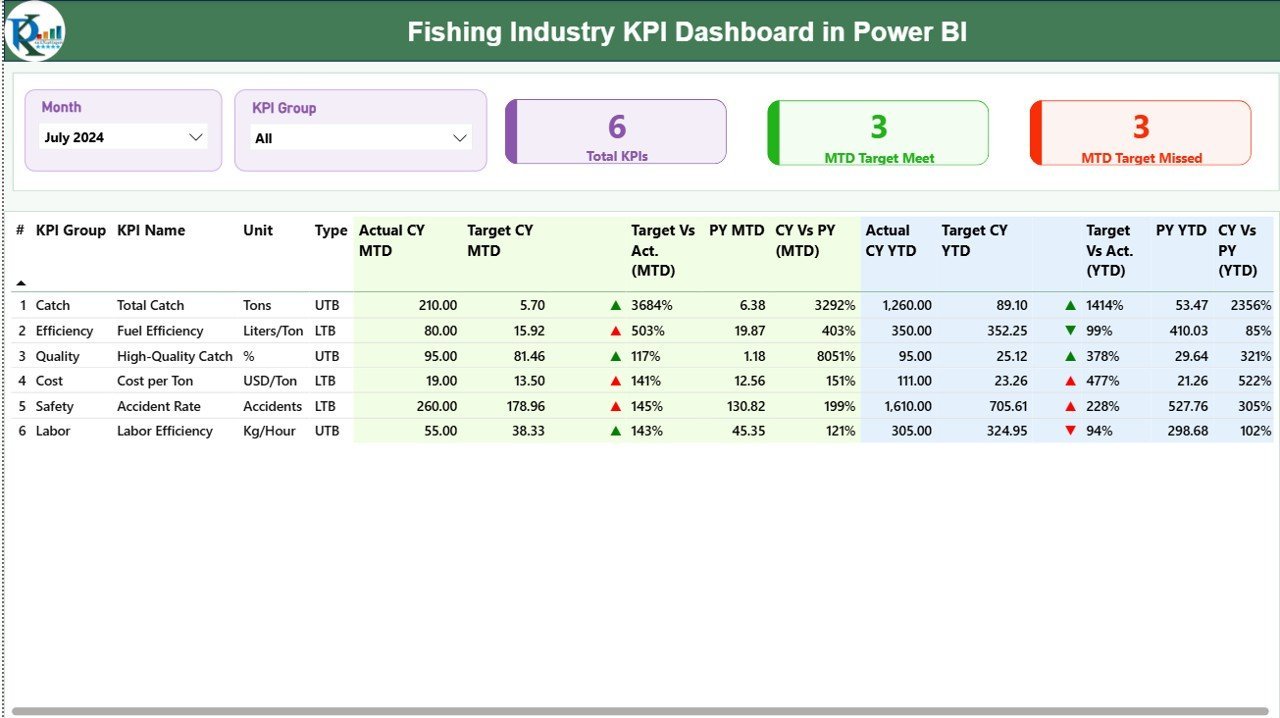
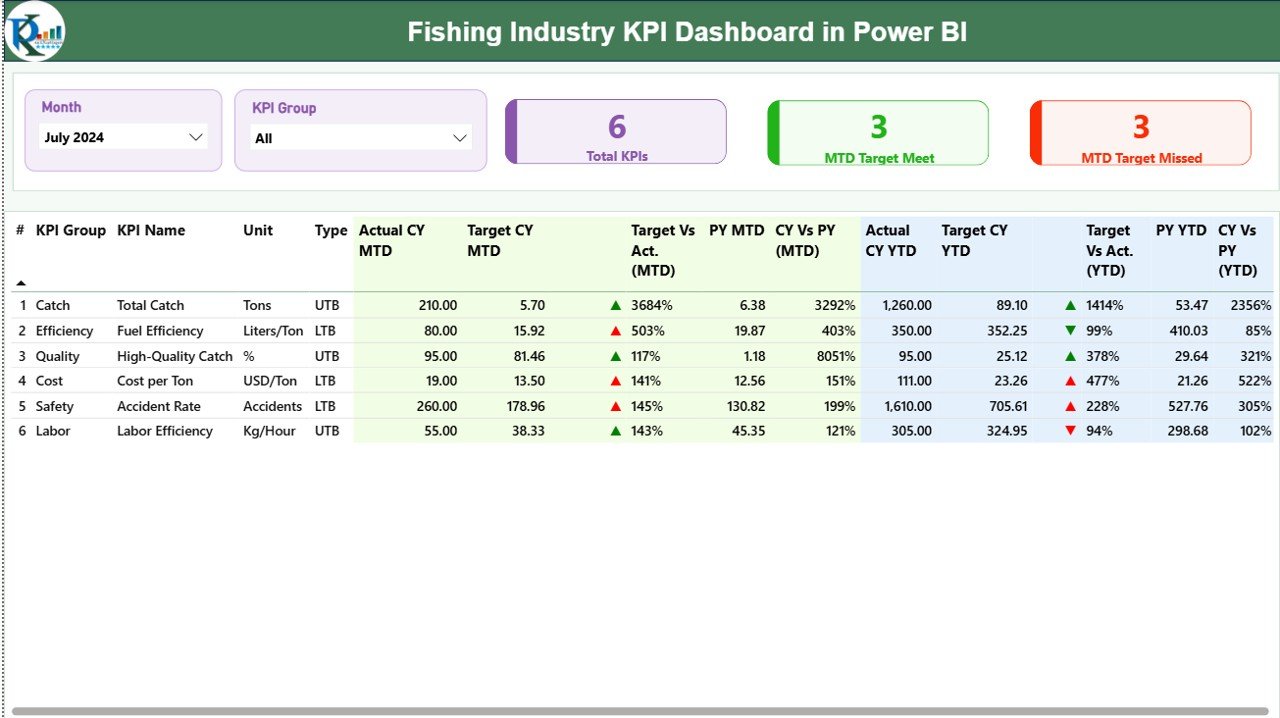
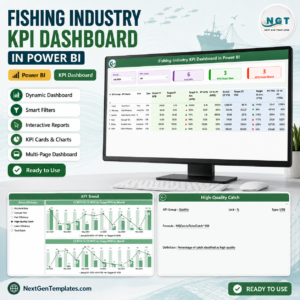
The Summary Page is the main review page. It includes Month and KPI Group slicers at the top so users can narrow the report by time period and KPI category. Three cards show the Total KPIs count, MTD Target Meet count, and MTD Target Missed count, helping managers quickly see whether performance is on track.
The detailed KPI table includes KPI Number, KPI Group, KPI Name, Unit, Type, Actual CY MTD, Target CY MTD, MTD Icon, Target vs Act. (MTD), PY MTD, CY vs PY (MTD), Actual CY YTD, Target CY YTD, YTD Icon, Target vs Act. (YTD), PY YTD, and CY vs PY (YTD). This makes it useful for management meetings where both current-month and year-to-date progress matter.
2. KPI Trend Page
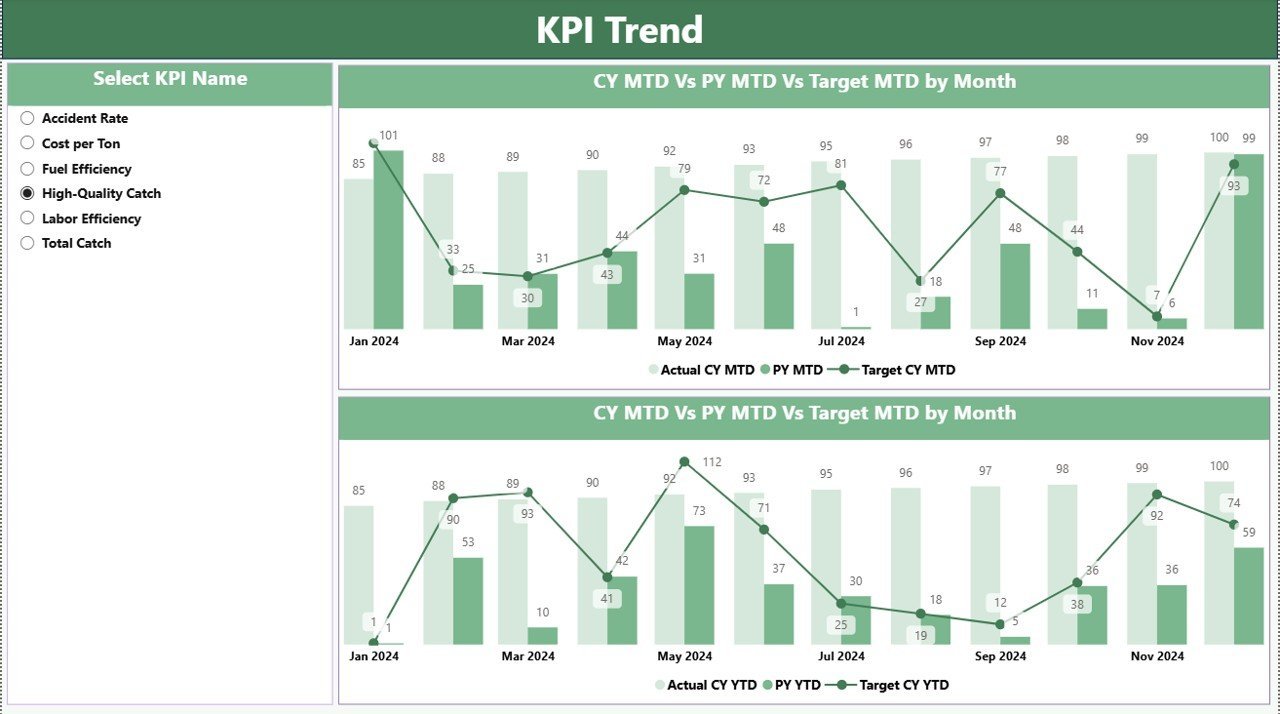
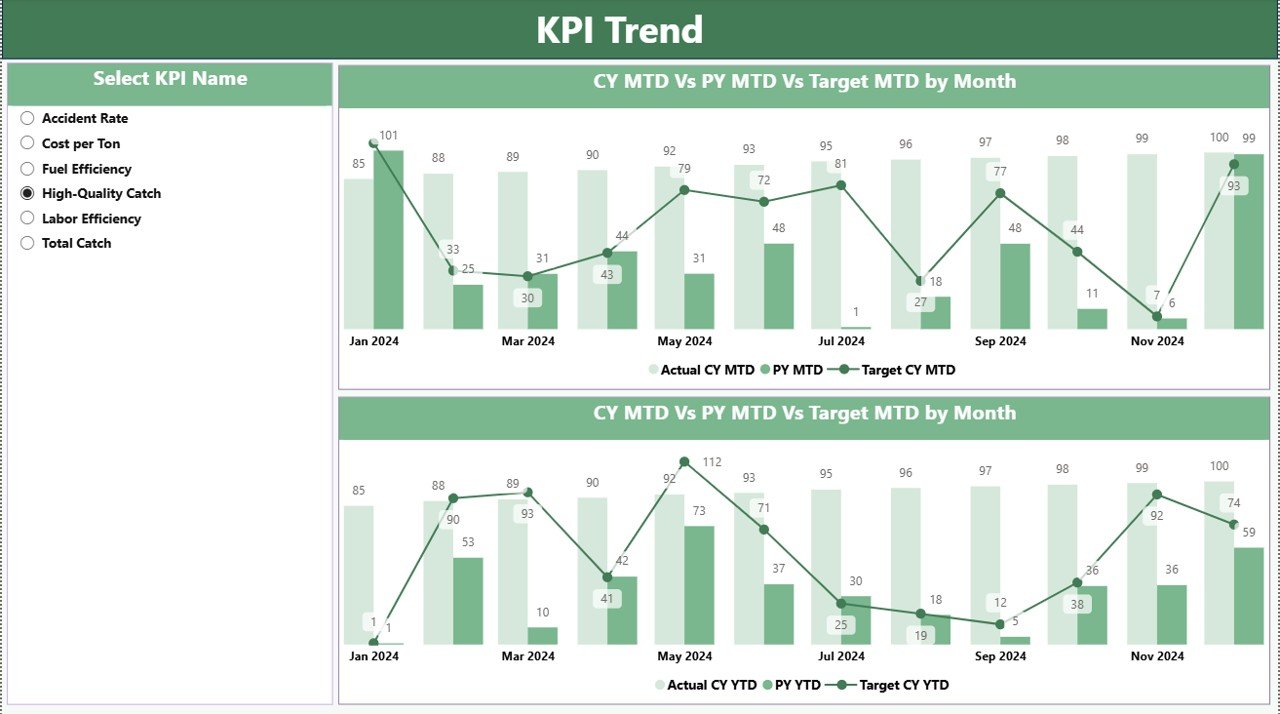
The KPI Trend page shows two combo charts for the selected KPI. One chart compares Current Year, Previous Year, and Target values for MTD. The second chart provides the same style of comparison for YTD. A KPI Name slicer on the left lets users focus on one metric at a time and review monthly movement more clearly.
3. KPI Definition Page
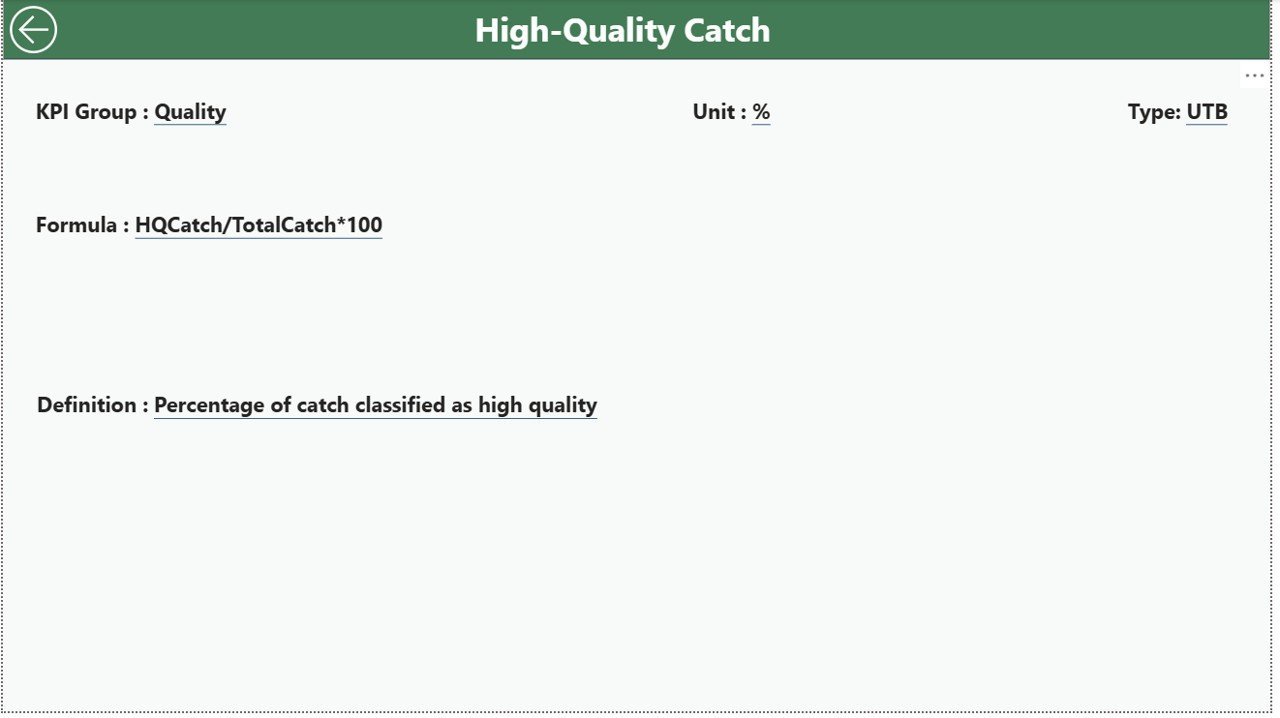
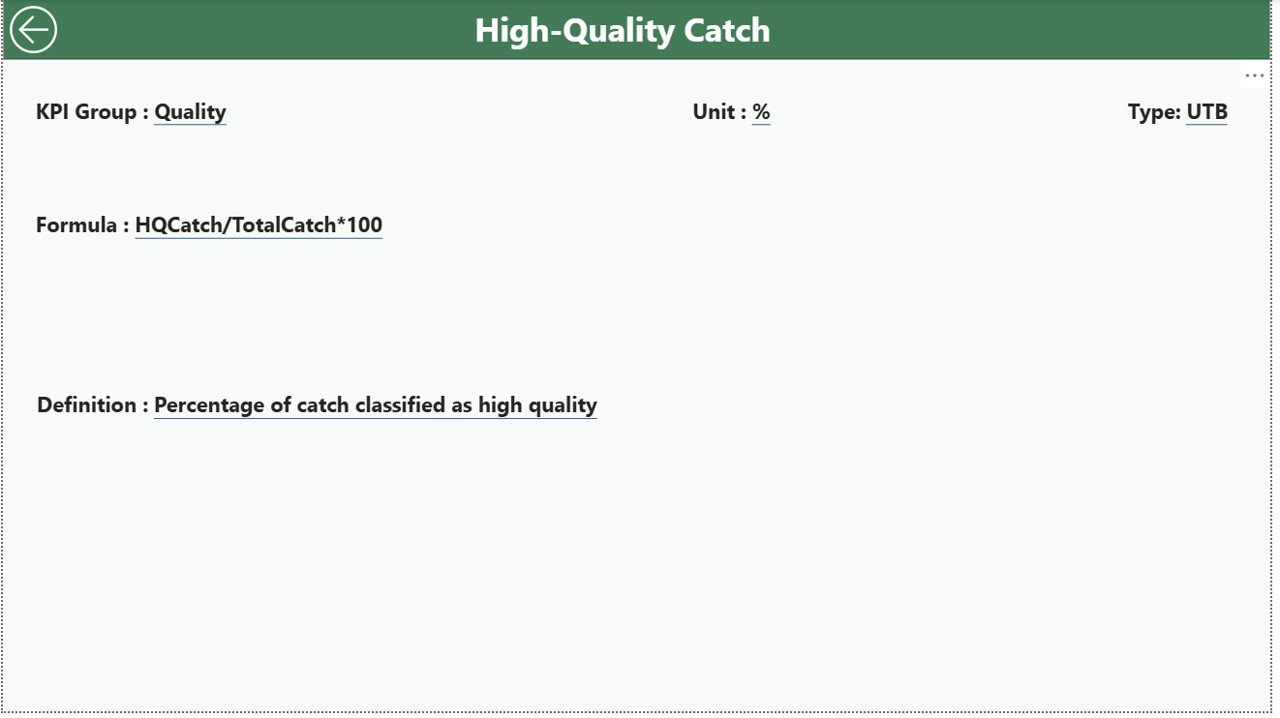
The KPI Definition page is configured as a hidden drill-through page. From the Summary Page, users can drill through to review KPI details such as Formula and KPI Definition. A back button on the top-left corner returns users to the main page.
Excel Data File
The dashboard uses an Excel workbook as the data source. The workbook includes Input_ Actual for KPI Name, Month, MTD number, and YTD number; Input_ Target for KPI Name, Month, MTD target, and YTD target; and KPI Definition for KPI Number, KPI Group, KPI Name, Unit, Formula, Definition, and Type.
Fishing Industry KPI Dashboard in Power BI vs. Tableau vs. Paid CRM/SaaS – Where This Fits
| Feature | This Power BI template | Tableau alternative | Paid SaaS alternative |
|---|---|---|---|
| Cost | $11.99 one-time sale price | License and dashboard build time | Recurring subscription |
| Platform | Power BI Desktop with Excel data source | Tableau Desktop or Cloud | Vendor-hosted app |
| Setup time | Update Excel data and refresh Power BI | Build data model, formulas, and visuals | Configure account, fields, and reports |
| Mobile access | Available through Power BI service if published | Available through Tableau Cloud if published | Usually included by plan |
| Customizable fields | KPI names, groups, units, formulas, definitions, and KPI type | Customizable with Tableau skills | Depends on vendor permissions |
| Year-1 cost at 5 users | $11.99 plus any Microsoft licensing needed | Typically higher after licensing and setup | Often much higher due to user seats |
| KPI status logic | MTD/YTD target status with LTB and UTB support | Must be configured manually | Depends on product configuration |
Who This Template Is For – and Who It’s Not For
Best for: fishing companies, fleet managers, seafood processors, fisheries consultants, operations analysts, compliance teams, and finance managers who track KPIs monthly and need a clean Power BI report backed by Excel.
Not for: teams needing live vessel tracking, automatic IoT feeds, catch reporting to government systems, inventory ERP workflows, or real-time market price integrations. Those needs require connectors, custom data pipelines, or industry software.
How to Use the Fishing Industry KPI Dashboard in Power BI
- Download and unzip the template file.
- Open the Power BI Desktop file.
- Update the Excel data source with actual KPI values, targets, and KPI definitions.
- Refresh the Power BI report.
- Use Month and KPI Group slicers on the Summary Page.
- Open KPI Trend to review selected KPI movement over time.
- Drill through to the KPI Definition page when users need formula or definition details.
Real-World Use Cases
Maria, fishing operations manager: checks which KPIs missed the MTD target before the weekly fleet review.
Dev, seafood finance analyst: compares Current Year MTD and YTD actuals against target and previous-year numbers for management reporting.
Leena, fisheries consultant: uses KPI definitions and formulas to standardize performance reporting across multiple fishing clients.
Frequently Asked Questions
Is this Fishing Industry KPI Dashboard in Power BI ready to use?
Yes. It is a ready Power BI template. Replace the sample Excel data with your KPI values and refresh the report.
How many pages are included?
The Power BI file includes 3 pages: Summary, KPI Trend, and a hidden KPI Definition drill-through page.
What data do I need to enter?
You need actual KPI numbers, target KPI numbers, monthly dates, and KPI definitions with formula, unit, group, and type.
Does it support MTD and YTD reporting?
Yes. The dashboard includes MTD and YTD actuals, targets, previous-year values, and percentage comparisons.
Can I change the KPI list?
Yes. Update the KPI Definition sheet and the related actual and target input sheets using the same structure.
Does it connect to live operational systems?
No. It uses Excel as the data source, which keeps the template simple and editable.
About the Author
Built by PK – Microsoft Certified Professional with 15+ years of Excel, Google Sheets, and Power BI experience. Founder of NextGenTemplates, reaching 300K+ subscribers across YouTube channels. Every template is hand-built and tested before release.
Explore Related Templates
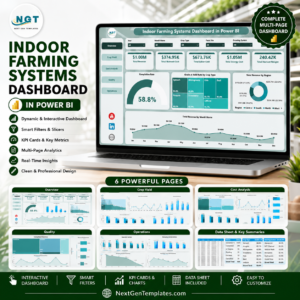
For broader fisheries analytics, see Fisheries Dashboard in Power BI. You may also like Agricultural Machinery Dashboard in Power BI, Indoor Farming Systems Dashboard in Power BI, and Ocean Conservation KPI Dashboard in Excel. Browse more Power BI templates and Power BI KPI Dashboard templates.
Ready to monitor fishing KPIs with less manual reporting? Download the Fishing Industry KPI Dashboard in Power BI, update your Excel data source, and start reviewing MTD, YTD, target, and previous-year performance in one report.
Last updated: August 16, 2026.

















Reviews
There are no reviews yet.