The fashion world moves fast — and data drives every smart decision. 👗📊 The Fast Fashion Brands Dashboard in Excel is a powerful, ready-to-use template that helps you track sales, profits, discounts, and customer satisfaction across brands, regions, and seasons — all in one interactive Excel file.
Designed for retail managers, analysts, and brand strategists, this dashboard turns raw data into meaningful visuals that reveal what’s working, what’s not, and where to focus next.
No coding, no complex setup — just instant insights into your fashion business performance.
✨ Key Features of Fast Fashion Brands Dashboard in Excel
✅ 5 Interactive Analytical Pages: Overview | Brand Analysis | Season Analysis | Payment Mode Analysis | Monthly Trends.
✅ Dynamic Page Navigator: Quickly switch between sections without scrolling.
✅ 4 KPI Cards: Display Total Orders, Revenue (USD), Profit Margin (%), and Customer Satisfaction Rating.
✅ Smart Charts: Analyze order value, discount %, profit, and returns by season, brand, or payment mode.
✅ Excel Automation: Slicers and pivot charts refresh instantly when new data is added.
✅ No Add-ons Needed: 100% Excel-based — works without VBA or Power BI.
✅ Fully Customizable: Add new brands, KPIs, or visuals as your business grows.
This dashboard transforms your retail operations into a visual story — empowering faster, data-driven decisions every season. 🌟
📂 What’s Inside the Fast Fashion Brands Dashboard in Excel
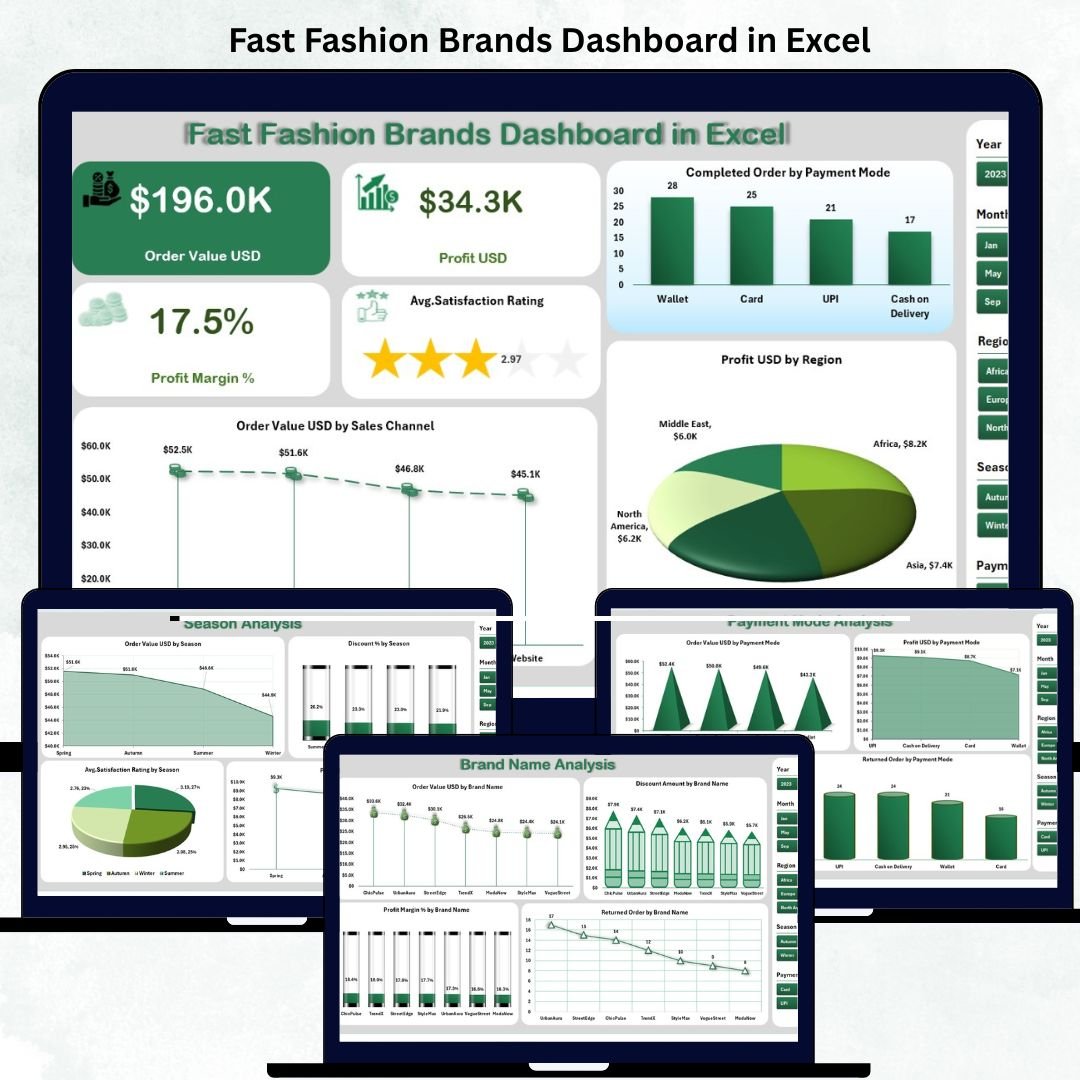
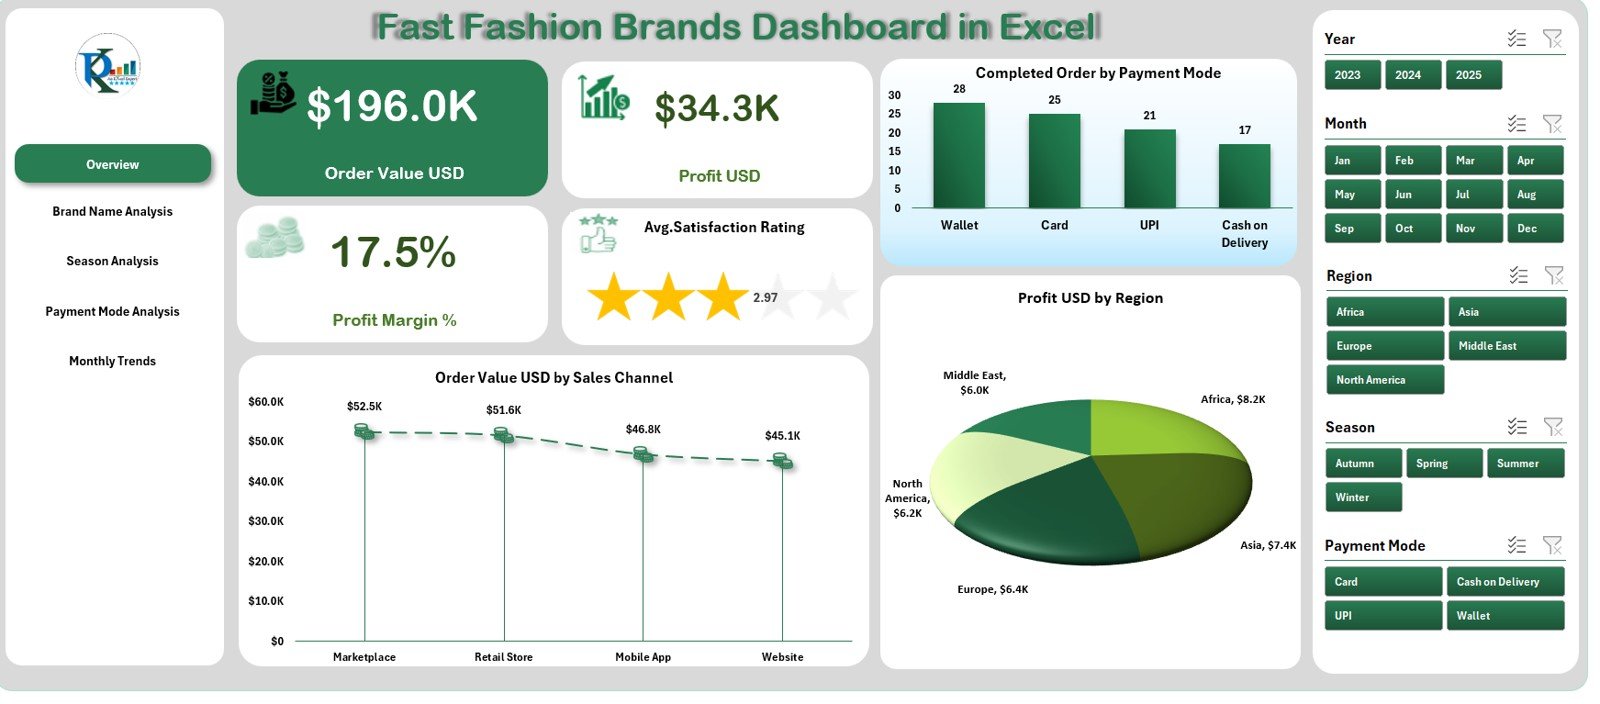
📊 1️⃣ Overview Page – Brand Health at a Glance
-
4 KPI cards summarize orders, revenue, profits, and customer satisfaction.
-
Charts show:
-
Completed Orders by Payment Mode
-
Order Value (USD) by Sales Channel
-
Profit (USD) by Region
Perfect for executives who want quick, high-level visibility of overall performance.
-
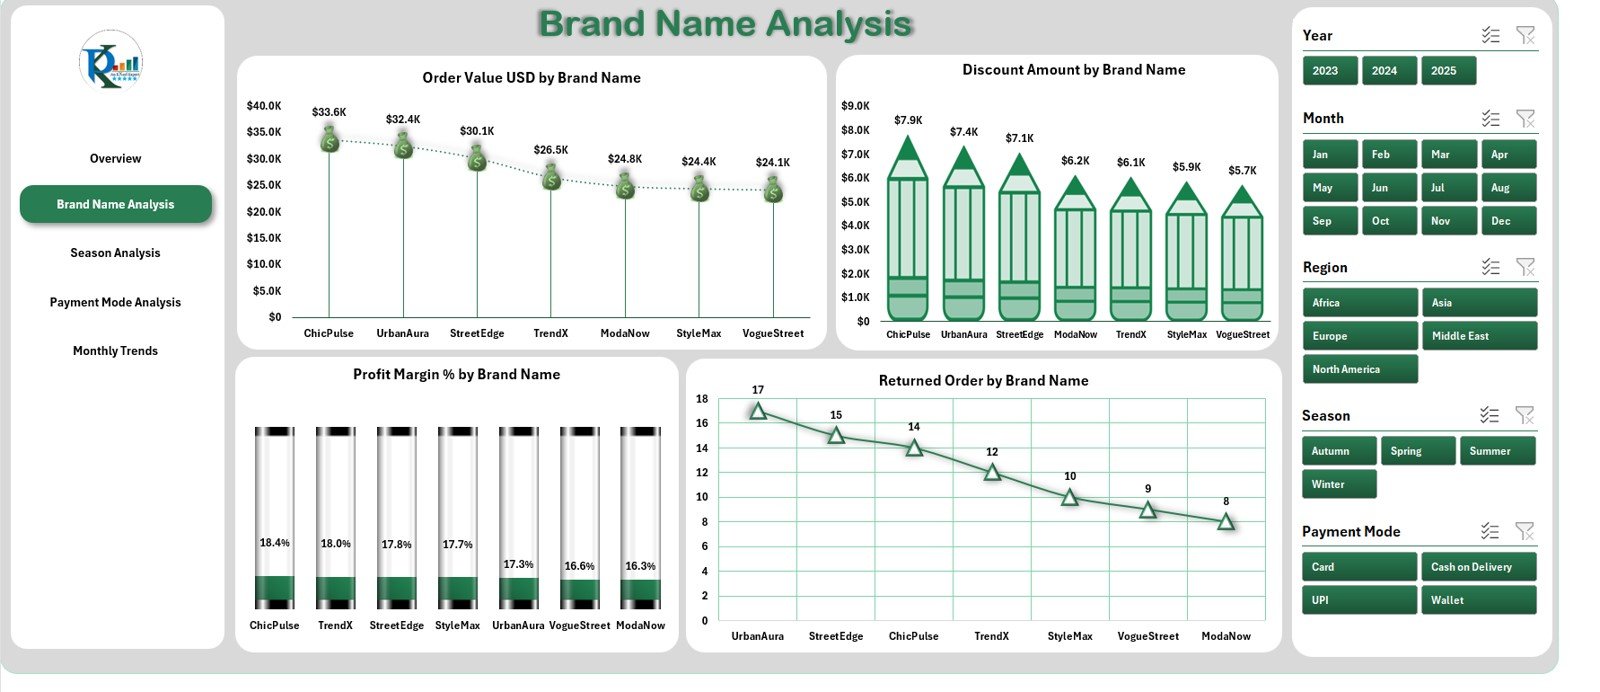
👗 2️⃣ Brand Name Analysis – Multi-Brand Comparison Made Easy
-
Compare sales, discounts, and returns across multiple fashion labels.
-
Charts include:
-
Order Value by Brand
-
Discount Amount by Brand
-
Profit Margin (%) by Brand
-
Returned Orders by Brand
Identify top-performing brands and those needing attention — all in one view.
-
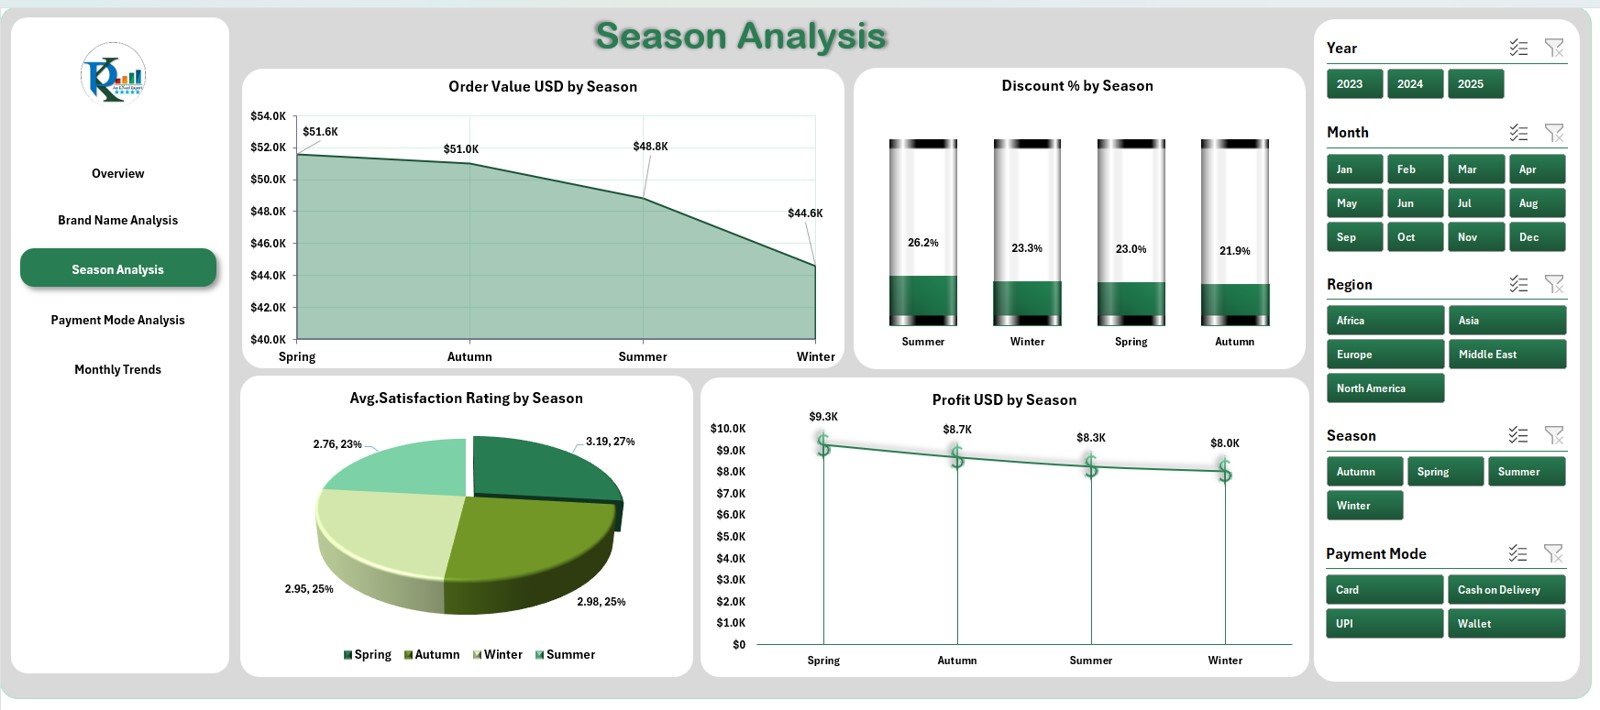
🌦️ 3️⃣ Season Analysis – Capture the Fashion Cycle
-
Visualize how performance varies across Spring, Summer, Fall, and Winter.
-
Charts include:
-
Order Value (USD) by Season
-
Discount % by Season
-
Average Satisfaction Rating by Season
-
Profit (USD) by Season
Helps plan campaigns, manage inventory, and optimize seasonal promotions.
-
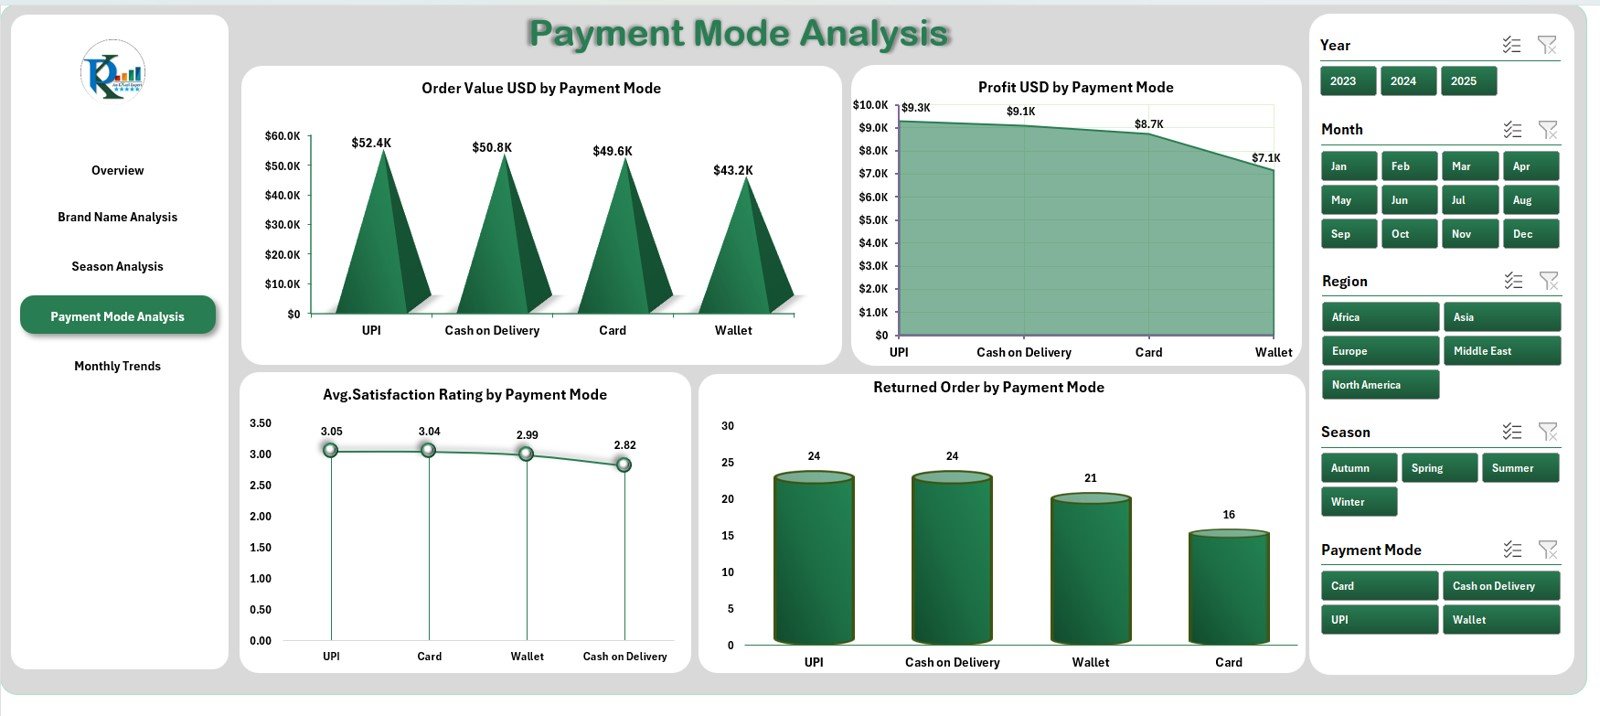
💳 4️⃣ Payment Mode Analysis – Optimize the Checkout Experience
-
Evaluate revenue and profit by payment type.
-
Charts cover:
-
Order Value (USD) by Payment Mode
-
Profit (USD) by Payment Mode
-
Satisfaction Rating by Payment Mode
-
Returned Orders by Payment Mode
Use these insights to streamline payment processes and enhance customer trust.
-
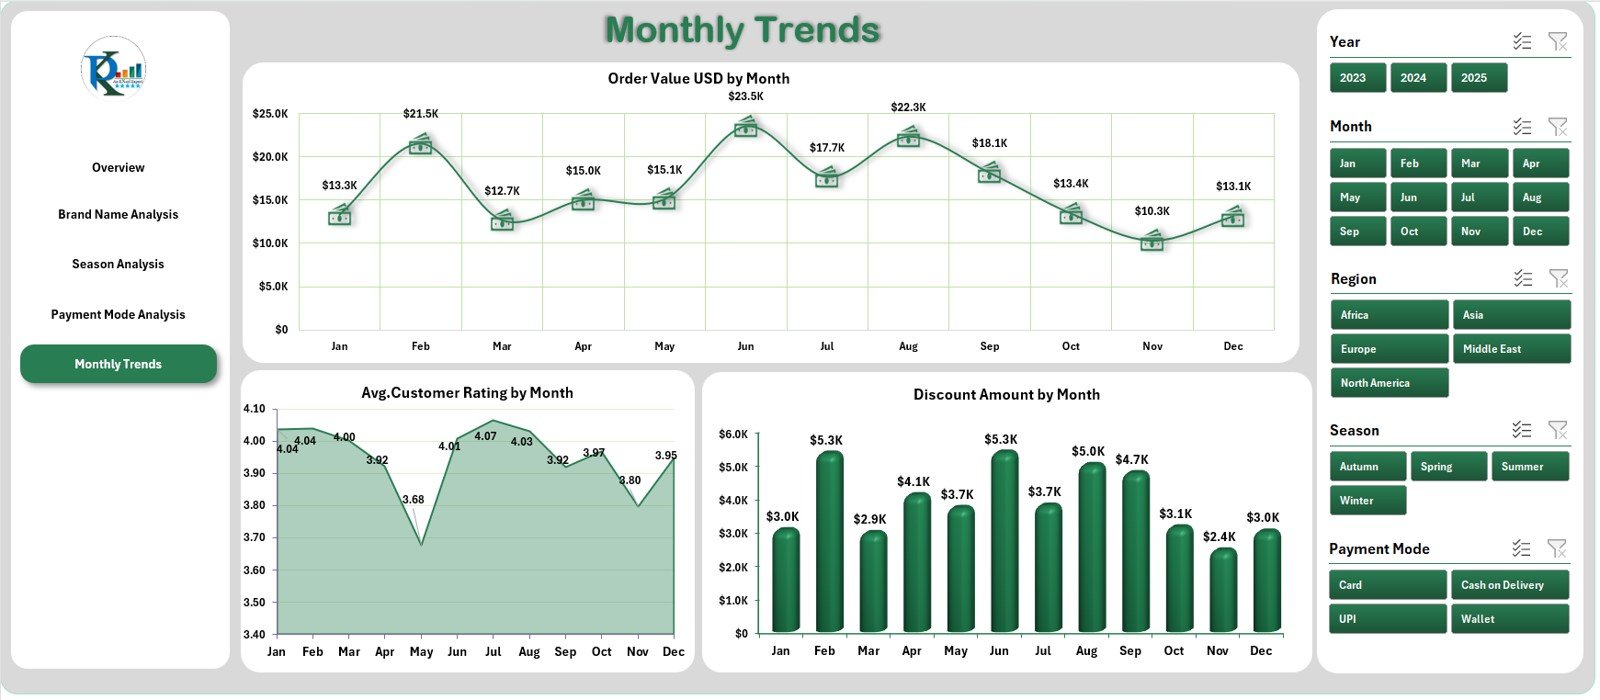
📅 5️⃣ Monthly Trends – Track Growth Over Time
-
See month-by-month shifts in key KPIs.
-
Charts include:
-
Order Value (USD) by Month
-
Average Rating by Month
-
Discount Amount by Month
Spot seasonal peaks, declining trends, or the impact of promotions at a glance.
-
🧾 Support Sheet: Contains lookup values and dropdowns for slicers.
📘 Data Sheet: Centralized storage for all raw data including brand, order ID, payment, discount, and rating.
🧭 How to Use the Fast Fashion Brands Dashboard in Excel
1️⃣ Open the Excel file and go to the Data Sheet.
2️⃣ Enter or paste your sales and performance data.
3️⃣ Refresh all pivots to update charts automatically.
4️⃣ Use slicers for Brand, Region, or Month to filter insights.
5️⃣ Navigate between analytical pages for detailed analysis.
Within minutes, your dashboard will deliver a complete view of brand performance and profitability. 💼
👥 Who Can Benefit from This Dashboard
👗 Brand Managers: Evaluate performance across multiple labels.
🧵 Retail Executives: Make data-backed merchandising decisions.
💰 Finance Teams: Track profitability, discounts, and returns.
📦 Operations Managers: Align stock and delivery with demand.
📈 Marketing Teams: Analyze the effectiveness of campaigns and discounts.
Whether you’re managing a single brand or a global retail chain, this dashboard is your one-stop Excel solution for fashion analytics.


Reviews
There are no reviews yet.