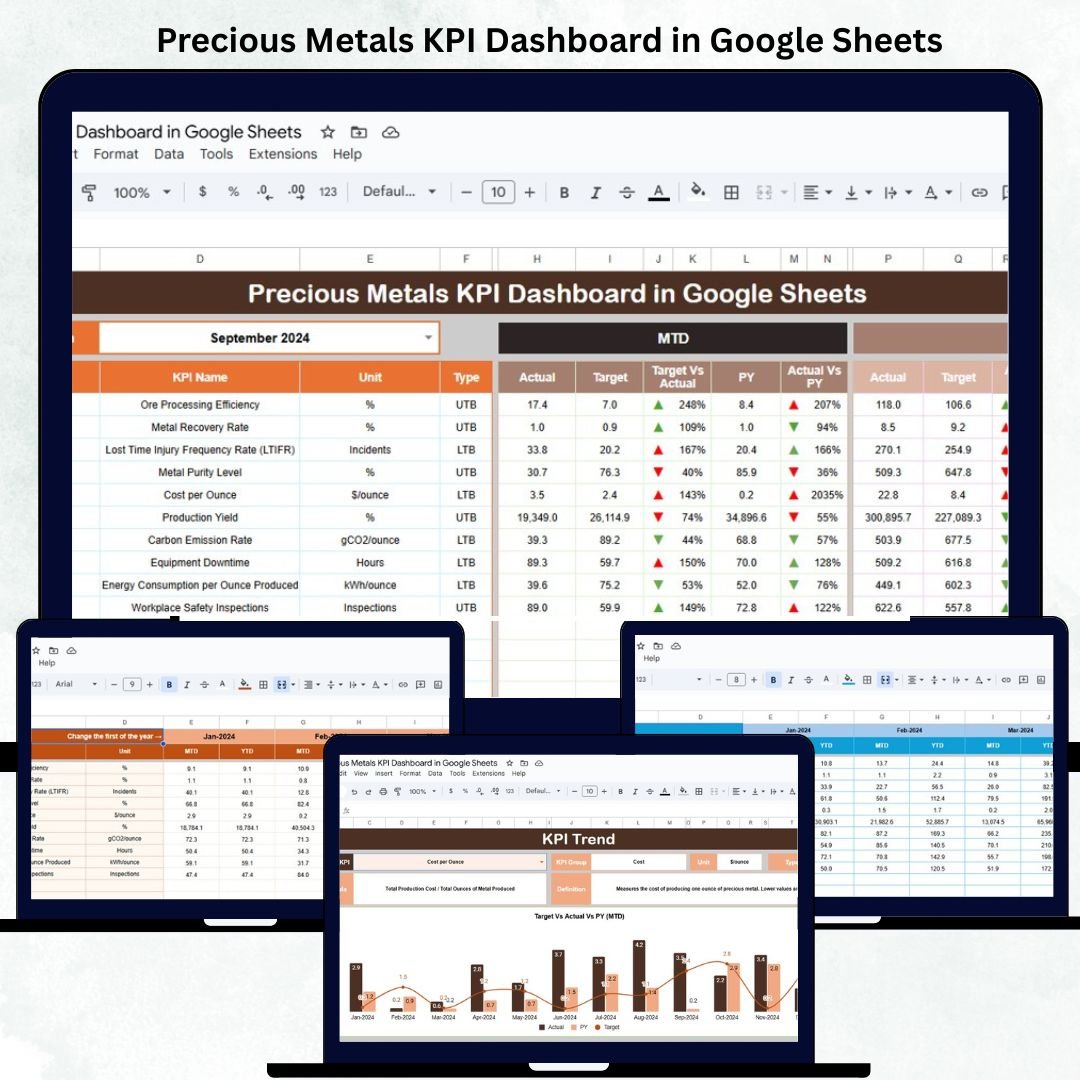
In the dynamic world of precious metals, accurate performance tracking is essential for maintaining profitability and operational control. The Precious Metals KPI Dashboard in Google Sheets is a ready-to-use, data-driven tool designed to help traders, refiners, and manufacturers monitor production, sales, pricing, and quality KPIs in real time — all within the convenience of Google Sheets. 🪙📊
From tracking refining yields and purity levels to analyzing sales margins, cost per ounce, and inventory turnover, this dashboard provides a comprehensive view of your metal operations. It empowers managers and analysts to make informed, data-backed decisions that improve efficiency, reduce waste, and maximize profit — without needing complex software. ⚙️💹
🔑 Key Features of the Precious Metals KPI Dashboard in Google Sheets
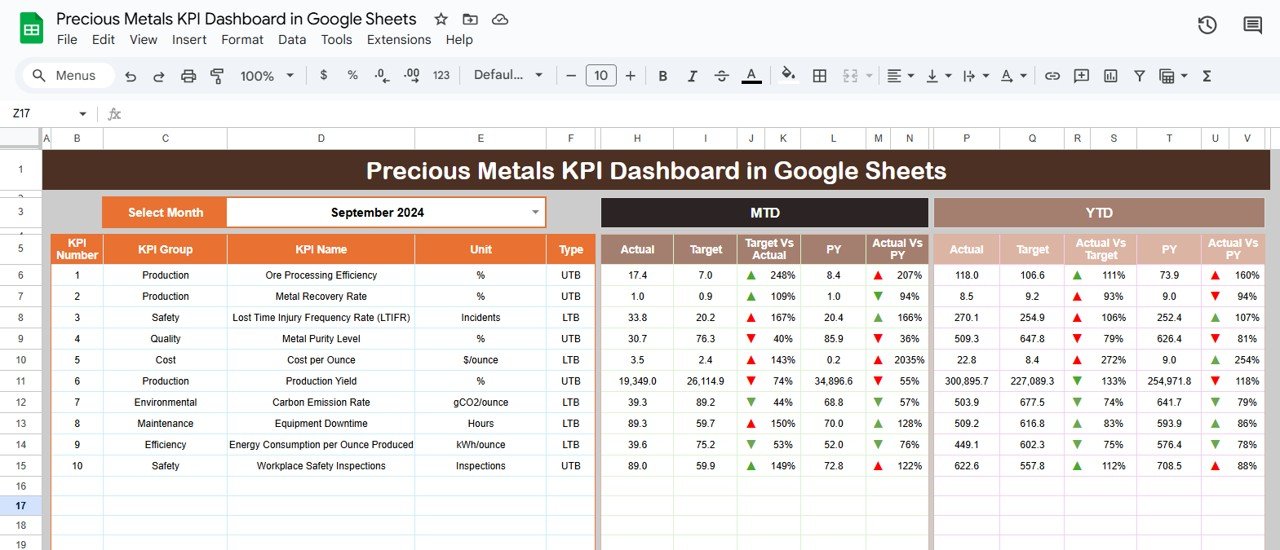
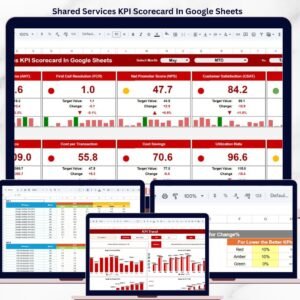
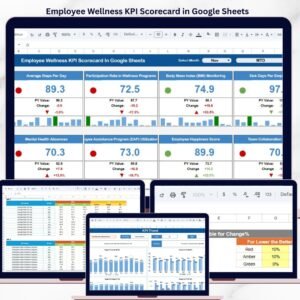
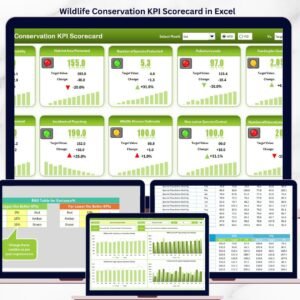
📋 Dashboard Sheet Tab (Main Interface)
-
The central hub for visual insights and KPI monitoring.
-
Includes a Month Selector (cell D3) that dynamically updates all metrics.
-
Displays MTD (Month-to-Date) and YTD (Year-to-Date) comparisons with conditional formatting.
-
🟢 Green Arrow (↑): Performance better than target.
-
🔴 Red Arrow (↓): Performance below target.
-
-
KPI Cards Displayed:
-
Total Metal Produced (oz)
-
Total Metal Sold (oz)
-
Average Purity (%)
-
Refining Yield (%)
-
Cost per Ounce (USD)
-
Revenue per Ounce (USD)
-
Average Market Price (USD/oz)
-
Gross Margin (%)
-
Inventory Turnover Ratio
-
Delivery On-Time (%)
-
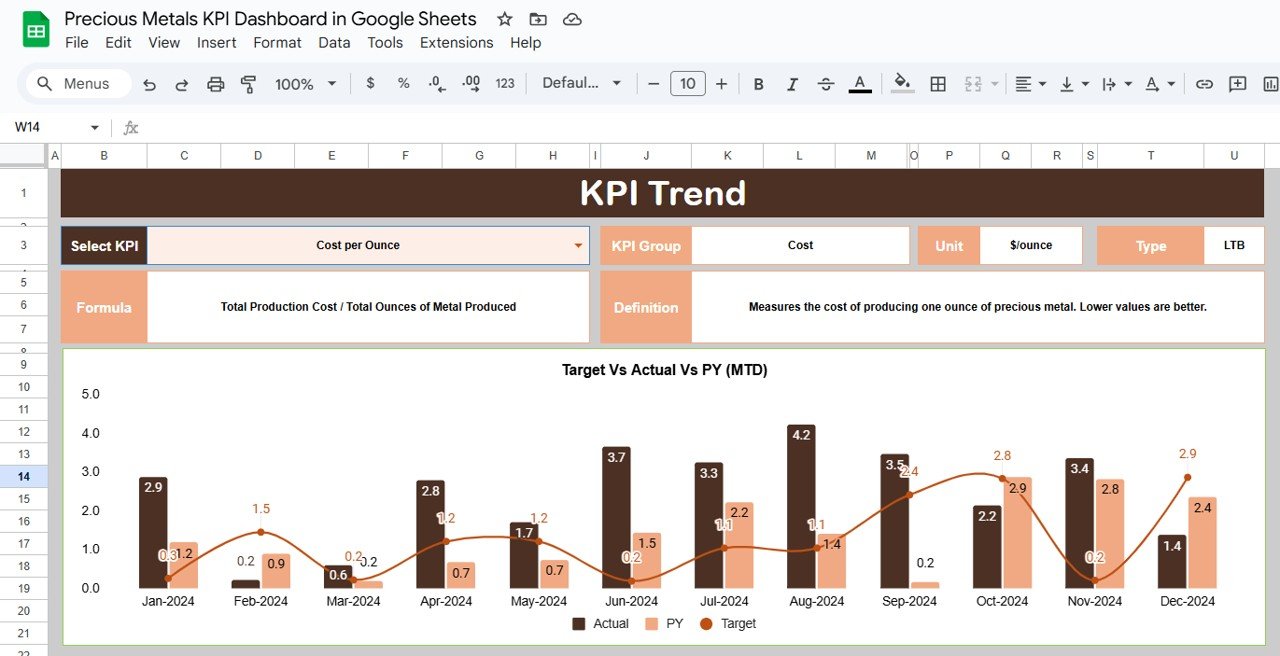
📈 KPI Trend Sheet Tab
-
Deep-dive analysis of any KPI selected via dropdown (cell C3).
-
Displays: KPI Group, Unit, Formula, Type (UTB/LTB), and Definition.
-
Visualizes monthly trends for MTD and YTD performance.
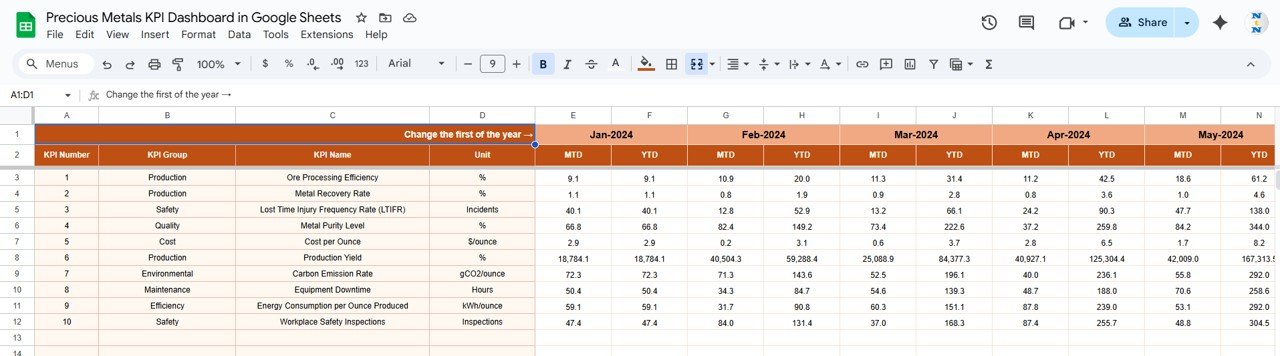
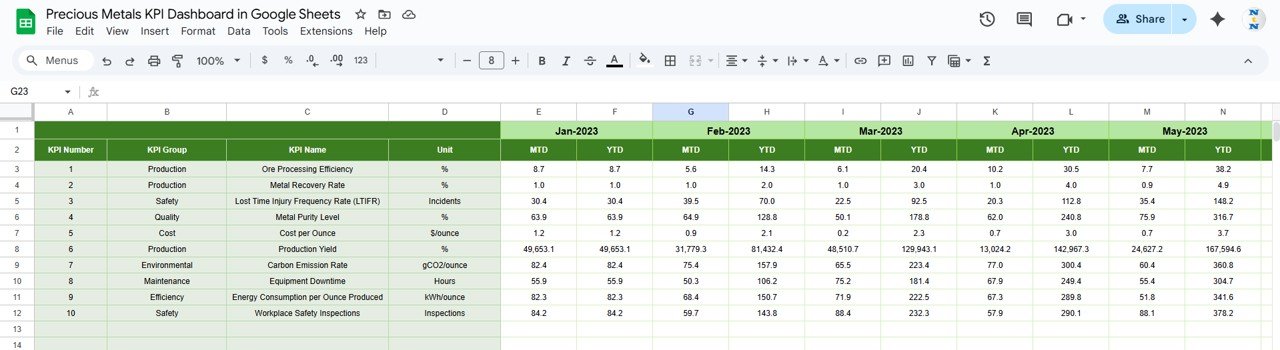
🧾 Actual Number Sheet Tab
-
Record monthly performance data for each KPI.
-
Update cell E1 to change the reference month; visuals auto-refresh.
-
Ideal for production, sales, and financial updates.
🎯 Target Sheet Tab
-
Input target values for each KPI (MTD & YTD).
-
Enables automatic comparison against goals for performance assessment.
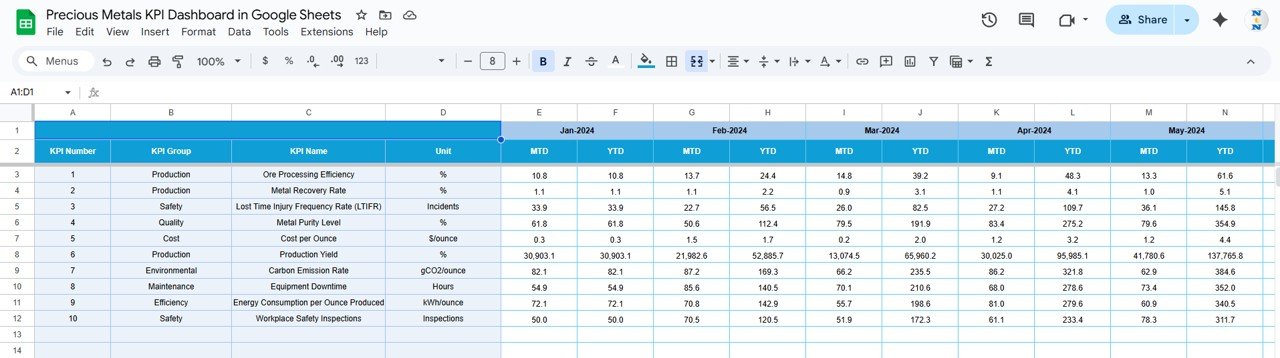
📊 Previous Year Number Sheet Tab
-
Maintain last year’s KPI data for YoY (Year-over-Year) comparison.
-
Understand progress and trend direction easily.
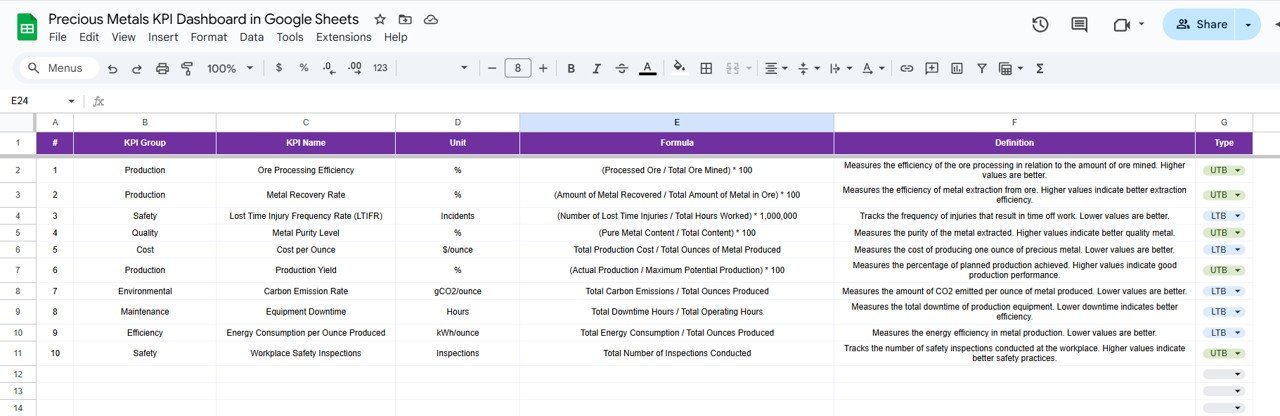
📖 KPI Definition Sheet Tab
-
Complete KPI reference table with formulas, units, and type classification (UTB or LTB).
-
Ensures clarity and reporting consistency across teams.
📦 What’s Inside the Dashboard
✅ Professionally designed Google Sheets file with 6 analytical tabs
✅ Automated formulas for instant calculation and variance tracking
✅ Conditional formatting for visual performance cues
✅ Predefined KPIs relevant to metals industry operations
✅ Dynamic charts & cards for quick analysis
✅ Editable structure — add or modify KPIs anytime
✅ Cloud-ready for collaboration among departments
Everything is streamlined to make performance reporting fast, accurate, and visually engaging.
🧑💼 Who Can Benefit from This Dashboard
💎 Precious Metal Refiners – Monitor refining yield, purity, and cost efficiency.
📊 Metal Traders – Analyze price trends, margins, and sales performance.
🏭 Manufacturers & Jewelers – Track production metrics, delivery efficiency, and quality scores.
💰 Finance & Operations Teams – Measure ROI and cost per ounce to optimize resources.
🌍 Executives & Analysts – Gain full business visibility across multiple metals or locations.
This dashboard is tailor-made for organizations managing gold, silver, platinum, or palladium operations — providing one unified view for production, quality, and profitability.
🧪 How to Use the Precious Metals KPI Dashboard
1️⃣ Input Data – Update MTD and YTD values in the Actual Number Sheet.
2️⃣ Set Targets – Enter your goals in the Target Sheet.
3️⃣ Select Month – Use the dropdown (cell D3) to view monthly results.
4️⃣ Analyze Trends – Review performance patterns in the KPI Trend Sheet.
5️⃣ Compare Progress – Benchmark against last year’s figures using the Previous Year Sheet.
💡 Pro Tip: Add live price feeds from sources like Kitco or LME using GoogleFinance() or Apps Script for real-time insights.
🌟 Why Choose This Dashboard
-
Comprehensive performance tracking across production, pricing, and quality
-
Automated visualizations — no need for manual reports
-
Cloud-based collaboration with real-time access
-
Scalable for multiple sites or metal types
-
Ideal for monthly reviews, management reports, and compliance tracking
With the Precious Metals KPI Dashboard in Google Sheets, you can transform complex operational data into actionable intelligence that drives profitability and precision in your metal operations. 🌟
🔗 Click here to read the Detailed blog post
Watch the step-by-step video Demo:


Reviews
There are no reviews yet.