


Managing client billing and invoices is one of the most critical functions in any organization — and accuracy is everything. The Client Billing & Invoice Management Dashboard in Google Sheets is a ready-to-use, cloud-based solution that simplifies the entire invoicing process. From tracking payments to monitoring overdue invoices, this dashboard offers real-time visibility into your financial operations. 💼📊
Designed for finance teams, account managers, freelancers, and small business owners, this dashboard ensures that every bill, payment, and client record is organized, visualized, and up-to-date — without requiring any accounting software.
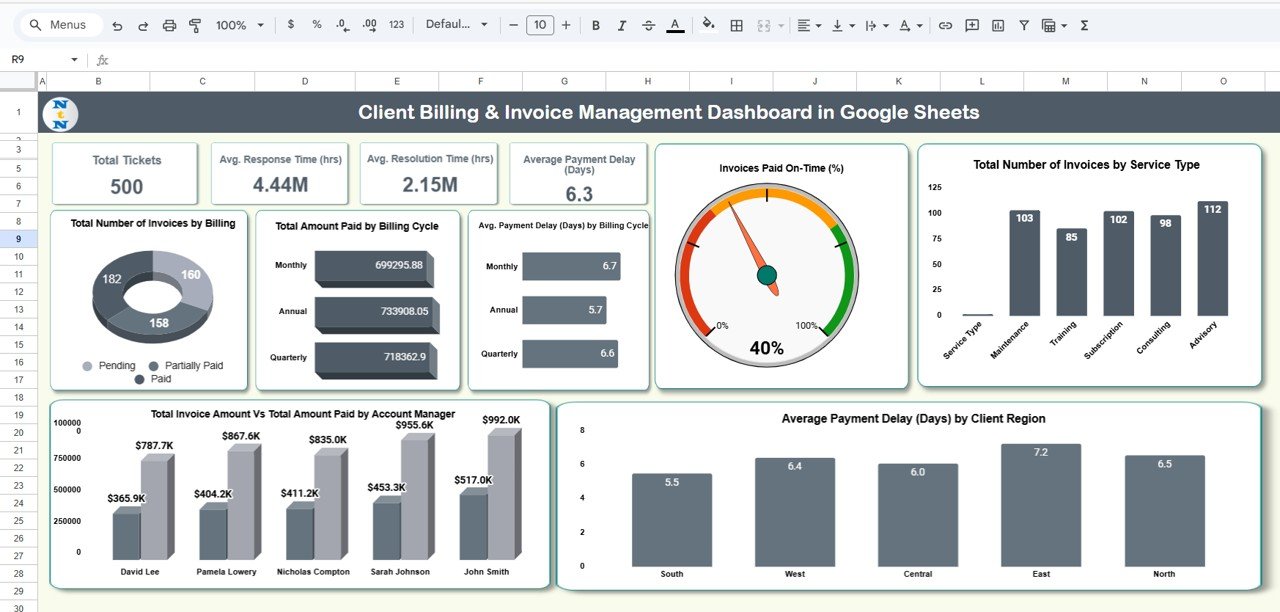
🔑 Key Features of the Client Billing & Invoice Management Dashboard in Google Sheets
📊 Dashboard Sheet Tab (Main Overview)
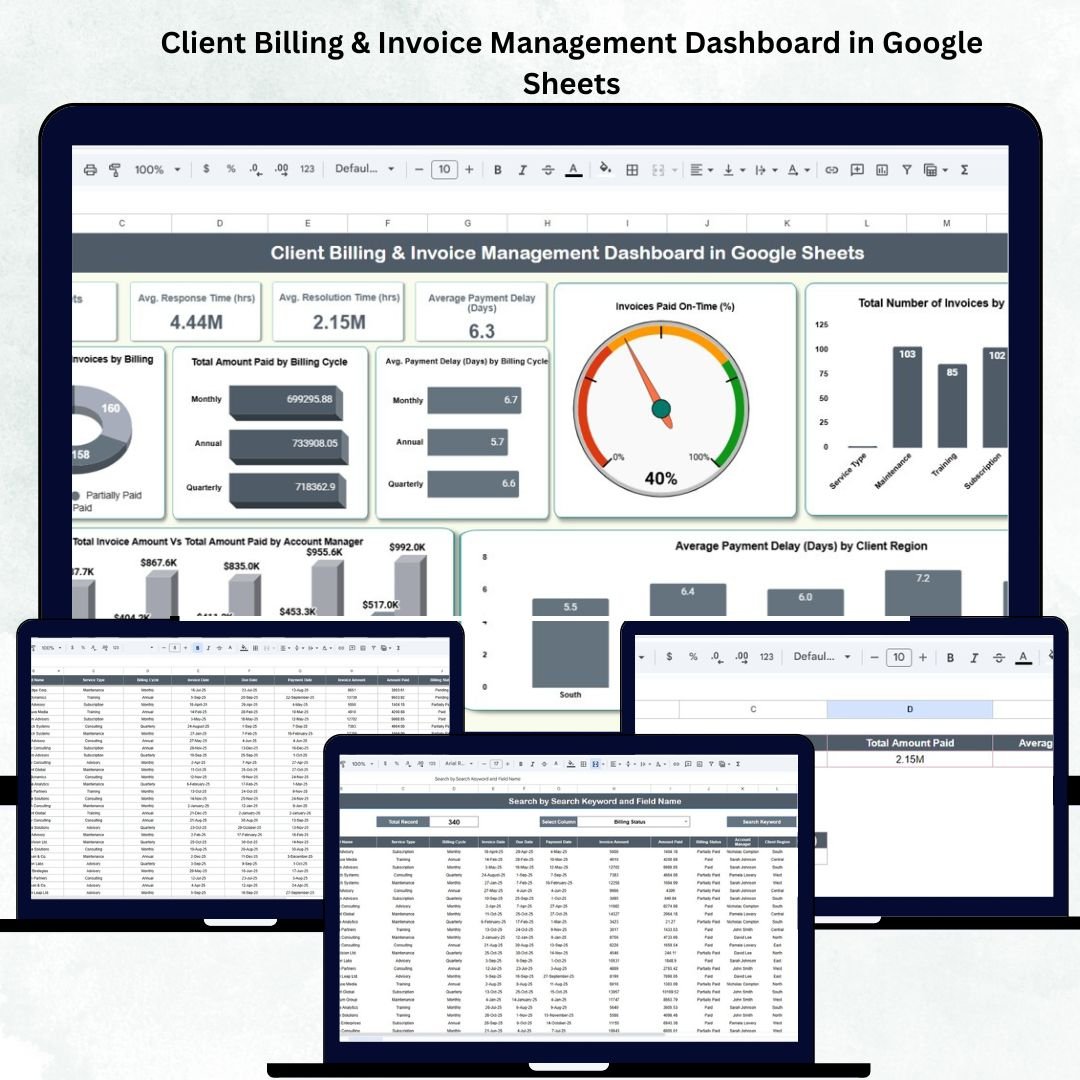
This is the heart of the dashboard — a visual summary of your entire billing ecosystem.
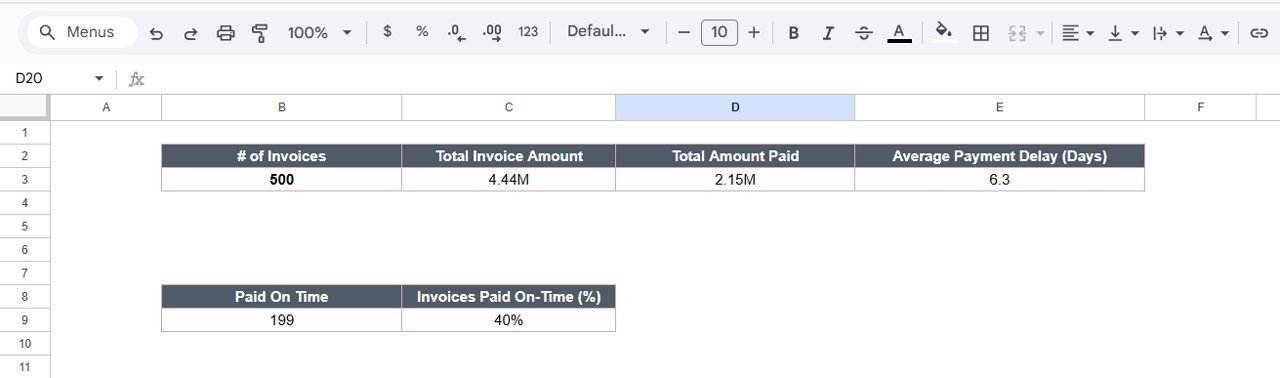
Cards Displayed:
# of Invoices: Total number of invoices generated in the selected period.
Total Invoice Amount: Combined total of all invoice values.
Total Amount Paid: Sum of all payments received.
Average Payment Delay (Days): Average delay between invoice due date and payment date.
Charts Included:
1️⃣ Total Number of Invoices by Billing Status – View invoices categorized as Paid, Pending, Partially Paid, or Overdue.
2️⃣ Total Amount Paid by Billing Cycle – Analyze revenue patterns across Monthly, Quarterly, or Annual cycles.
3️⃣ Average Payment Delay (Days) by Billing Cycle – Identify which billing cycles tend to have delayed payments.
4️⃣ Invoices Paid On-Time (%) – Track client reliability in settling invoices on time.
5️⃣ Total Invoices by Service Type – Grouped by services such as Consulting, Subscription, or Maintenance.
6️⃣ Average Payment Delay (Days) by Client Region – Detect geographical patterns in payment behavior.
7️⃣ Total Invoice Amount vs Total Amount Paid by Account Manager – Compare performance across account managers.
All charts update automatically when new data is entered in the Data Sheet Tab, ensuring real-time financial monitoring.
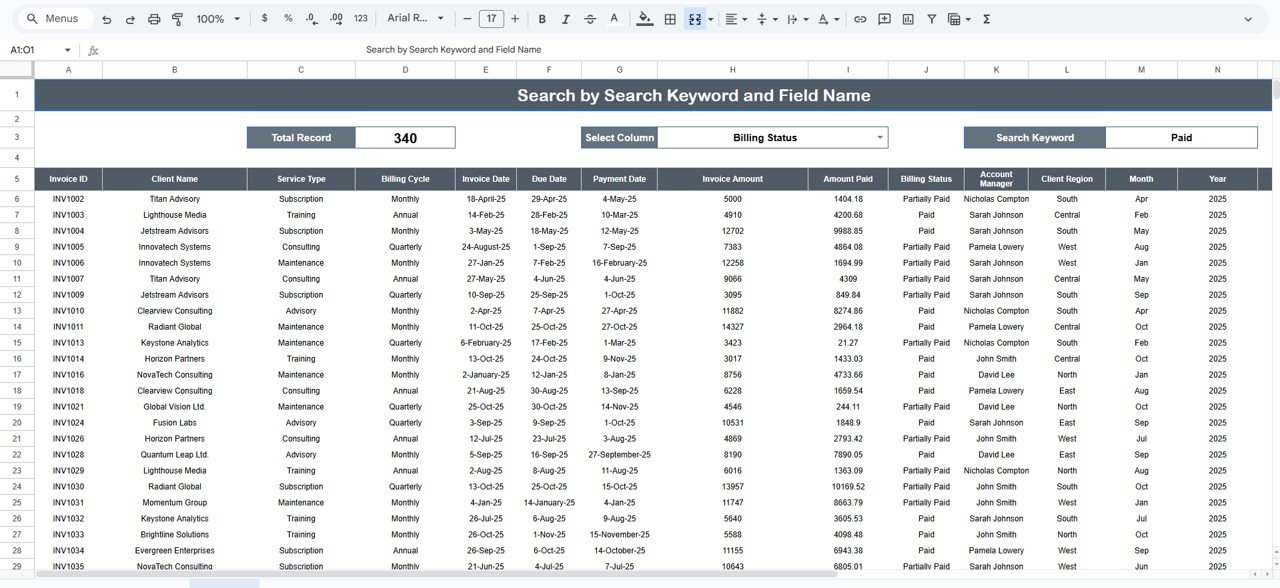
🔍 Search Sheet Tab
Quickly locate client or invoice records using the search functionality.
Search by:
Invoice ID
Client Name
Account Manager
Billing Status
Service Type
Client Region
💡 Example: Search “Pending” to instantly view all pending invoices for immediate follow-up.
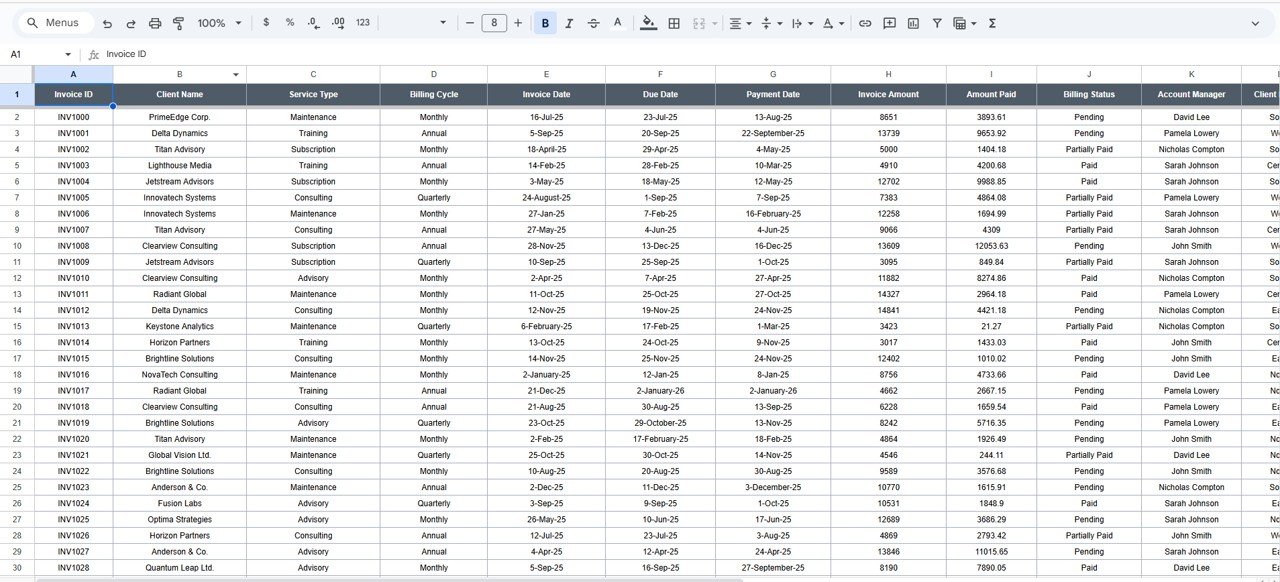
🧾 Data Sheet Tab
The foundation of the dashboard — this tab contains all invoice records.
Columns include:
Invoice ID | Client Name | Service Type | Billing Cycle | Invoice Date | Due Date | Payment Date | Invoice Amount | Amount Paid | Billing Status | Account Manager | Client Region | Month | Year | Payment Delay (Days) | Paid On-Time (Yes/No)
This dataset drives all dashboard calculations and visualizations.
⚙️ Support Sheet Tab
Contains dropdown sources for standardized data entry — such as Service Types, Billing Cycles, Account Managers, and Regions. This ensures consistency and accuracy across all sheets.
📦 What’s Inside the Dashboard
✅ Automated KPIs – Instantly view total invoices, payments, and delays.
✅ Interactive Charts – Visualize performance by service, client, and region.
✅ Smart Search Tab – Locate invoices instantly.
✅ Dynamic Filtering – Focus on specific cycles or statuses.
✅ Collaborative Access – Multiple team members can update data live.
✅ Real-Time Refresh – Dashboards update automatically as data changes.
✅ No Software Needed – 100% built in Google Sheets.
💰 Key Performance Indicators (KPIs)
| KPI Name | Unit | Formula | Definition | Type |
|---|---|---|---|---|
| # of Invoices | Count | COUNT(Invoices) | Total number of invoices created | UTB |
| Total Invoice Amount | USD | SUM(Invoice Amount) | Total billed value | UTB |
| Total Amount Paid | USD | SUM(Amount Paid) | Total payments received | UTB |
| Average Payment Delay | Days | AVERAGE(Payment Delay) | Average days delayed beyond due date | LTB |
| Overdue Invoices | Count | COUNTIF(Status=”Overdue”) | Number of invoices past due | LTB |
| Partially Paid Invoices | Count | COUNTIF(Status=”Partially Paid”) | Invoices paid partially | LTB |
| On-Time Payment % | % | (On-Time Paid / Total Paid) * 100 | Percentage of invoices paid within due date | UTB |
| Collection Efficiency % | % | (Total Paid / Total Invoiced) * 100 | Measures overall collection rate | UTB |
| Pending Amount | USD | SUM(Invoice Amount – Amount Paid) | Outstanding payment value | LTB |
| Payment Delay Trend | Days | Current Delay – Previous Delay | Change in delay over time | LTB |
🧩 Advantages of the Dashboard
💼 Centralized View: Track all invoices and payments in one platform.
📈 Data-Driven Decisions: Identify clients with consistent delays.
💡 Automated Analytics: Real-time visual insights for billing efficiency.
🌍 Cloud Collaboration: Access and edit data from anywhere.
🔒 Accuracy & Transparency: Reliable KPIs ensure audit-ready records.
🚀 Opportunities for Improvement
Google Apps Script Automation: Auto-send payment reminders to clients.
Google Form Integration: Collect invoice data from sales or project teams.
Email Triggers: Notify account managers when invoices go overdue.
Multi-Currency Support: Add exchange rate automation for global billing.
Monthly Reports: Automate summary exports as PDFs.
Best Practices
✔ Update invoice data regularly for accurate insights.
✔ Reconcile payments at the end of each billing cycle.
✔ Use consistent billing codes and naming conventions.
✔ Protect sensitive data with restricted access rights.
✔ Review overdue invoices weekly to avoid collection delays.
Conclusion
The Client Billing & Invoice Management Dashboard in Google Sheets is a complete financial control system designed for efficiency and clarity.
It provides instant visibility into your billing performance, identifies late-paying clients, and helps ensure smoother cash flow management — all in a simple, visual format.
Whether you’re managing a small business or a large client portfolio, this dashboard is your go-to solution for automated, transparent, and collaborative billing management.
Click here to Read detailed blog post
Watch the step-by-step video Demo:
🔗 Visit our YouTube channel to learn step-by-step tutorials
Compatibility and Requirements
- Works in Google Sheets. You need a free Google account and a web browser.
- Dropdowns on the Data sheet take their values from the Support sheet. Google explains dropdowns in Create an in-cell dropdown list.
Frequently Asked Questions
Which sheet tabs are included?
Four tabs: Dashboard, Search, Data and Support.
Where do I enter my invoices?
Enter them on the Data sheet. Each row holds the invoice ID, client name, service type, billing cycle, invoice date, due date, payment date, invoice amount, amount paid, billing status, account manager and client region. The Dashboard charts update from this data.
Which charts are on the Dashboard?
Seven charts: invoices by billing status, amount paid by billing cycle, average payment delay by billing cycle, invoices paid on time (%), invoices by service type, average payment delay by client region, and invoice amount vs amount paid by account manager. Four cards sit above them: number of invoices, total invoice amount, total amount paid and average payment delay in days.
How do I find one client’s invoices?
Open the Search sheet. You can search by invoice ID, client name, account manager, billing status, service type or client region.
Is there an Excel or Power BI version?
Yes. See the Client Billing Dashboard in Excel and the Client Billing Dashboard in Power BI.
Related Billing Templates
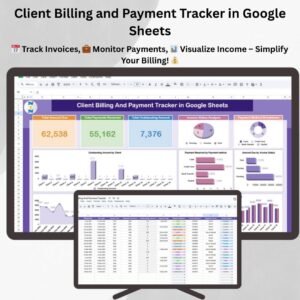
- Client Billing and Payment Tracker in Google Sheets: a tracker for client bills and payments
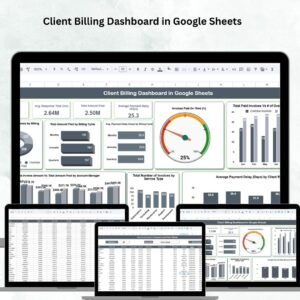
- Client Billing Dashboard in Google Sheets: another billing dashboard in Google Sheets
- Client Billing Dashboard in Excel: the same topic in Excel
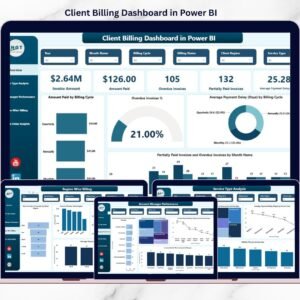
- Client Billing Dashboard in Power BI: the Power BI edition
- Professional Invoice Template in Google Sheets: create the invoices you track here
Browse all Google Sheets dashboards.



























Reviews
There are no reviews yet.