

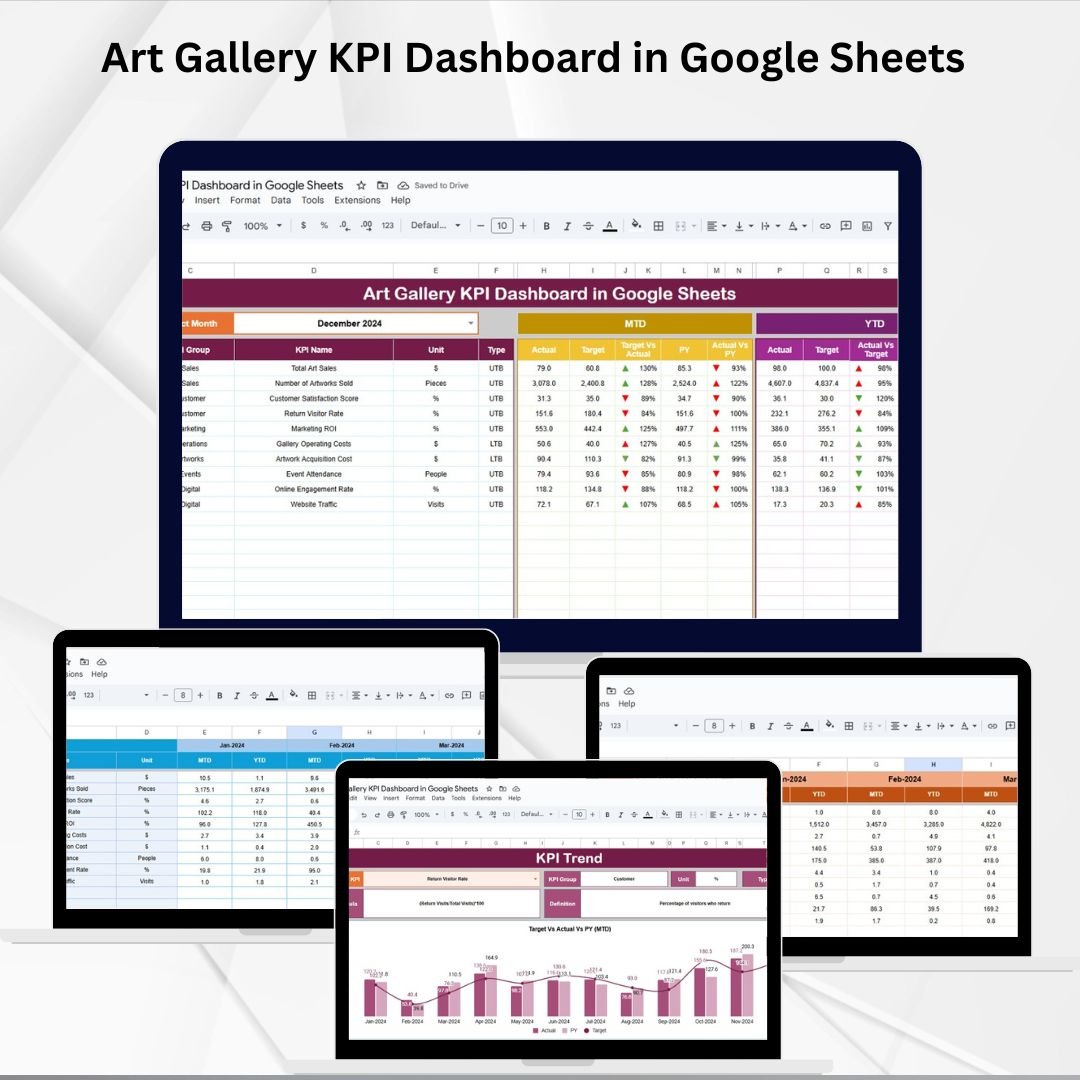
Running an art gallery requires balancing sales, exhibitions, artist management, and visitor engagement all at once. Without a structured system, it’s easy to lose sight of trends, miss opportunities, or struggle with underperforming areas. That’s why we created the Art Gallery KPI Dashboard in Google Sheets — a ready-to-use solution that consolidates all your key performance indicators (KPIs) in one place. 🎨📊
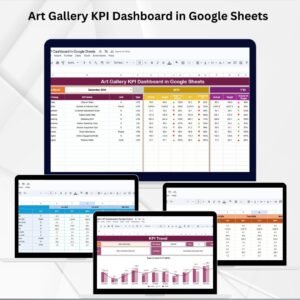
With this interactive dashboard, gallery managers, curators, and administrators can monitor Month-to-Date (MTD) and Year-to-Date (YTD) performance, compare results with targets and last year, and identify trends instantly. This template turns complex reporting into a clear, visual overview, empowering you to make informed decisions with ease.
🔑 Key Features of Art Gallery KPI Dashboard in Google Sheets
📋 Dashboard Sheet
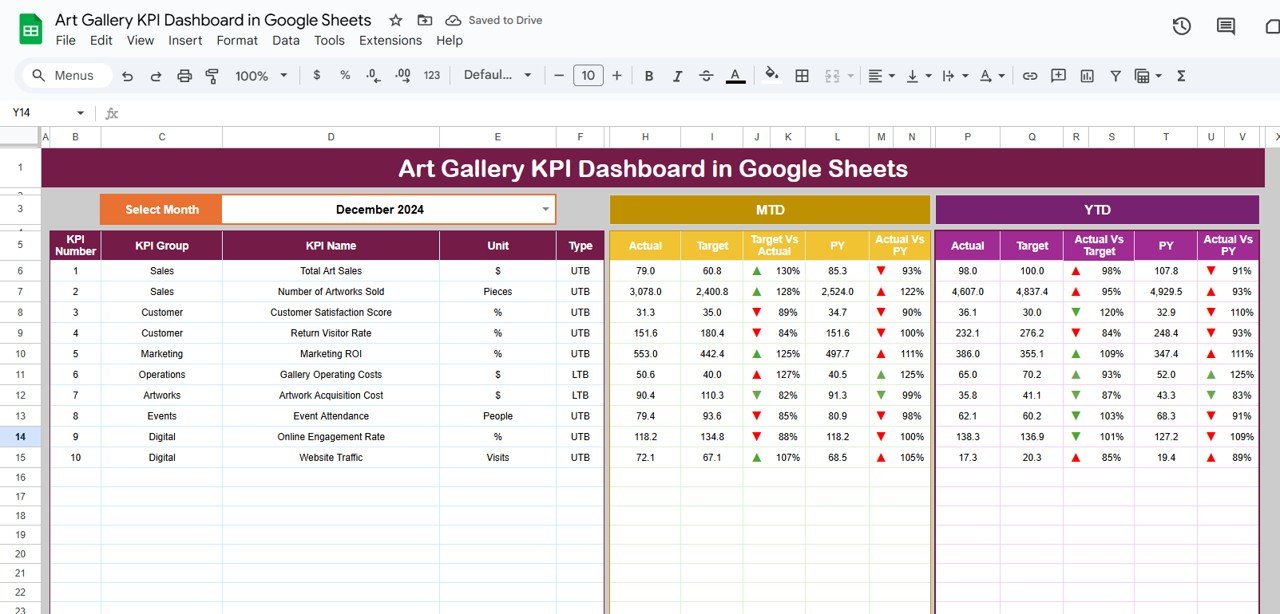
Centralized KPI overview.
Month selection dropdown updates all data dynamically.
MTD and YTD Actuals, Targets, and Previous Year comparisons.
Conditional formatting with green/red arrows to quickly spot performance gaps.
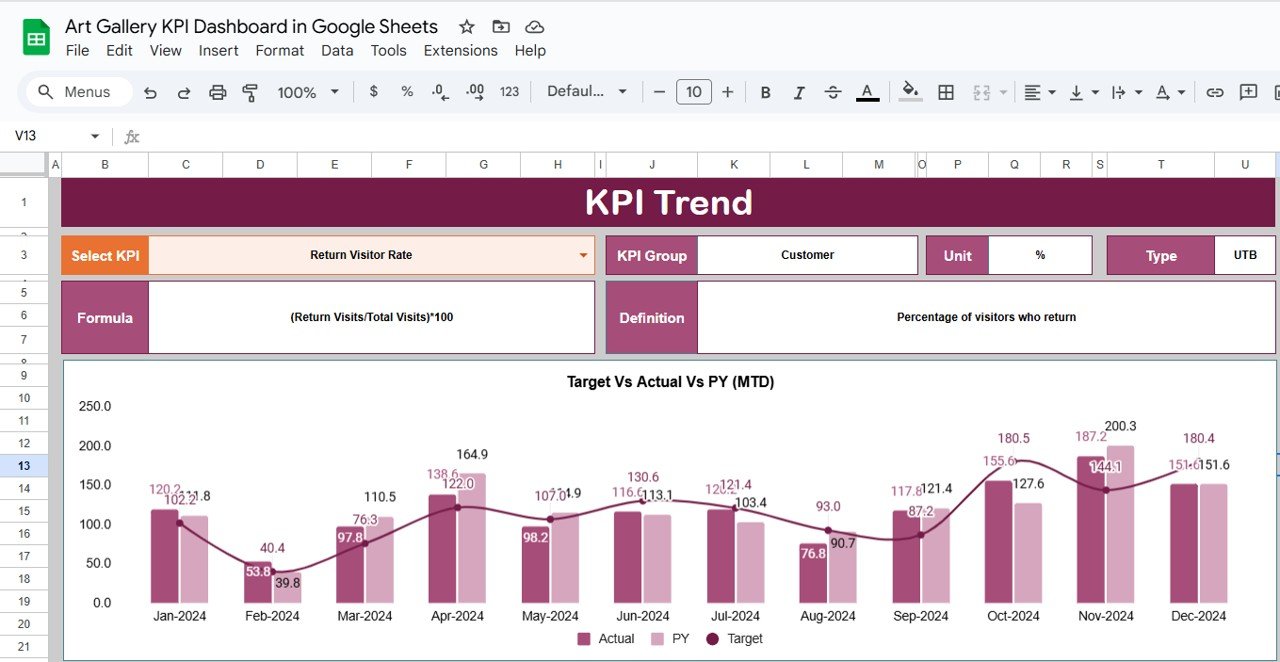
📈 KPI Trend Sheet
Select any KPI to analyze trends over time.
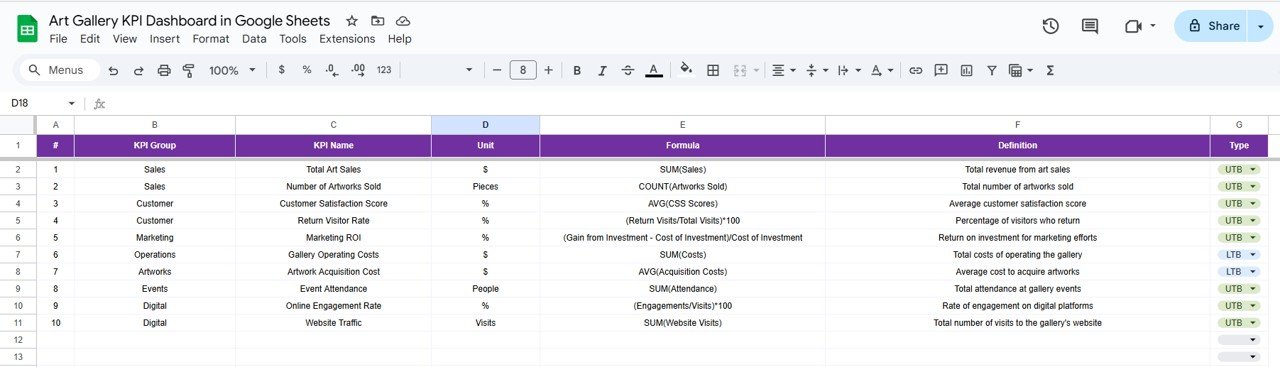
Displays KPI group, unit, type (Upper-the-Better or Lower-the-Better).
Shows formula and KPI definition for easy understanding.
Trend charts to visualize performance growth or decline.
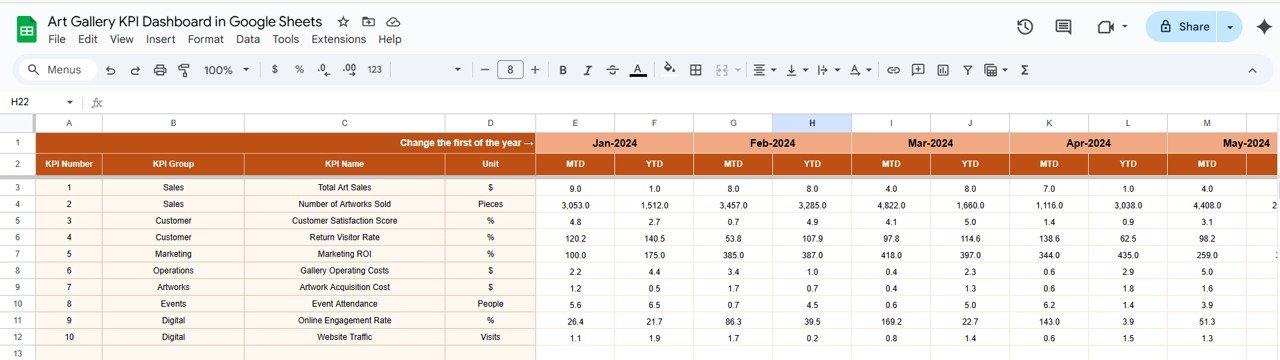
🧾 Actual Numbers Sheet
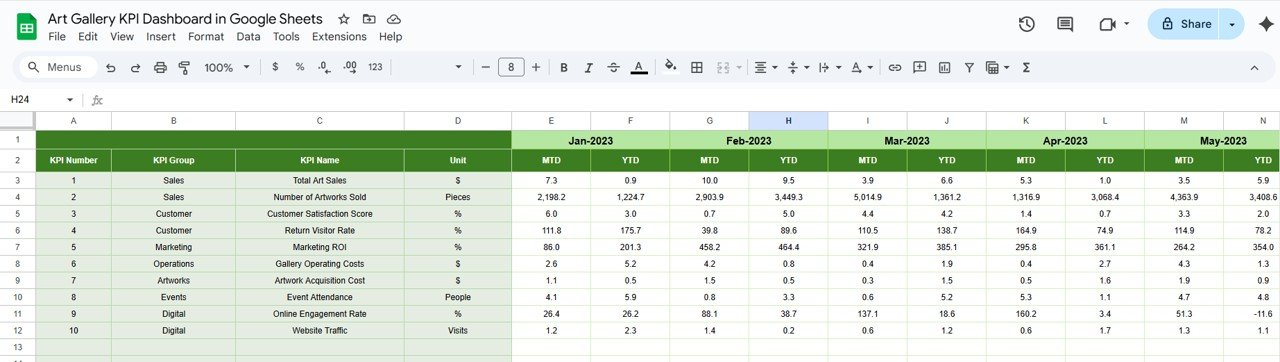
Enter monthly actual data.
Auto-calculates MTD and YTD values.
Simple structure for quick updates.
🎯 Target Sheet
Set monthly and yearly KPI targets.
Compare actual vs. planned performance.
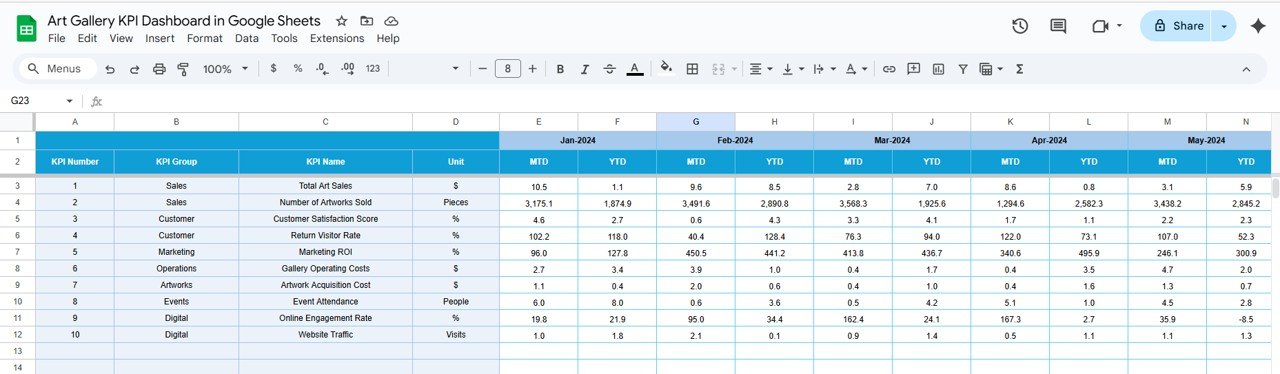
📊 Previous Year Numbers Sheet
Store last year’s data for historical comparisons.
Enables growth tracking and performance benchmarking.
📘 KPI Definition Sheet
Clear documentation of all KPIs.
Includes KPI name, group, unit, formula, definition, and type.
📦 What’s Inside the Dashboard?
✅ Dashboard Tab – Overview of gallery performance
✅ KPI Trend Tab – Drill down into individual KPIs
✅ Actual Numbers Tab – Data entry for current year
✅ Target Tab – Monthly and annual goals
✅ Previous Year Tab – Store last year’s metrics
✅ KPI Definition Tab – Detailed reference for each KPI
✅ Pre-filled Sample Data – Understand usage instantly
Everything is built into a Google Sheets format, making it accessible, shareable, and easy to customize.
🎯 Who Can Benefit from This Dashboard?
👩🎨 Gallery Managers – Oversee daily and yearly gallery performance.
🖼️ Curators – Evaluate exhibitions and artist engagement.
📈 Finance Teams – Track sales revenue and budget utilization.
👥 Event Coordinators – Monitor visitor counts and attendance rates.
🏢 Art Institutions – Manage multiple galleries with clear reporting.
🧠 How to Use the Art Gallery KPI Dashboard
Enter monthly data in the Actual Numbers Sheet.
Add KPI targets in the Target Sheet.
Input previous year’s results in the Previous Year Tab.
Use the Dashboard Tab to monitor overall gallery performance.
Explore the KPI Trend Sheet for detailed analysis.
No coding or advanced software required — just Google Sheets. 🌍
🎨 Examples of KPIs to Track
Artwork Sales ($) – Revenue from art sold.
Visitor Count – Total visitors in a given month.
Exhibition Attendance Rate (%) – Attendance vs. capacity.
Average Sale per Visitor ($) – Revenue per visitor.
Artist Performance Score – Based on sales and engagement.
Budget Utilization (%) – Actual vs. planned spending.
Each KPI comes with its unit, formula, and type for clarity.
🚀 Advantages of Using This Dashboard
Real-Time Insights – Dynamic charts update as data is entered.
Target Tracking – Instantly compare actuals vs. goals.
Trend Analysis – Spot patterns with MTD, YTD, and year-over-year data.
Time-Saving – All data in one place, no manual reports needed.
Customizable – Add or remove KPIs to suit your gallery’s focus.
🔗 Click here to read the Detailed blog post
Watch the step-by-step video Demo:





Reviews
There are no reviews yet.