

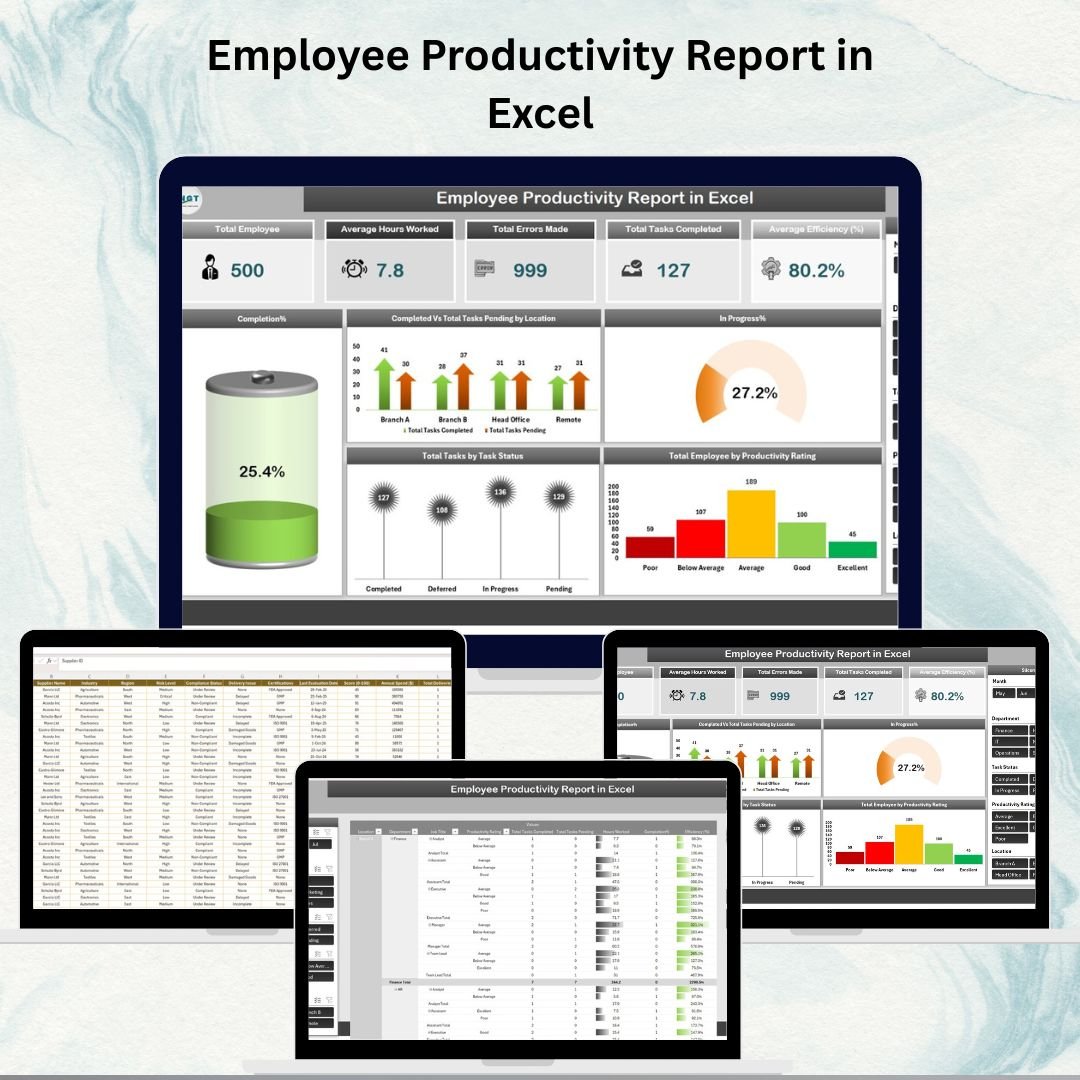
A productive workforce is the foundation of every successful organization — but without accurate reporting, it’s difficult to know where performance gaps exist and where improvements are needed. The Employee Productivity Report in Excel is a ready-to-use, fully customizable tool designed to help HR managers, team leads, and operations supervisors monitor and analyze employee performance in real time.
This report consolidates key productivity metrics — such as hours worked, tasks completed, efficiency percentage, and errors made — in one centralized dashboard. With automated cards, interactive charts, and powerful pivot tables, managers can easily identify top performers, detect bottlenecks, and make data-driven decisions to improve overall productivity.
Whether you need high-level insights or granular employee-level performance details, this Excel report helps you stay in control and continuously optimize your workforce.
🔑 Key Features of the Employee Productivity Report
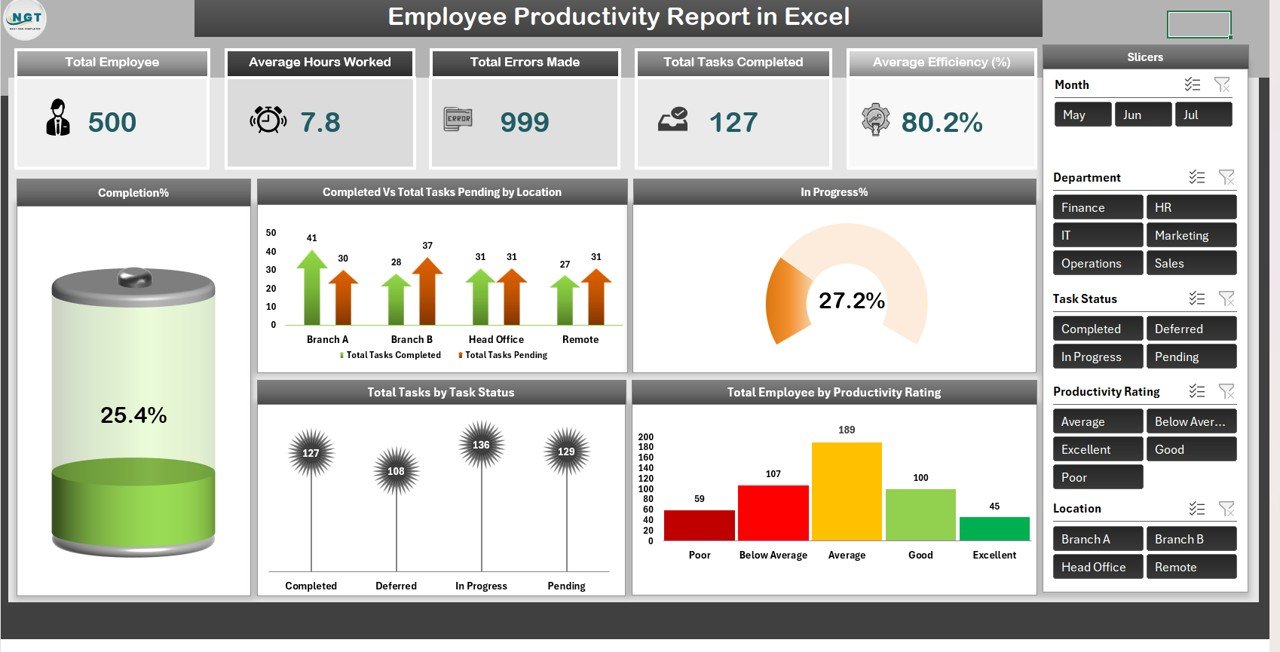
📌 Summary Sheet Tab – High-Level Performance Snapshot
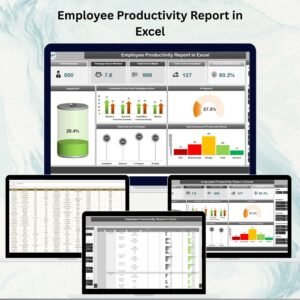
Cards Include:
Total Employees
Average Hours Worked
Total Errors Made
Total Tasks Completed
Average Efficiency (%)
Charts Include:
Task Completion (%)
Completed vs Pending Tasks by Location
In Progress (%)
Total Employees by Productivity Rating
Total Tasks by Task Status
Quickly visualize the overall performance and spot areas of concern at a glance.
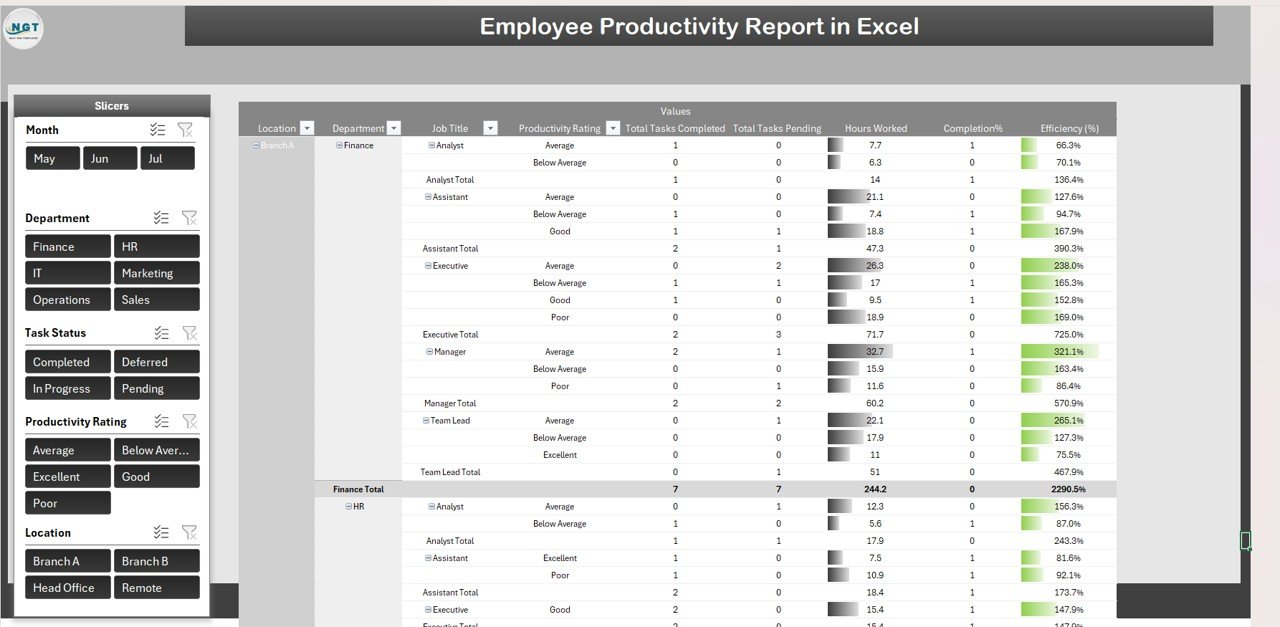
📌 Report Sheet Tab – Detailed Pivot Table Analysis
Filter by department, location, or individual employee
Compare efficiency across teams
Drill down into errors, pending tasks, and performance trends
Identify high/low-performing employees instantly
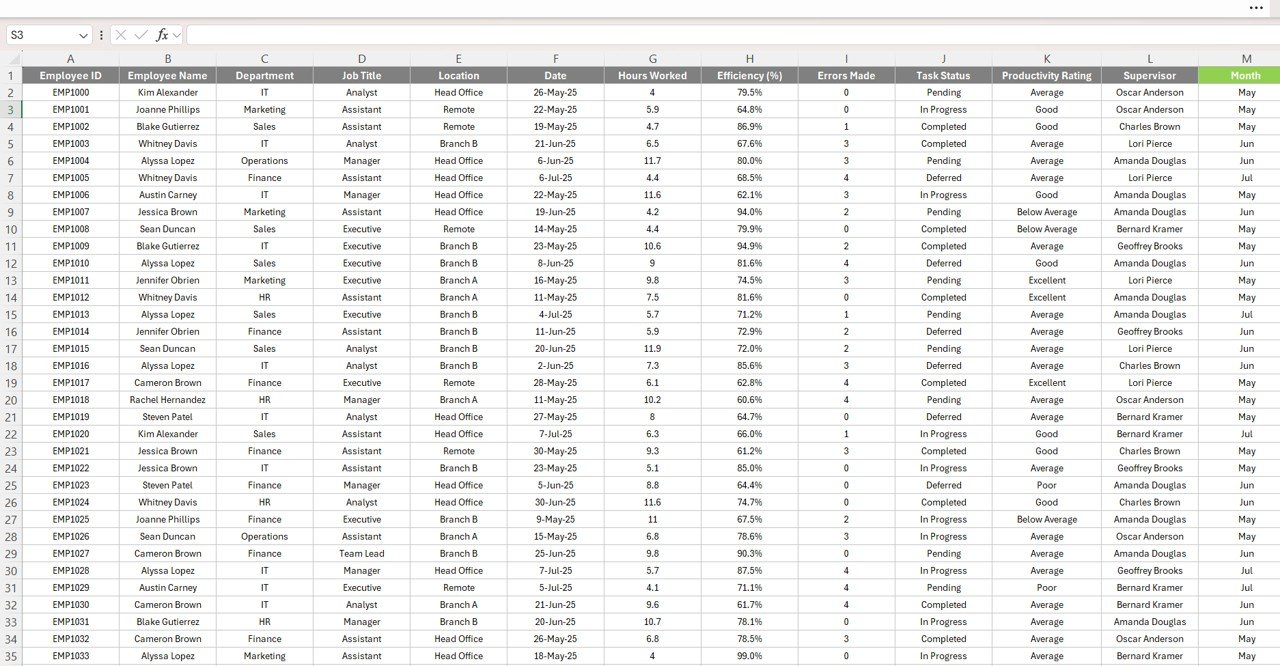
📌 Data Sheet Tab – Centralized Employee Database
Fields include:
Employee Name & ID
Department & Location
Hours Worked
Tasks Completed
Tasks Pending
Errors Made
Efficiency (%)
All charts, cards, and pivot tables update automatically once this sheet is updated
📦 What’s Inside the Employee Productivity Report?
✅ Summary Sheet – KPI cards & performance charts
✅ Report Sheet – Pivot-based productivity analysis
✅ Data Sheet – Centralized employee performance log
✅ Pre-built Formulas & Visuals – No setup required
✅ Customizable Fields – Add new KPIs or visuals as needed
✅ Sample Data Included – See how everything works instantly
🧠 How to Use the Report
Open the file and go to the Data Sheet
Enter/update employee performance data
View overall metrics and trends via the Summary Sheet
Use the Report Sheet to drill down by team, location, or individual
Track progress and take action to improve overall productivity
👥 Who Can Benefit from This Report?
👩💼 HR Managers – Track performance and identify training needs
👨💼 Team Leaders – Monitor day-to-day task progress and efficiency
🏢 Operations Managers – Analyze workplace productivity across locations
📊 Business Analysts – Generate reports for performance review meetings
🔗 Click here to read the Detailed blog post
Watch the step-by-step video Demo:


Reviews
There are no reviews yet.