

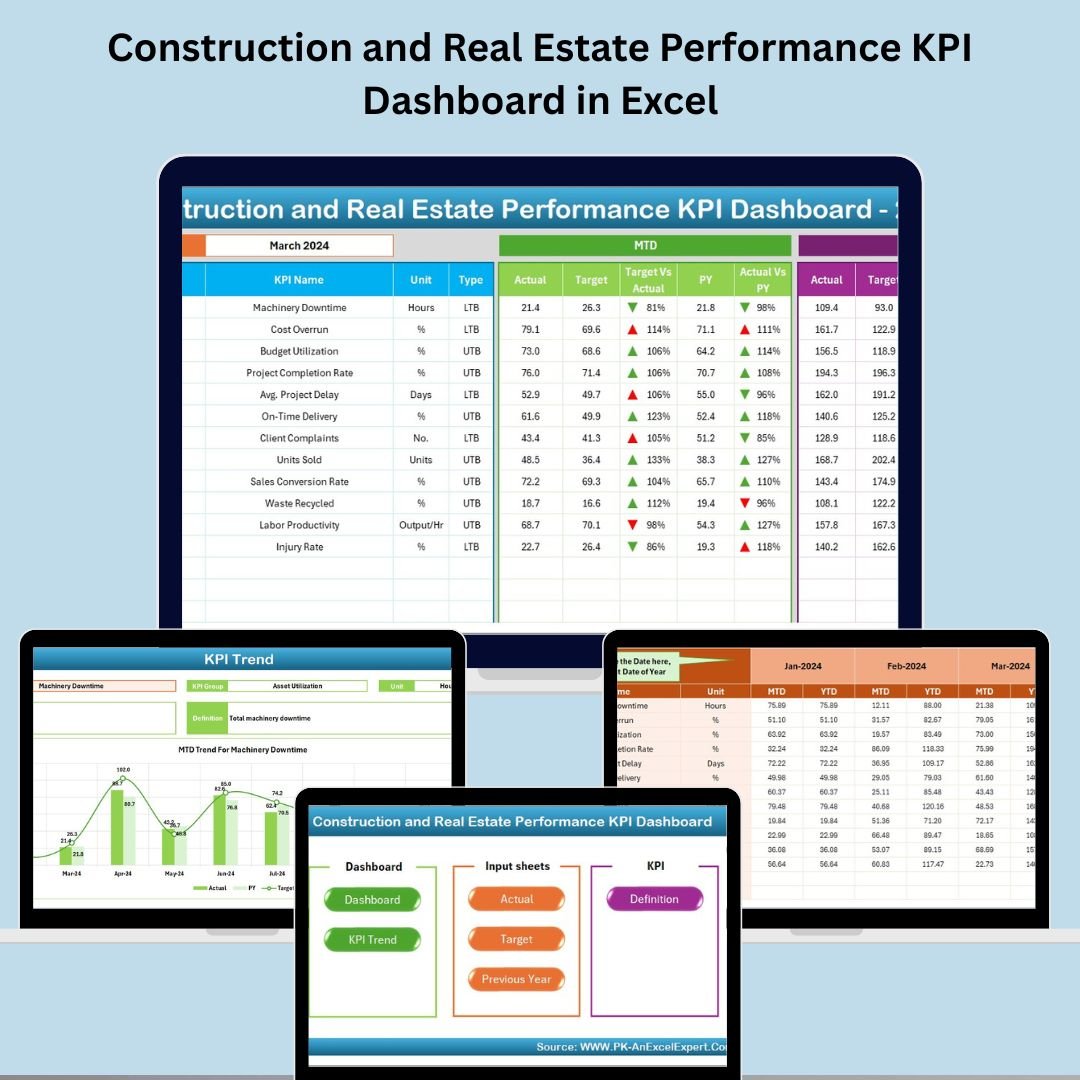

Managing multiple construction projects or real estate assets can be chaotic without the right tools. If you’re tired of scattered spreadsheets, confusing reports, and missed targets—this dashboard is your game-changer!
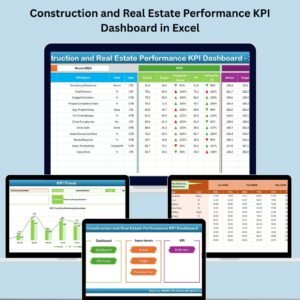
Introducing the Construction and Real Estate Performance KPI Dashboard in Excel —a powerful, ready-to-use Excel tool designed to help managers, developers, engineers, and consultants monitor KPIs, track trends, and make smarter, data-driven decisions—all from one central place.
Let’s explore why this dashboard is a must-have for your operations 👇
🛠️ Key Features of Construction and Real Estate KPI Dashboard in Excel
✅ All-in-One Centralized Dashboard

Switching between tabs is over! The Home sheet acts as your navigation control panel, giving you quick access to Dashboard, KPI Trend, Input Sheets, and more.
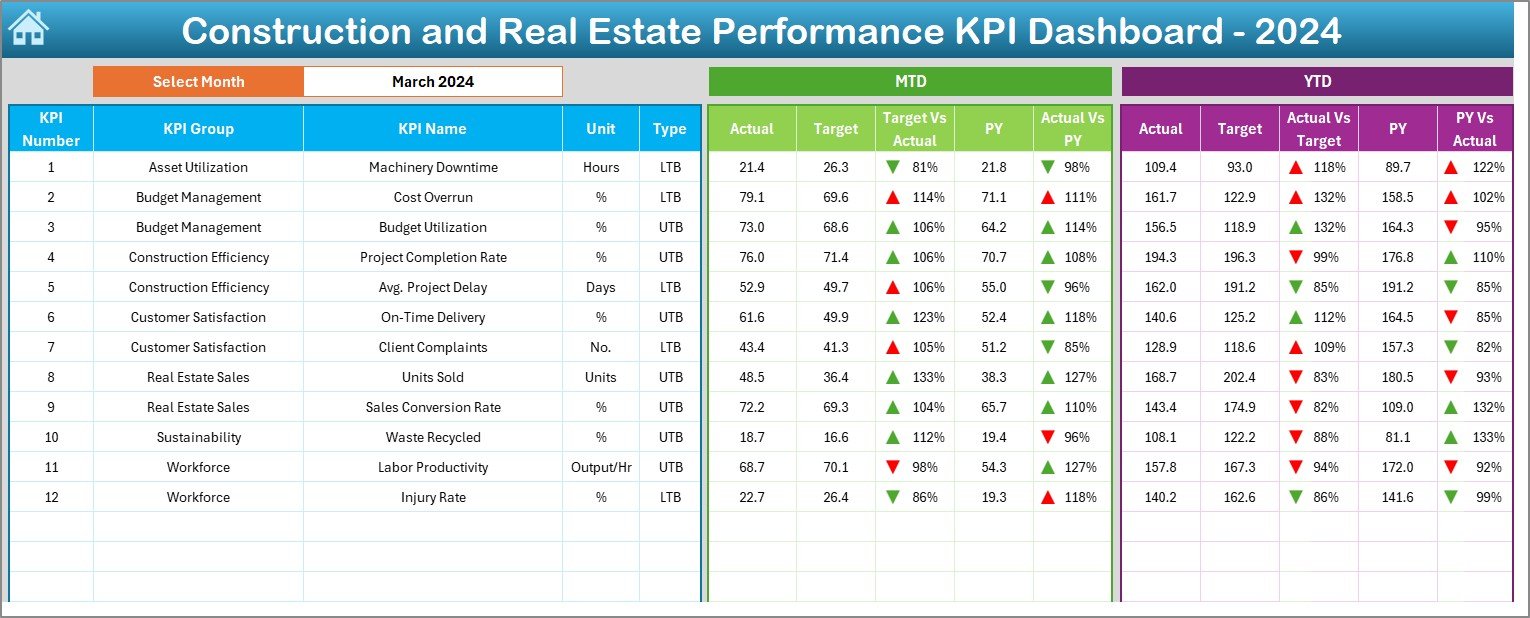
📊 Dynamic Dashboard with MTD/YTD Analysis
Choose any month and instantly see how your projects are performing with Month-To-Date (MTD) and Year-To-Date (YTD) Actual, Target, and Previous Year numbers.
🔻 Visual Performance Indicators
Spot progress or problems in seconds using up/down arrows, conditional formatting, and color-coded highlights.
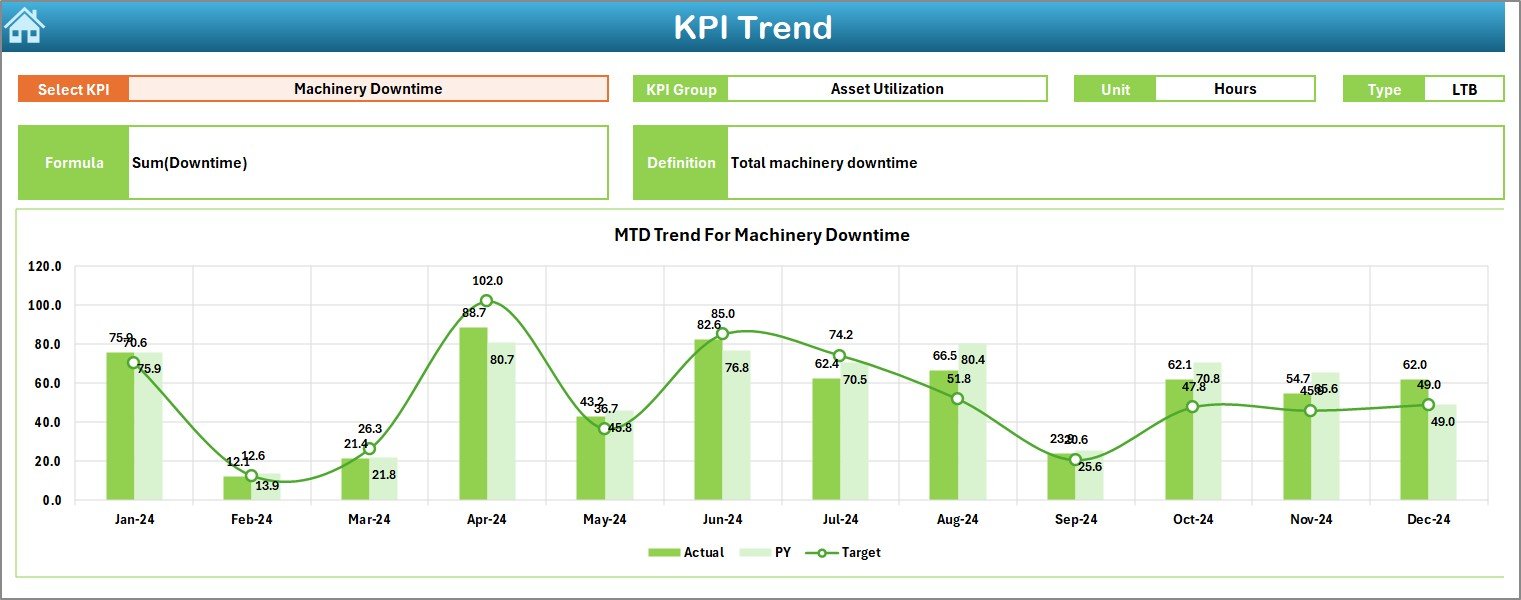
📈 KPI Trend Analysis
Drill into individual KPIs using trend charts that clearly show movement over time for both MTD and YTD metrics.
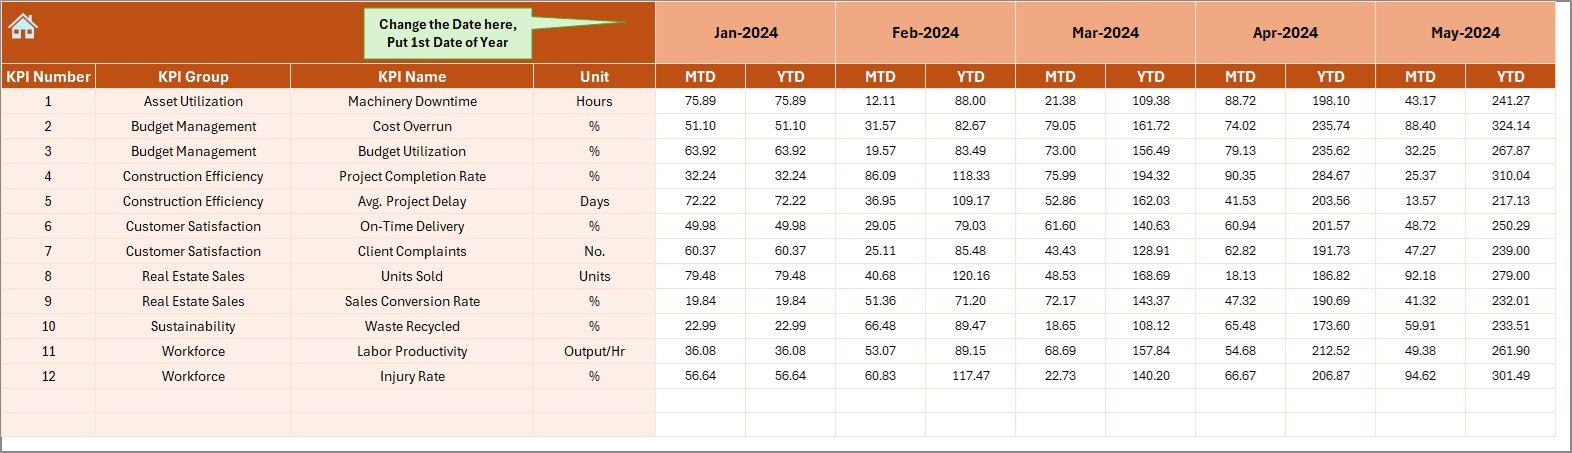
📥 Simple Data Entry
Enter Actuals, Targets, and Previous Year values in predefined sheets—no complex formulas required!
🔄 Auto-Updating Charts
Once you enter the data, charts across sheets update instantly. No manual refresh needed!
📦 What’s Inside the Construction and Real Estate KPI Dashboard
This Excel template comes packed with 7 professionally designed worksheet tabs:
🏠 Home Sheet
Acts as a navigation hub with buttons to access each sheet directly.
📊 Dashboard Sheet
Displays KPI cards for the selected month with visuals comparing Actual vs Target and Previous Year. Includes MTD & YTD data.
📈 KPI Trend Sheet
Dropdown to select a KPI and view trend lines along with definitions, formulas, and type (UTB or LTB).
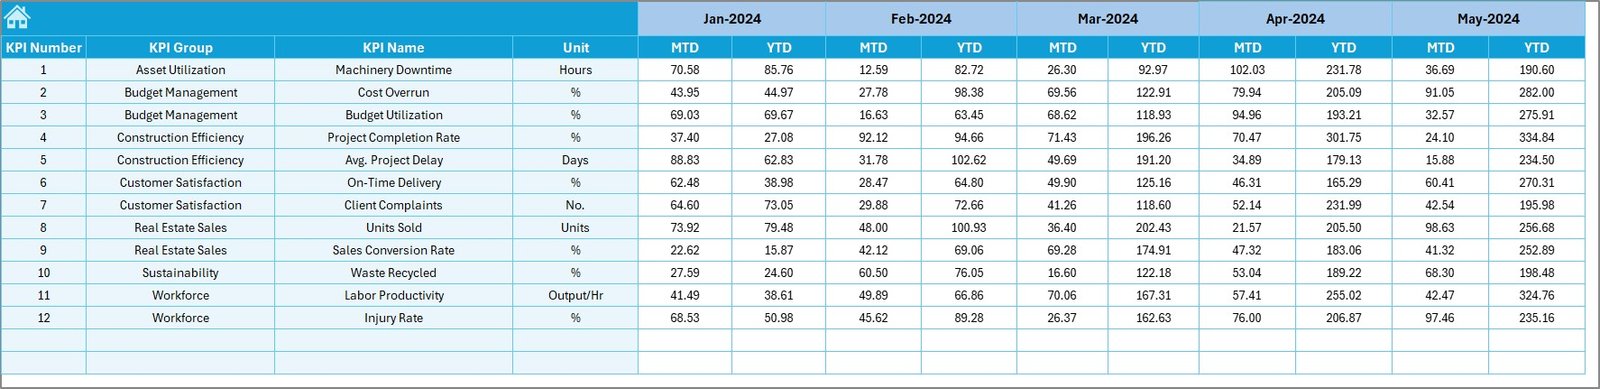
🧾 Actual Numbers Input Sheet
Enter your actuals for MTD and YTD values. The E1 cell lets you set the starting month of the year.
🎯 Target Sheet
Input your planned targets for every KPI, month by month.
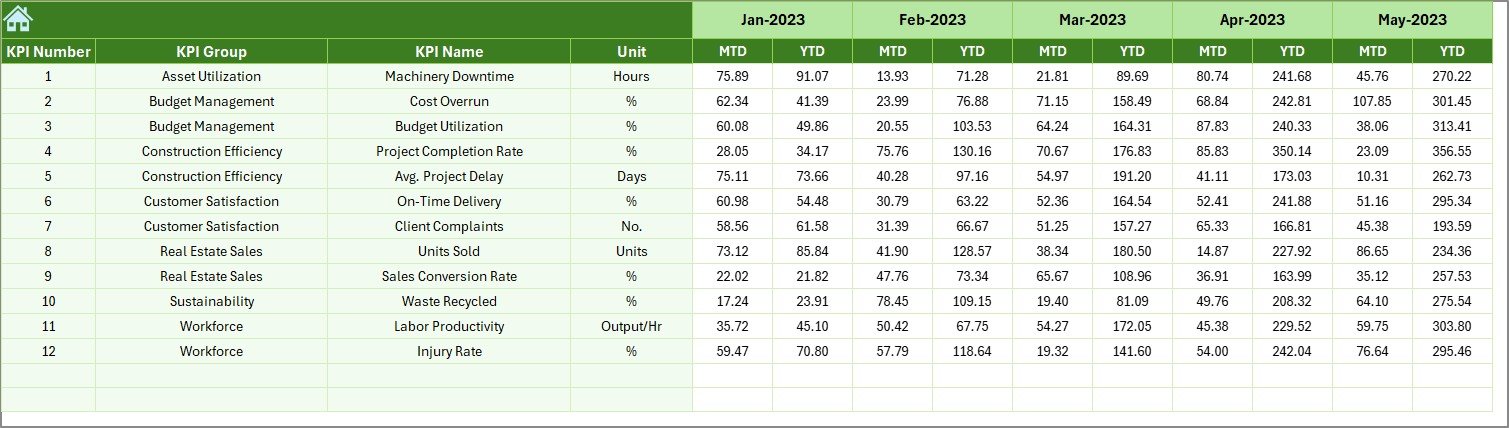
🕓 Previous Year Numbers
Store historical data to compare year-over-year performance.
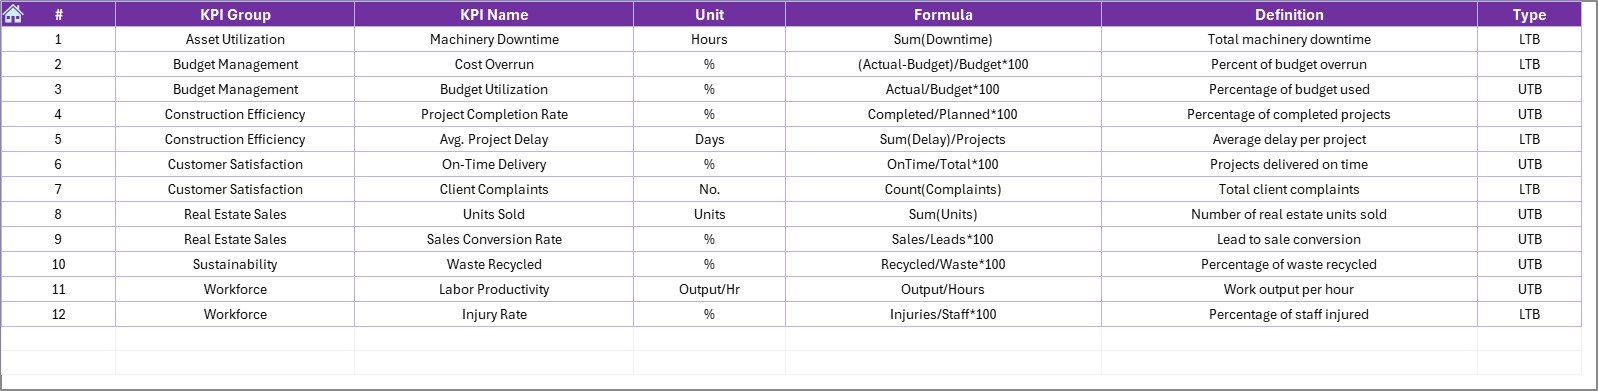
📚 KPI Definition Sheet
Maintain a well-documented list of all your KPIs with units, formulas, and explanations.
📌 How to Use the Dashboard
✔️ Step 1: Enter actual values in the Actual Numbers Input tab
✔️ Step 2: Set monthly goals in the Target Sheet
✔️ Step 3: Input last year’s data in the Previous Year Sheet
✔️ Step 4: Select KPIs in the Trend Sheet to see performance charts
✔️ Step 5: Open the Dashboard Tab, select the month from D3, and visualize your full KPI story!
👥 Who Can Benefit from This Dashboard?
✅ Construction Project Managers – Track budget variance, safety metrics, and timeline KPIs.
✅ Real Estate Developers – Monitor sales, cost per sq. ft., client satisfaction, and energy efficiency.
✅ Site Engineers & Contractors – Ensure you’re staying on schedule and within cost estimates.
✅ Business Analysts & Consultants – Provide clients with real-time, structured reports.
✅ SMEs & Startups – A cost-effective alternative to complex ERP systems.
🔥 Real Impact, Real Results
A real estate firm used this dashboard across 10 projects and achieved:
⬇️ 30% drop in safety incidents
📈 18% improvement in project timelines
💰 Better control over budget fluctuations
Why? Because everything they needed was in one Excel file.
✅ Built in Excel—No Complex Software Needed
🔹 Works on any Excel-enabled computer
🔹 No coding or VBA knowledge required
🔹 Fully customizable with your KPIs
🔹 One-time payment—no subscriptions
🛠️ Ideal for:
Construction & Real Estate Firms
Infrastructure Projects
Renovation & Facility Managers
Property Consultants
PMOs & Freelancers
🔗 Click here to read the Detailed blog post
🎥 Visit our YouTube channel to learn step-by-step video tutorials
Watch the step-by-step video tutorial:
Compatibility and Requirements
- Works in Microsoft Excel desktop (Excel 2016 or later, or Microsoft 365).
- No coding or VBA knowledge is required.
- The month and KPI are picked from dropdowns. Microsoft explains these lists in Create a drop-down list.
Frequently Asked Questions
Which sheets are in the workbook?
Home, Dashboard, KPI Trend, Actual Numbers Input, Target, Previous Year Numbers and KPI Definition sheets.
How do I pick the month shown?
Select the month in cell D3 on the Dashboard sheet. Cell E1 on the Actual Numbers Input sheet sets the first month of your year.
What does UTB or LTB mean?
Each KPI has a type. UTB means upper the better and LTB means lower the better.
Can I use my own KPIs?
Yes. The dashboard is customizable with your own KPIs.
Related Construction and Real Estate Templates
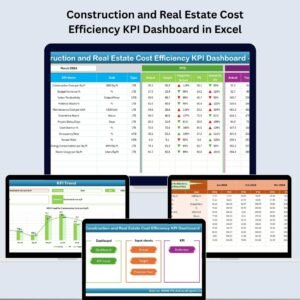
- Construction and Real Estate Cost Efficiency KPI Dashboard in Excel: focus on cost efficiency
- Construction and Real Estate Project Timeline KPI Dashboard in Excel: focus on schedules
- Construction and Real Estate Risk Management KPI Dashboard in Excel: focus on project risk
- Construction KPI Dashboard in Excel: general construction KPIs
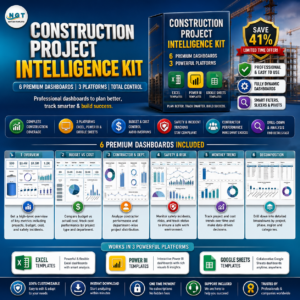
- Construction Project Intelligence Kit: 6 construction templates in one bundle
Browse all Excel KPI dashboards or the Excel project management templates.





























Reviews
There are no reviews yet.