In the fast-paced corporate world, keeping track of workplace safety and compliance isn’t optional—it’s essential. But what if you could monitor everything from incident reports to department-wise compliance trends—all in one place?Safety and Compliance Dashboard in Excel
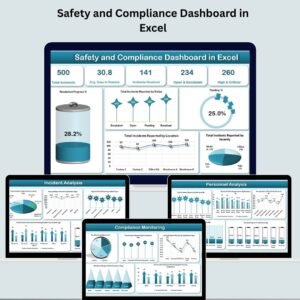
🚨 Introducing the Safety and Compliance Dashboard in Excel—a powerful, ready-to-use template that puts data-driven safety management right at your fingertips. Built entirely in Microsoft Excel, this dashboard offers a crystal-clear view of safety incidents, resolution progress, compliance performance, and team accountability—without needing any coding or BI tools.Safety and Compliance Dashboard in Excel
Whether you’re a safety officer, HR professional, compliance manager, or operations lead, this dashboard is your go-to solution for improving workplace safety and driving performance with real-time insights.Safety and Compliance Dashboard in Excel

✨ Key Features of Safety and Compliance Dashboard in Excel
This dynamic Excel dashboard comes with multiple tabs designed for visibility, tracking, and action:
✅ Overview Sheet
Your control tower for safety performance. It displays:
Total Incidents Reported
Resolved & Pending Cases
Escalation Summary
High & Critical Cases
Average Resolution Days
Plus, visual charts like:📊 Incidents by Status, Location, and Severity
📈 Progress Trends and Open Case Ratios
🔍 Incident Analysis Sheet
Break down every type of incident to identify trends:
Total Incidents by Type
Time to Resolve per Type
Resolution Rate per Incident Type
High vs Low Severity Breakdown
🧩 Compliance Monitoring Sheet
Track safety policy adherence across departments:
Department-Wise Compliance
Resolution Time per Compliance Type
Compliance-Based Incident Analysis
📉 Progress % for each compliance metric
👥 Personnel Analysis Sheet
Who’s performing well? Who needs coaching?
Incidents Assigned per Employee
Avg. Resolution Time by Person
Progress & Performance per Resolver
📅 Monthly Trends Sheet
Stay ahead with time-based analysis:
Incidents by Month
Resolution & Pending Trends
Average Days to Resolve Over Time
📥 Data Sheet
Manual input sheet for all incident logs:
Includes fields for Incident Type, Date, Department, Severity, Status, and more
🔄 Auto-refreshes all visuals instantly
📦 What’s Inside the Safety and Compliance Dashboard?
When you download the product, you get:
✔ A professionally formatted Excel file
✔ Prebuilt pivot tables and formulas
✔ All charts and visuals auto-linked to your data
✔ Dropdowns for quick entry
✔ Color-coded insights (Red = risk, Green = good)
✔ Easy customization options
No plugins. No macros. Just plug in your data—and go!
🛠️ How to Use the Safety and Compliance Dashboard
Open the Excel file and go to the
Data Sheettab.Enter your incident data including dates, types, severity, and status.
Instantly view updates on the Overview and analysis sheets.
Filter by location, person, or department as needed.
Share or export the file as PDF or PowerPoint for reporting.
💡 Pro Tip: Update the data weekly to keep everyone informed and accountable!
👥 Who Can Benefit from This Dashboard?
This dashboard is designed for:
🏭 Manufacturing units
🏥 Healthcare organizations
🏫 Schools and universities
🧑🔧 Safety and compliance teams
👩💼 HR and administration managers
🧑⚖️ Audit and inspection coordinators
Basically—any workplace that needs to track, resolve, and report safety incidents with accuracy and speed.
🔗 Click here to read the Detailed blog post
🎥 Visit our YouTube channel to learn step-by-step video tutorials