
🎉 Black Friday Sale: 40% OFF everything with code BF40 · ends 1 Dec  Shop now →

AR-VR Industry KPI Dashboard in Google Sheets

Google Sheets - instant download

Original price was: ₹1,999.00.Current price is: ₹999.00.
Details, requirements and demo below
Sale!

AR-VR Industry KPI Dashboard in Google Sheets

Original price was: ₹1,999.00.Current price is: ₹999.00.

📊 A Google Sheets KPI Dashboard built for AR-VR businesses!
Track metrics, set targets, and optimize performance—visually and efficiently.

✨ Key Features:
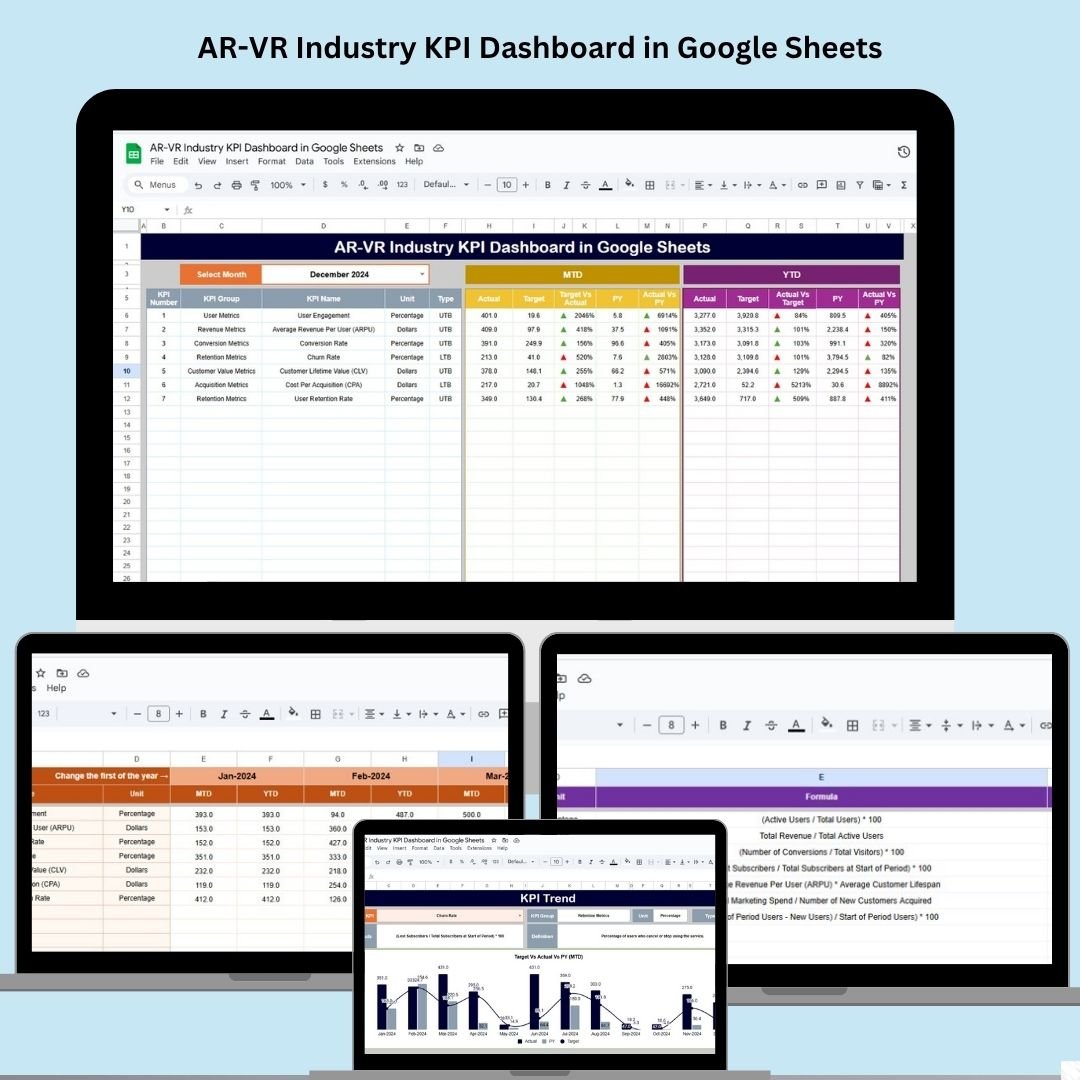
✅ Dynamic Dashboard – Select any month and track MTD/YTD performance
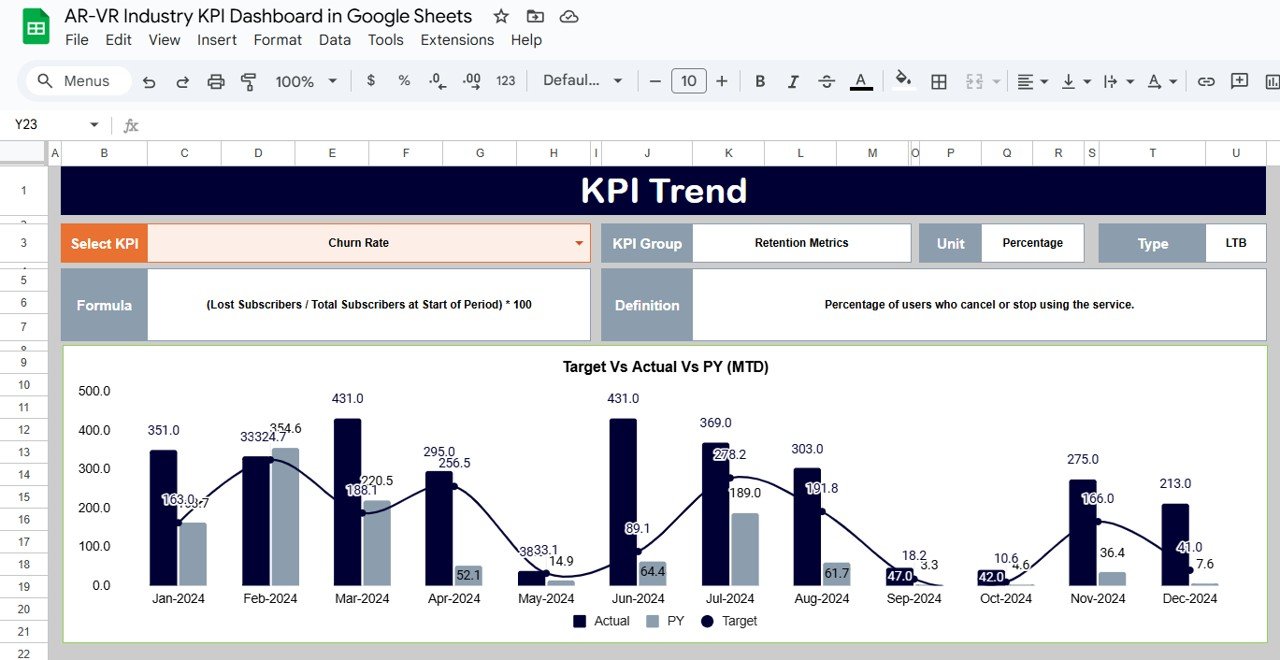
✅ KPI Trend Sheet – Visualize progress with dropdown-filtered charts
✅ Actual & Target Sheets – Easily input your data and goals
✅ Previous Year Comparison – Benchmark current success
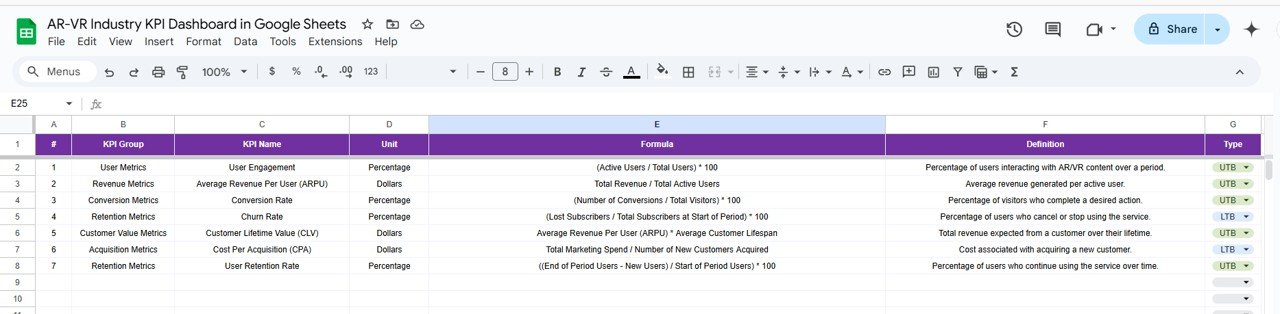
✅ KPI Definition Tab – Clear formulas, groups, and metrics
✅ Real-Time Insights – Monitor progress across all critical KPIs
✅ Customizable Layout – Add new KPIs, change labels, and brand it
✅ Google Sheets Format – No downloads or software required
✅ Great for AR/VR Teams – Designed for modern product and ops teams
✅ Shareable & Cloud-Based – Collaborate in real-time

Customize this template for your business (optional)

Handled by email: we contact you within 1 business day. One revision round included. What is included

- +
Have your own data? Build a dashboard from your Excel, CSV or Google Sheets file free in Dashboard Studio →

💡 Buy any 2 templates and save 20% automatically at checkout.

Included in All-Access Templates. Get this plus 7,000+ templates for ₹4,999.00 a year. Compare plans →
Pricing country
Prices follow your selected country; checkout uses your billing country.
Google Sheets Complete Course: Beginner to Advanced courseLaunch offer
🎓 NEXTGENTEMPLATES ACADEMY
Want to build Google Sheets like this yourself?
Google Sheets Complete Course: Beginner to Advanced

Formulas, lookups, QUERY, dynamic arrays, pivot tables, charts, live data and Apps Script, ending with an interactive sales dashboard. 74 lessons by PK with a practice file for every lesson.

Track, measure, and optimize your augmented reality (AR) and virtual reality (VR) business performance with this powerful, fully customizable AR-VR Industry KPI Dashboard in Google Sheets. Designed specifically for AR-VR developers, marketers, and product teams, this dashboard delivers real-time insights on key performance indicators—without the cost or complexity of heavy-duty software.

Whether you’re launching immersive apps, managing user engagement, or analyzing content effectiveness, this dashboard gives you a clear picture of your operational health and strategic progress—all within the familiar and flexible Google Sheets platform.
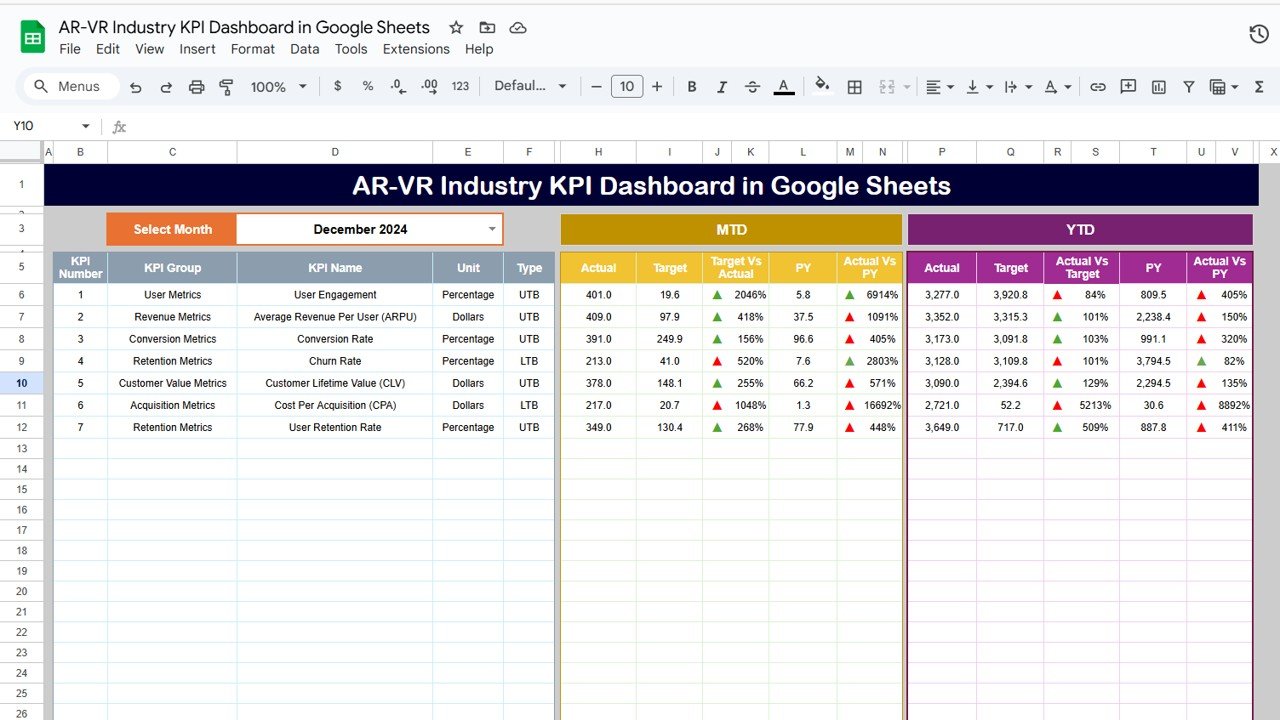
AR-VR Industry KPI Dashboard in Google Sheets

✨ Key Features of AR-VR KPI Dashboard

🗂️ 1. Dashboard Sheet – Visual Business Summary

  • 📅 Month Selection (D3) – Switch between months to update the dashboard dynamically

  • 📊 MTD and YTD views: Compare Actuals vs Targets vs Previous Year

  • ✅ Conditional Formatting: Arrows show performance status at a glance

📈 2. KPI Trend Sheet – Visualize Progress Over Time

  • 📍 Select KPIs from a dropdown menu

  • 📊 Analyze month-over-month performance

  • 🧠 Review KPI formula, type (UTB/LTB), unit, and definition for full context

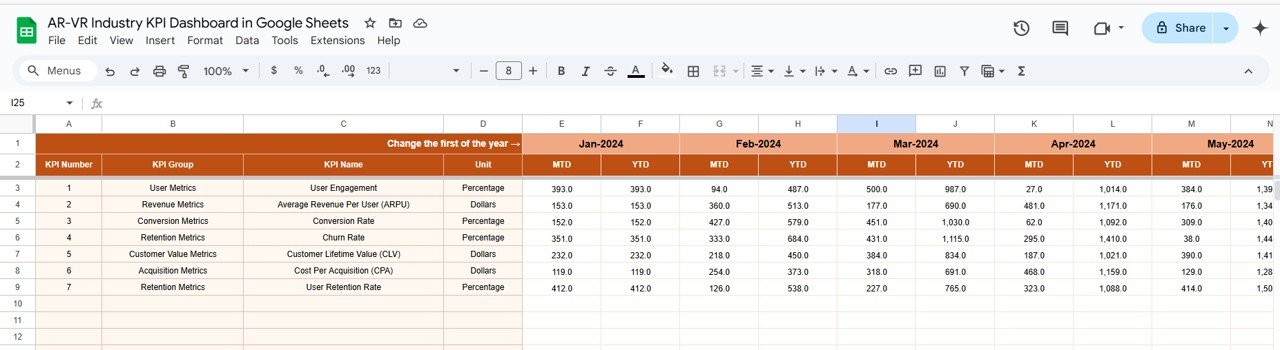
🧾 3. Actual Numbers Sheet – Real-Time Input Center

  • 🔢 Input monthly MTD/YTD values

  • 🗓️ Change starting month in cell E1 to align the entire dashboard view

🎯 4. Target Sheet – Define Your Monthly & Yearly Goals

  • Set KPI targets for MTD and YTD performance

  • Keep your team goal-focused and results-driven

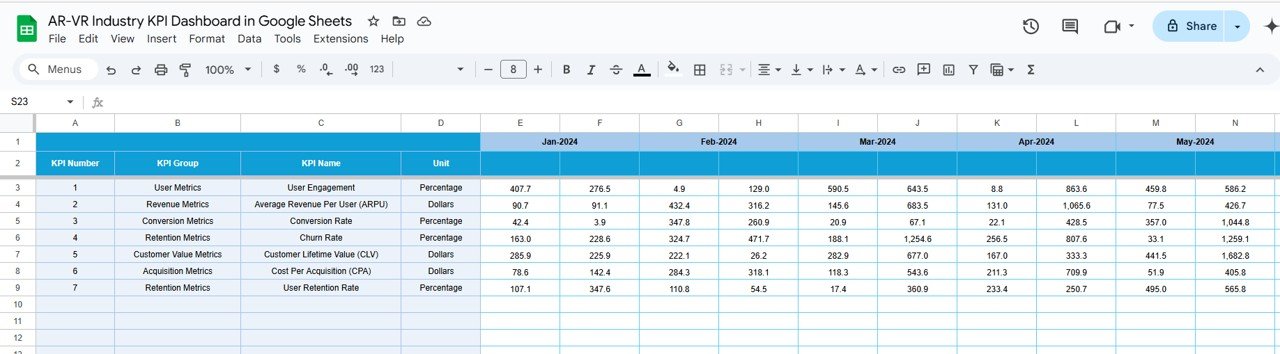
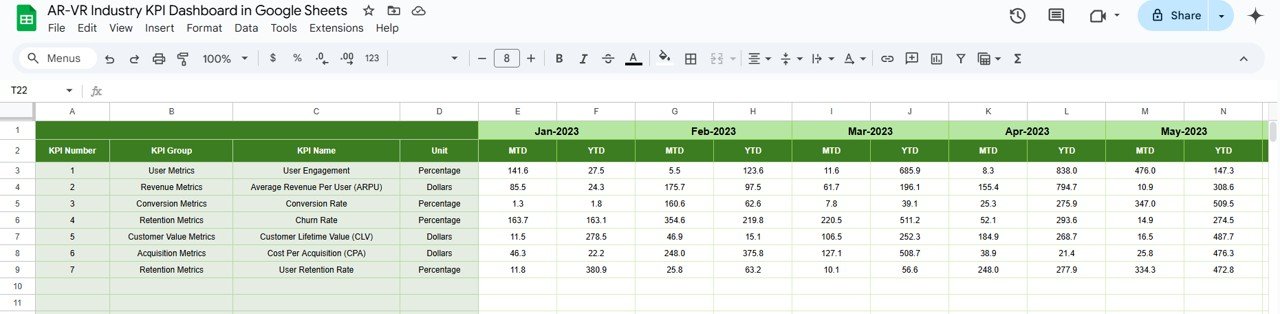
📊 5. Previous Year Sheet – Benchmark Against History

  • Enter last year’s values for each KPI

  • Analyze growth, trendlines, and performance gaps

📘 6. KPI Definition Sheet – Know Your Metrics

  • Define KPI name, group (e.g., Financial, User Engagement), unit, type

  • 📚 Clear explanations and formulas keep all users aligned


🛠️ How to Use the AR-VR KPI Dashboard

👉 Step 1: Enter Actual Performance Data

Use the Actual Numbers Sheet to input your real-world performance each month.

👉 Step 2: Set Clear Targets

Input targets in the Target Sheet to monitor MTD/YTD progress across all KPIs.

👉 Step 3: Compare to Previous Year

Use the Previous Year sheet to evaluate growth and spot long-term trends.

👉 Step 4: Select Month in Dashboard (D3)

See real-time updates of visual metrics and performance indicators.

👉 Step 5: Drill into Trends

Use the KPI Trend tab to monitor individual KPI movement over time and adapt strategy.


👥 Who Can Benefit from This Dashboard?

🎮 AR/VR Product Managers – Track engagement, performance, and user behavior
📈 Marketing Teams – Monitor lead generation, ROI, and cost per acquisition
💡 Founders & Startups – Align product performance with business goals
💻 Tech Developers – Visualize operational KPIs across app versions
🧠 Analysts & Consultants – Deliver high-level reports with live visuals

This dashboard is ideal for AR/VR companies, agencies, freelancers, and startups looking to track growth, user metrics, and profitability in one place.


🔧 Customize to Match Your Business

🧩 Add New KPIs – Simply insert new rows in the KPI Definition tab
🎨 Brand It – Update the theme colors or embed your company logo
⚠️ Conditional Formatting – Highlight red zones or low-performing KPIs
🔁 Extend Time Periods – Modify month ranges to suit your fiscal calendar
🔄 Integrate – Link with tools like Zapier, Google Analytics, or Looker Studio


✅ Click here to read the Detailed blog post

Watch the step-by-step video Demo:


🔗 Visit our YouTube channel to learn step-by-step video tutorials

Compatibility and Requirements

  • Works in Google Sheets. You need a free Google account and a web browser.
  • You pick the month from a dropdown on the Dashboard sheet and the KPI on the KPI Trend sheet. Google explains dropdowns in Create an in-cell dropdown list.

Frequently Asked Questions

Which sheets are included?

Six sheets: Dashboard, KPI Trend, Actual Numbers, Target, Previous Year and KPI Definition.

How do I update the dashboard?

Enter your monthly MTD and YTD figures in the Actual Numbers sheet and your goals in the Target sheet. Then select a month in cell D3 of the Dashboard sheet and the view updates.

Can I compare this year with last year?

Yes. Add last year’s values to the Previous Year sheet and the Dashboard compares them with your actuals and targets.

How do I see the trend for one KPI?

Open the KPI Trend sheet and pick the KPI from the dropdown. It shows month-over-month performance along with the KPI formula, type (UTB or LTB), unit and definition.

Can I add my own KPIs?

Yes. Insert new rows in the KPI Definition sheet to add KPIs. You can also change the theme colors and the starting month in cell E1 of the Actual Numbers sheet.

Is there an Excel version?

Yes. See the AR-VR Industry KPI Dashboard in Excel.

Related KPI Dashboard Templates

Browse all Google Sheets KPI dashboards.

Frequently asked questions

How do I get my own copy?
After purchase you get a link to the Google Sheet. Open it while signed in to your Google account and use File > Make a copy - the copy in your Google Drive is fully yours and editable.
Do I need a paid Google account? Will it expire?
No. A free Google account is enough, and your copy lives in your own Google Drive - it never expires and there is nothing to renew.
Does it work on Mac, phone or tablet?
Yes - in any browser on Windows, Mac or Chromebook, and in the Google Sheets mobile app for viewing and quick entries.
Can I share it with my team?
Yes. Share your copy with colleagues using Google's normal sharing, with view or edit rights as you choose.
Can I change the design and formulas?
Yes, your copy is fully editable - colours, labels, logo, formulas and charts. If a range is protected, use Data > Protect sheets and ranges to remove it in your copy.
Are there macros or add-ons?
No macros or add-ons - it uses normal Google Sheets formulas and charts.
Is it a one-time payment or a subscription?
One-time payment. No subscription, no per-user fees and nothing to renew - the file is yours to keep.
How do I get the file after payment?
Instantly. The download link appears on screen after checkout, is emailed to you, and stays under My Account > Downloads on our website. If the email does not arrive within a few minutes, check your spam or promotions folder.
Is a user manual included?
Most of our newer products include a PDF user manual in the download. If yours does not have one, message us with your order number and we will send it.
Do I get free updates?
Bug fixes are always free - if something does not work as described, we fix it and send you the corrected file. New versions with new features are not included in the price, unless this product's description says otherwise.
Can you customise it for me?
Yes. Small changes to this template (your columns, categories, logo, colours, minor layout) cost the template price plus $40-80 (Rs 3,000-6,000 + GST), quoted once you send your list. A fully custom build is usually $100-200 (Rs 8,000-18,000 + GST) with two revision rounds. Email your requirements to [email protected] or message us on WhatsApp.
Can I use it for my business or my clients?
Yes, for your own personal or internal business use, for as long as you like. Reselling or redistributing the template is not allowed.
What is your refund policy?
Because these are digital downloads, they are non-refundable once delivered - except when the product does not match its description (report it within 48 hours of purchase) or there is a technical problem our team cannot fix within 72 hours. Email [email protected] with your order number.
How do I get help?
Email [email protected] (Mon-Fri, 10 AM-7 PM IST) or message us on WhatsApp +91 80770 90260 (chat only, no calls). Please include your order number.

Still have a question? Click Need help? at the bottom-left to ask our assistant, or message us on WhatsApp.

Application

Google Sheets

Template Type

KPI Dashboard

Price

Paid

Business Or Department

Entertainment

Reviews

There are no reviews yet.

Only logged in customers who have purchased this product may leave a review.

You may also like…

AR-VR Industry KPI Dashboard in Google SheetsAR-VR Industry KPI Dashboard in Google Sheets
Original price was: ₹1,999.00.Current price is: ₹999.00.
- +
Have your own data? Build a dashboard from your Excel, CSV or Google Sheets file free in Dashboard Studio →
Scroll to Top