

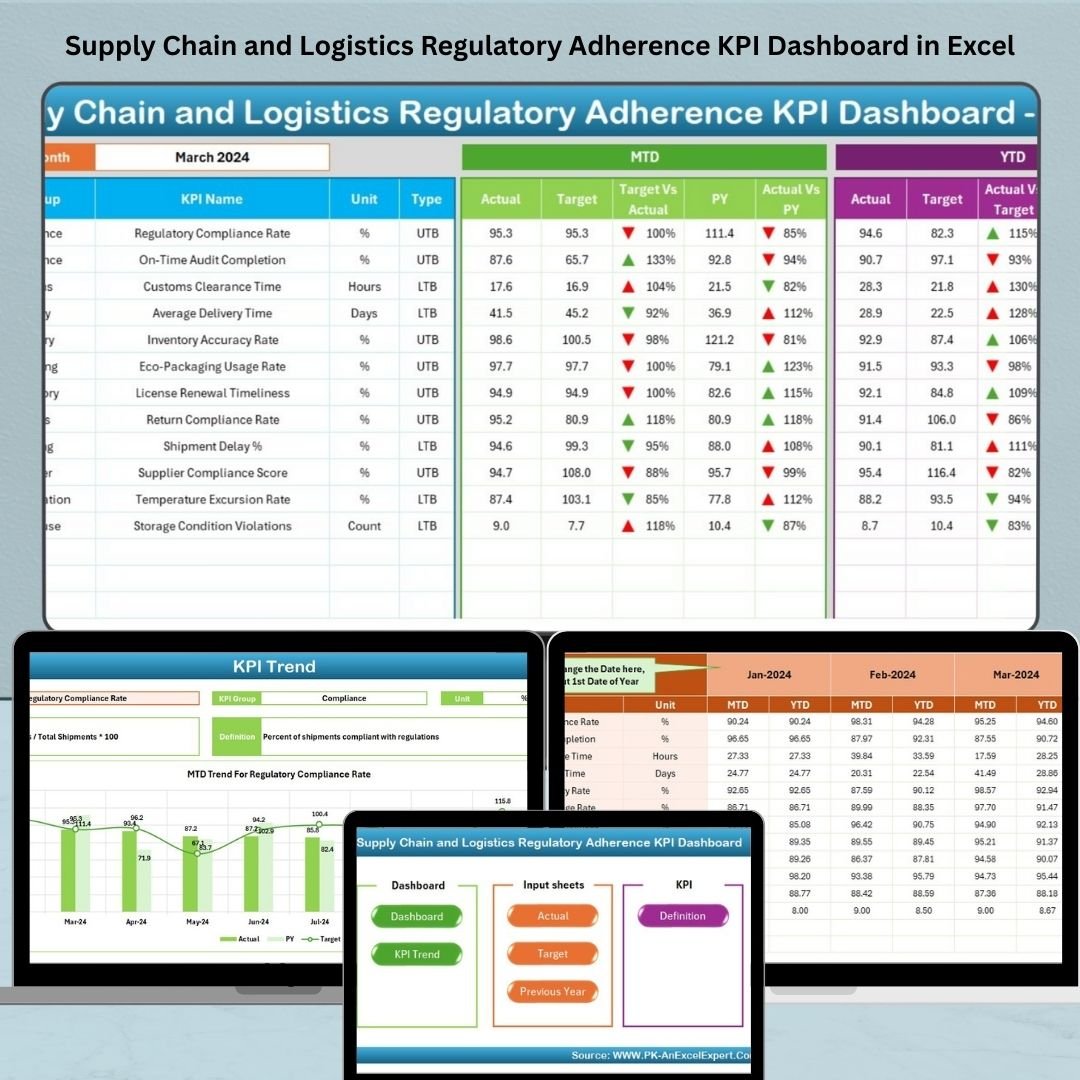
In today’s global supply chain landscape, one thing is certain—regulatory compliance is not optional. From customs procedures to environmental standards, missing a single benchmark could cost you time, money, or worse—your reputation. That’s why we created the Supply Chain and Logistics Regulatory Adherence KPI Dashboard in Excel, your all-in-one solution for tracking regulatory KPIs with precision.
Whether you’re a compliance officer, logistics analyst, or supply chain consultant, this dashboard equips you with the tools to monitor, analyze, and act—all within Excel. No code. No fluff. Just clear, actionable insights.
✨ Key Features of Supply Chain & Logistics Regulatory Adherence KPI Dashboard
📊 Interactive Dashboard View
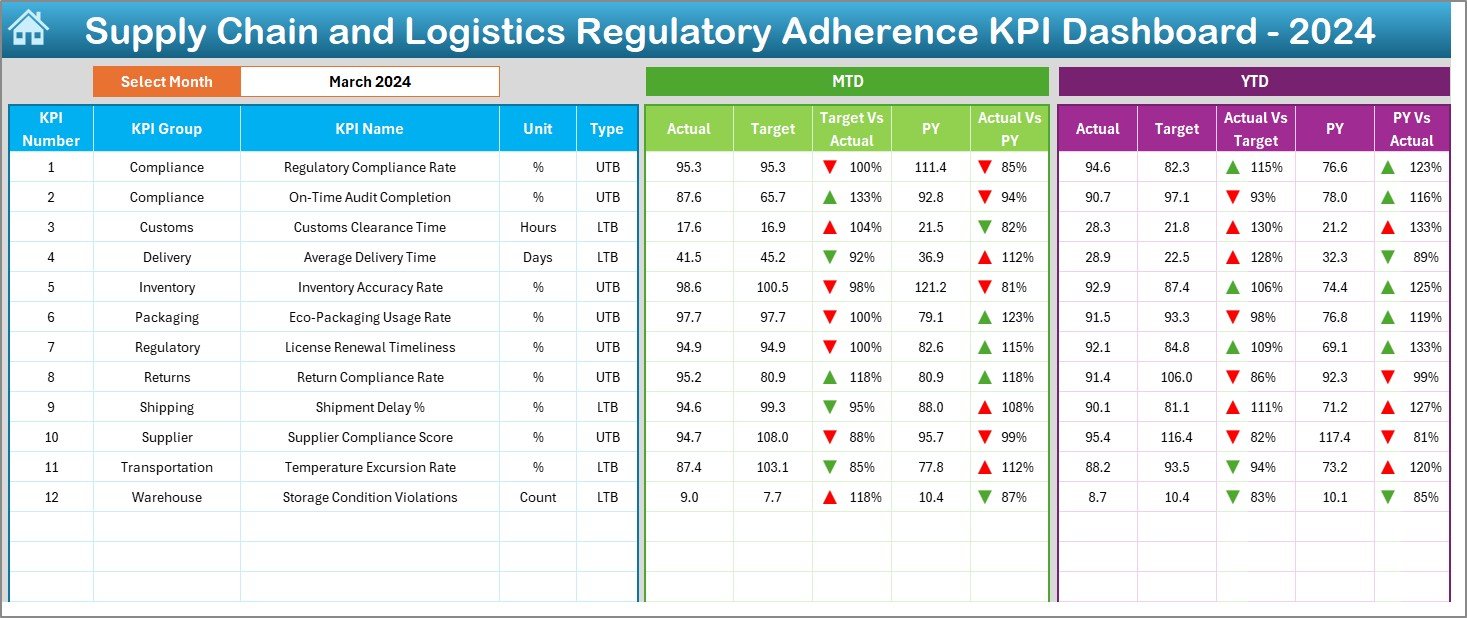
Select any month from a drop-down and instantly see:
MTD (Month-To-Date): Actual vs Target vs Previous Year
YTD (Year-To-Date): Actual vs Target vs Previous Year
🔺🔻 Visual indicators with conditional formatting to spot red flags
📈 KPI Trend Analysis
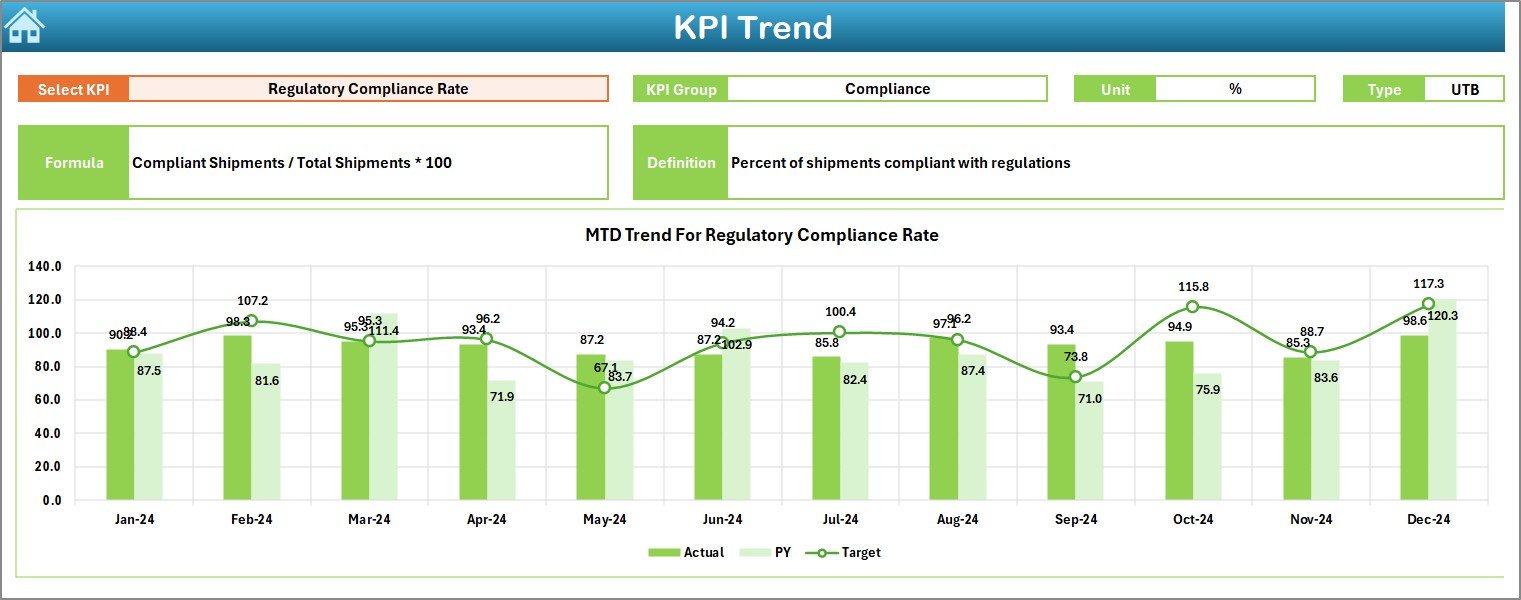
Dive deep into KPI behavior over time with dynamic charts showing:
MTD & YTD trend comparisons
Actual vs Target vs Previous Year
Smart slicers to filter by KPI Name
📋 KPI Metadata Management
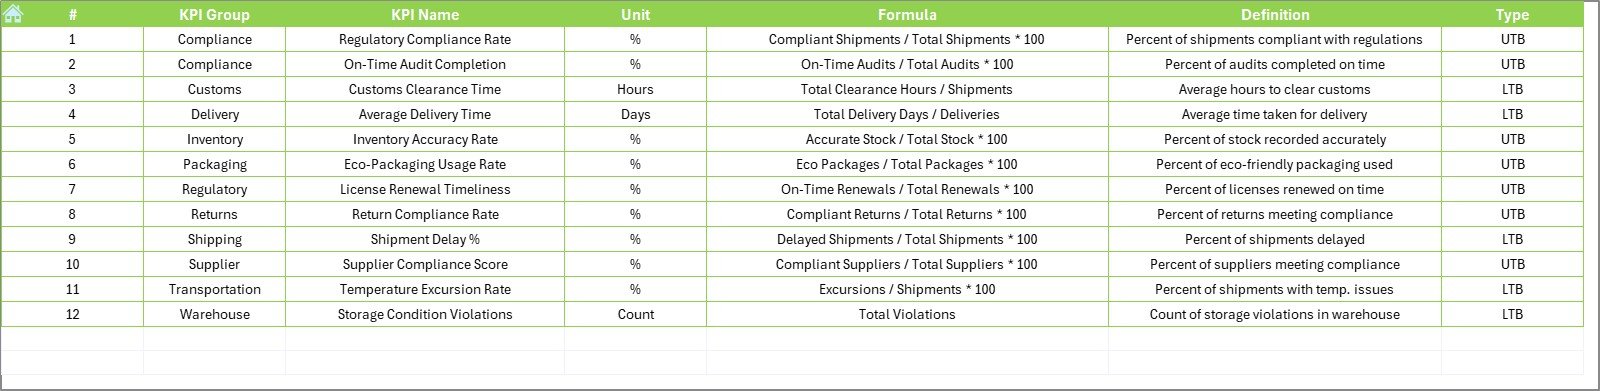
Organize your performance framework in the KPI Definition Sheet:
KPI Group, Name, Unit, Type (LTB/UTB)
Formula & business-friendly definitions
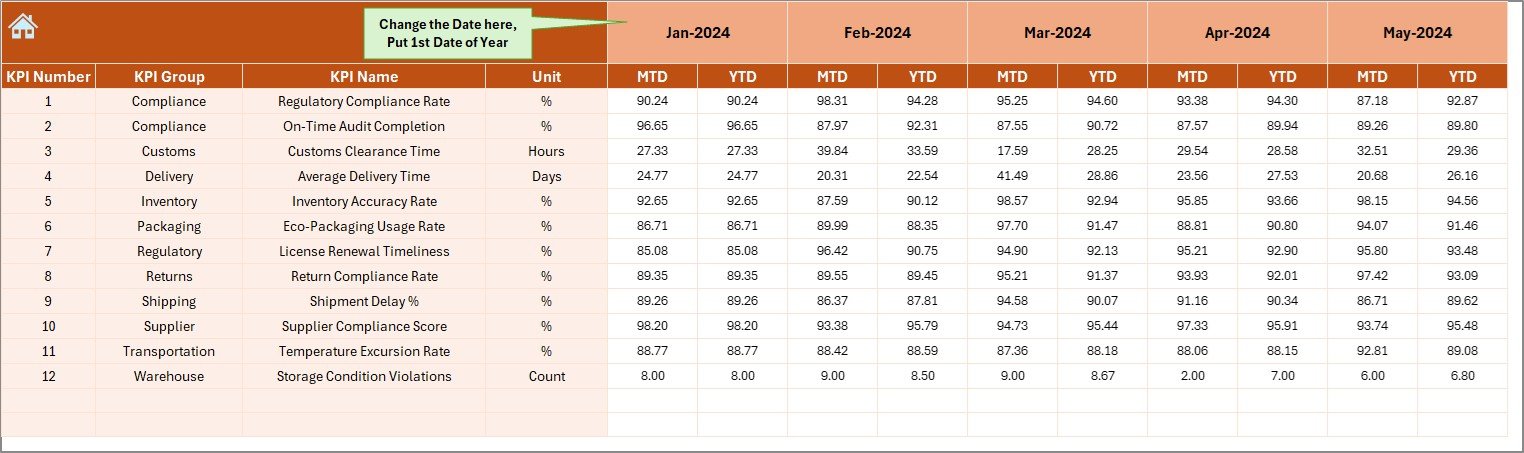
📥 Data Entry Made Simple
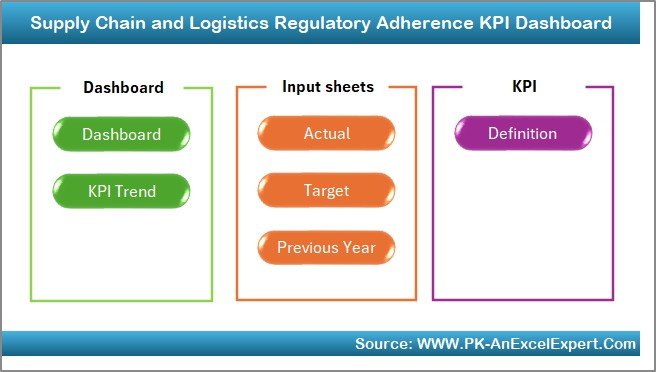
Separate sheets for:
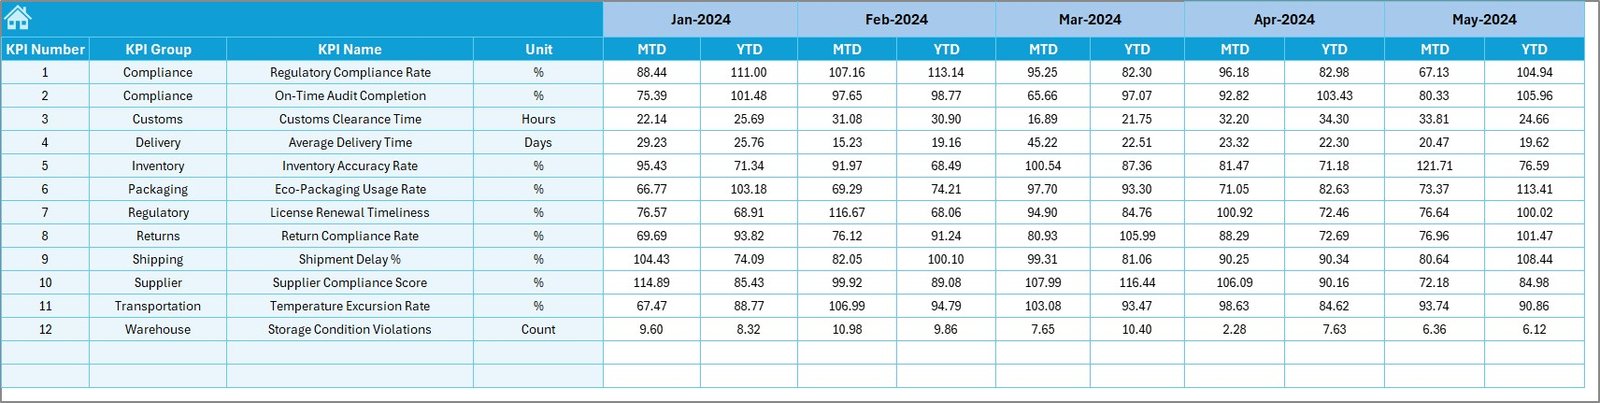
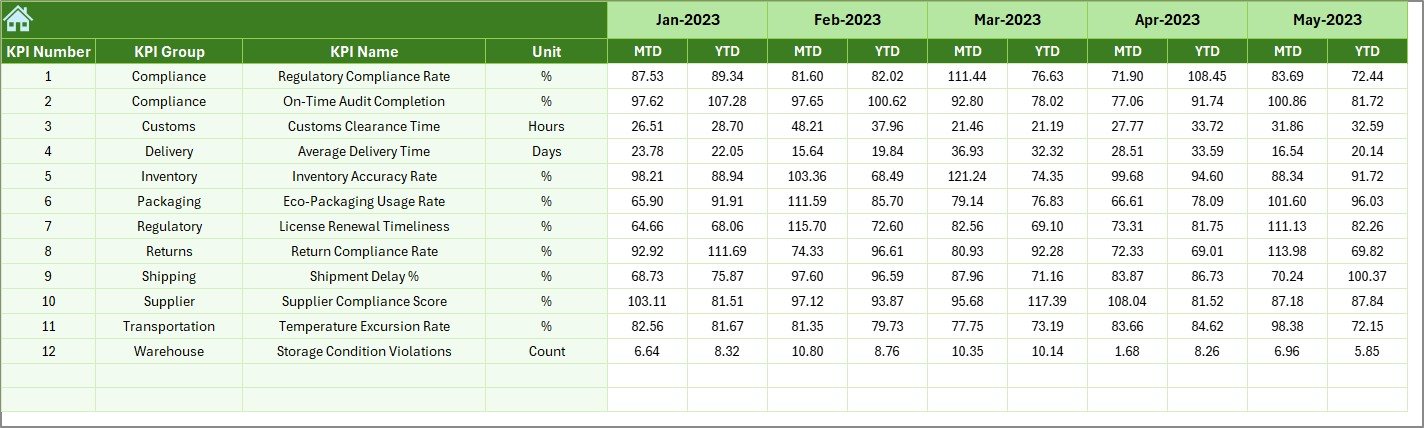
Actual Numbers (Current year performance)
Target Values (Goal setting)
Previous Year Numbers (Benchmarking)
Everything auto-feeds into the dashboard with zero coding needed!
🏠 Home Sheet Navigation
Access any sheet instantly using 6 built-in buttons from the Home Page. Navigate with confidence.
📦 What’s Inside the Dashboard Template?
Home Sheet – One-click access to all sections
Dashboard Sheet – Month-wise KPI performance view
KPI Trend Sheet – KPI-level analysis with chart comparisons
Actual Numbers Input Sheet – Input live performance data
Target Sheet – Set monthly compliance goals
Previous Year Sheet – Track historical data
KPI Definition Sheet – Maintain your KPI logic and formulas
Everything is fully integrated—just input your data and watch insights come to life.
🛠 How to Use the Regulatory Compliance Dashboard
Set Up KPI Definitions
Start in the KPI Definition Sheet to list all metrics, formulas, and measurement types.Input Historical Benchmarks
Use the Previous Year Numbers sheet to fill in last year’s data.Define Compliance Targets
Go to the Target Sheet and enter your MTD and YTD monthly goals.Update Current Metrics
Use the Actual Numbers Input Sheet to capture current data points.Analyze the Dashboard
Navigate to the Dashboard, choose a month, and instantly see performance status.Explore Trends
On the KPI Trend Sheet, view patterns and insights that drive real decisions.
👥 Who Can Benefit from This Excel Template?
✅ Supply Chain Managers – Monitor regulatory compliance across shipping, warehousing, and transport
✅ Logistics Analysts – Drill into customs, environmental, and safety KPIs
✅ Regulatory Officers – Ensure policies are met across vendors and borders
✅ Consultants & Auditors – Conduct performance reviews across clients and teams
✅ Warehouse/Transportation Teams – Stay proactive with real-time feedback
If your team’s success depends on operational compliance, this tool is built for you.
📘 Click here to read the Detaile
Watch the step-by-step video tutorial:
d blog post
🎥 Visit our YouTube channel to learn step-by-step video tutorials

















Reviews
There are no reviews yet.