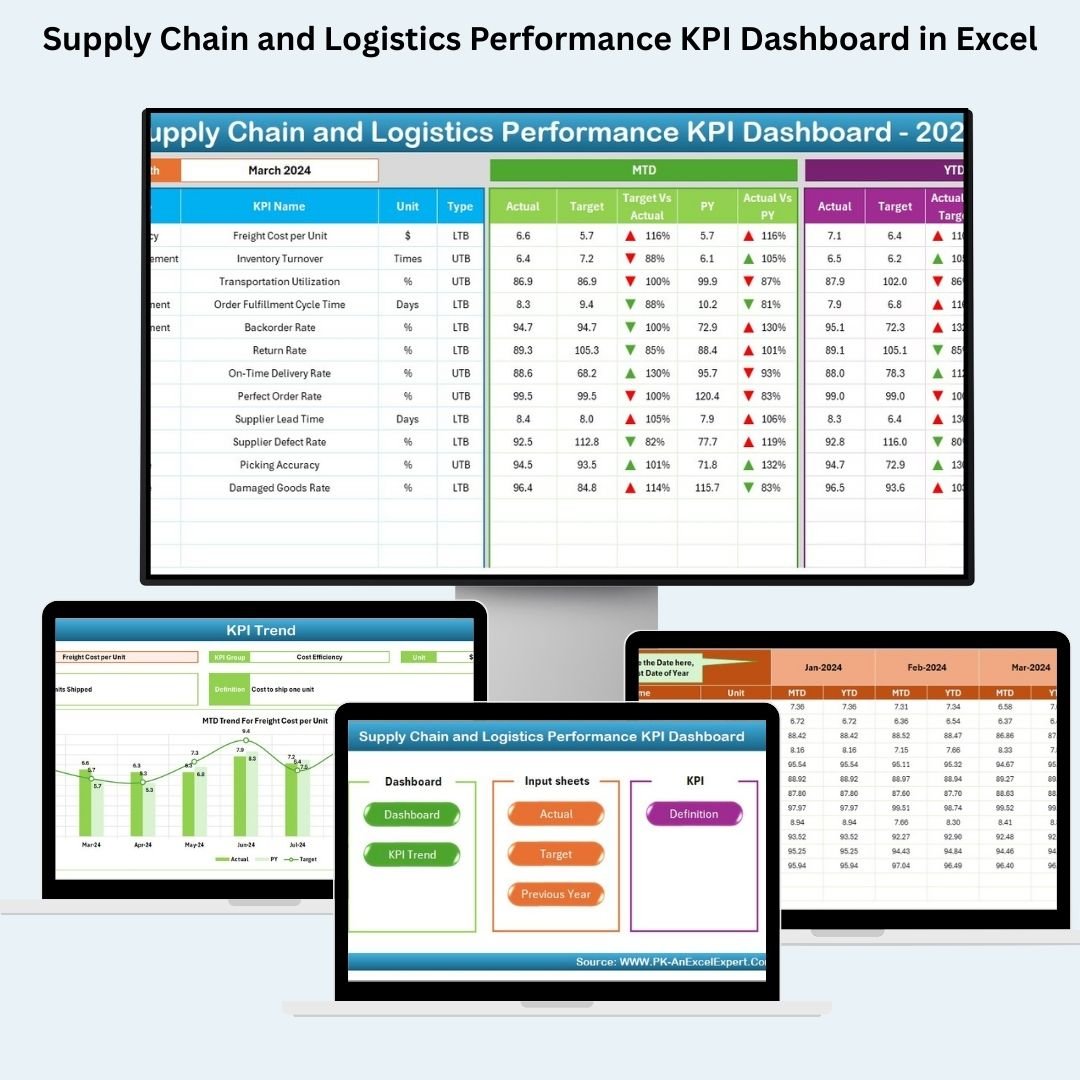
Managing supply chain operations across multiple teams and regions can get messy fast. Without a centralized view of key metrics, inefficiencies creep in. That’s why we created the Supply Chain and Logistics Performance KPI Dashboard in Excel — a powerful, ready-to-use tool to visualize KPIs, spot trends, and drive decisions with confidence.
Whether you’re a supply chain manager, logistics analyst, or operations leader, this dashboard gives you real-time insights into performance — from delivery efficiency to cost control — all in one Excel file.
✨ Key Features of the Supply Chain KPI Dashboard
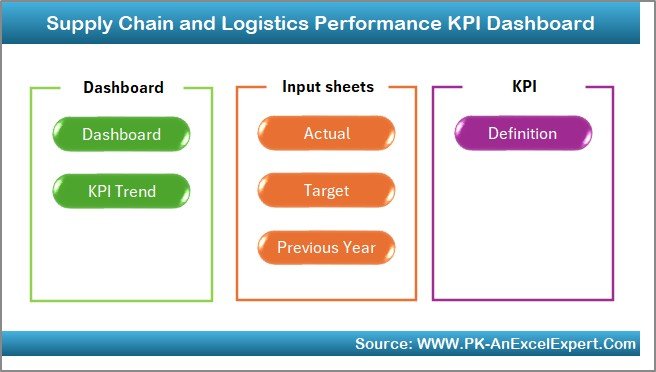
📊 7 Smartly Designed Worksheets
-
Home Sheet – Easy navigation with clickable buttons
-
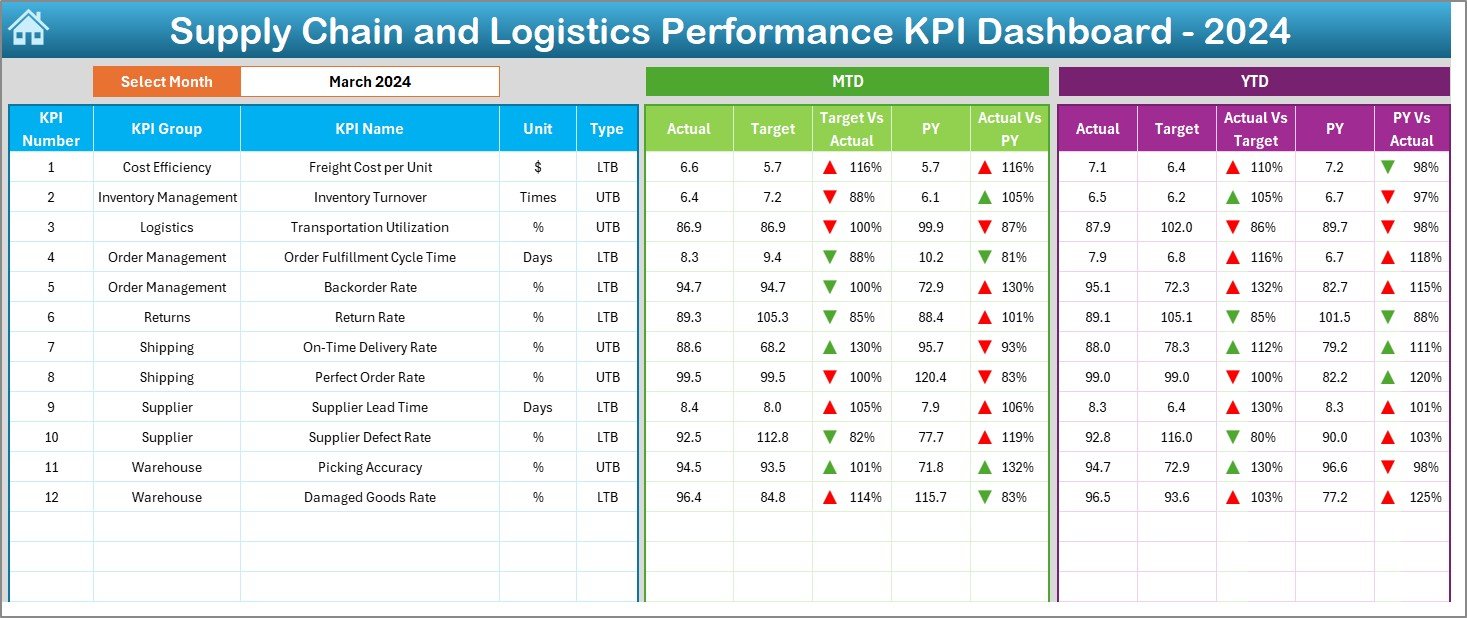
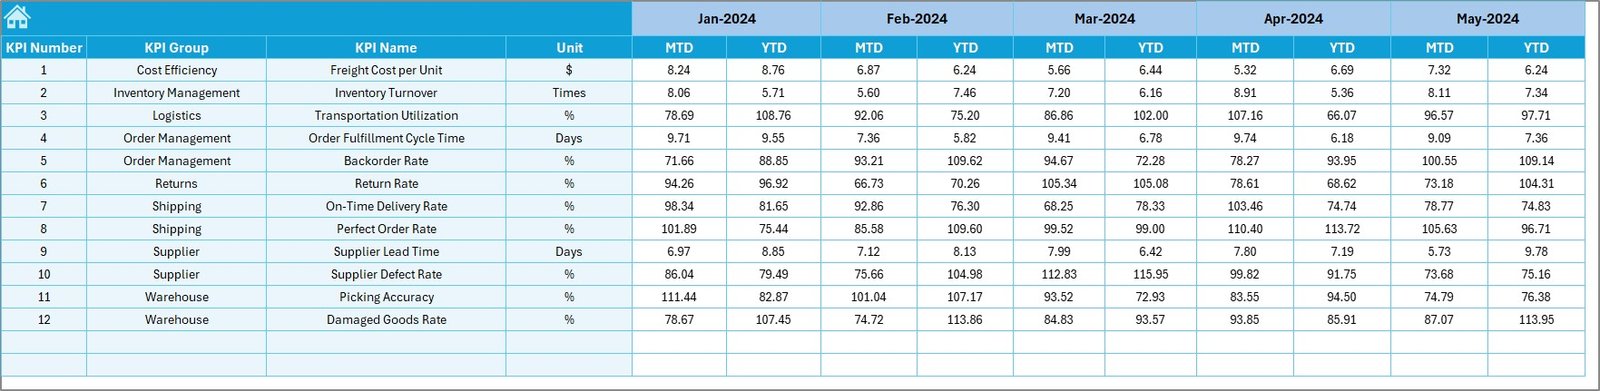
Dashboard Sheet – Month-based summary with trends and comparisons
-
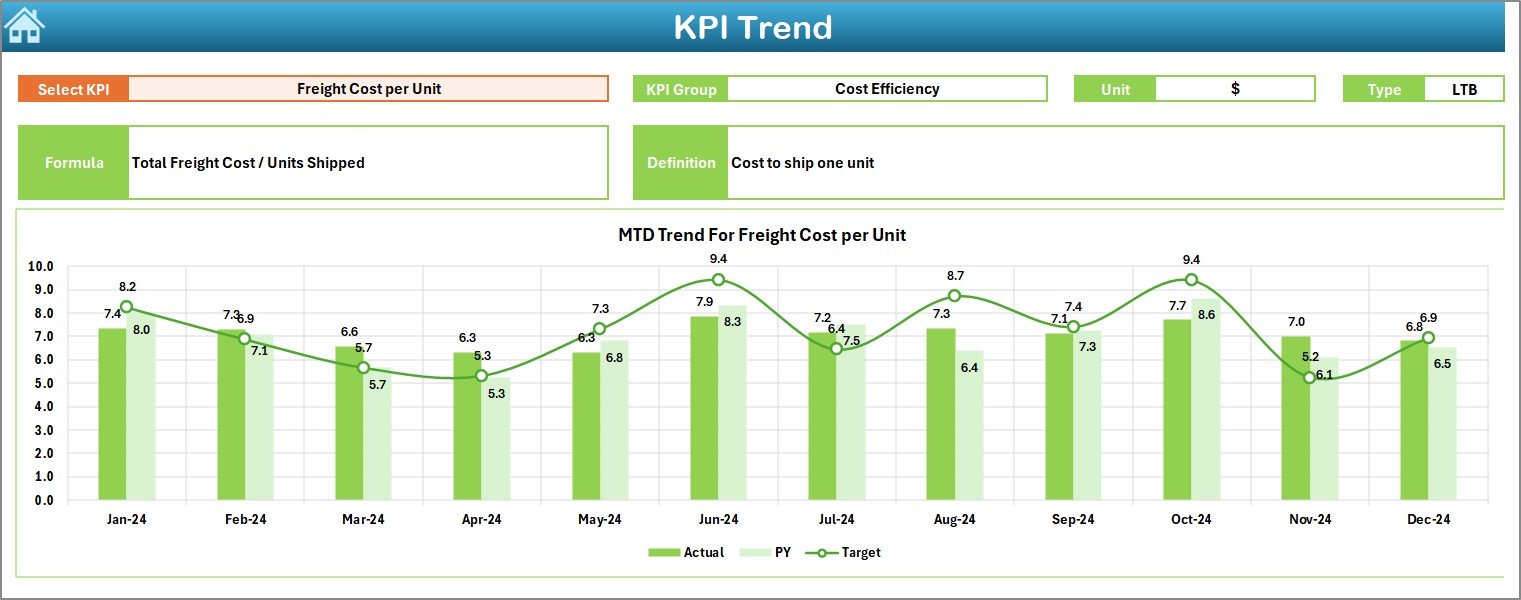
KPI Trend Sheet – Drill down into monthly and yearly performance
-
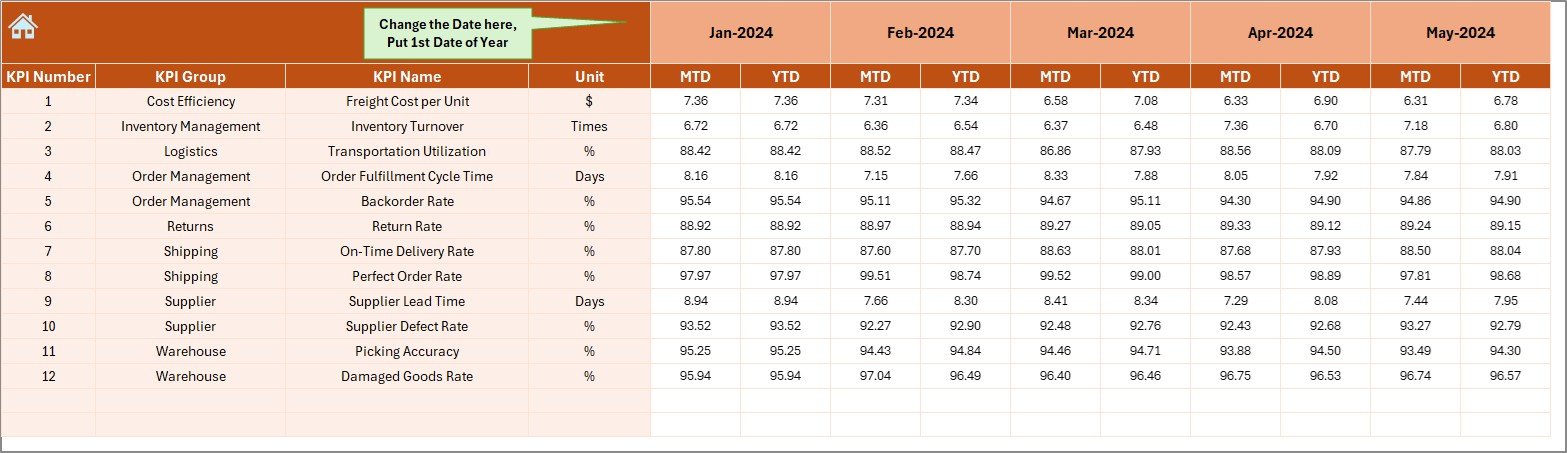
Actual Numbers Input Sheet – Enter monthly actuals with ease
-
Target Sheet – Set and monitor MTD/YTD performance goals
-
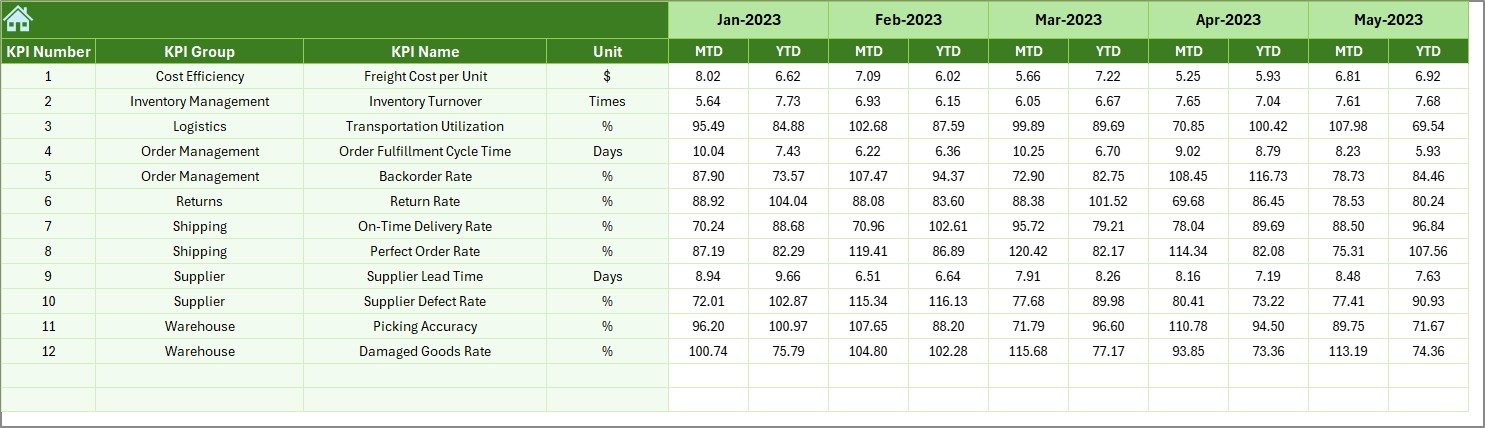
Previous Year Sheet – Track last year’s numbers for historical comparison
-
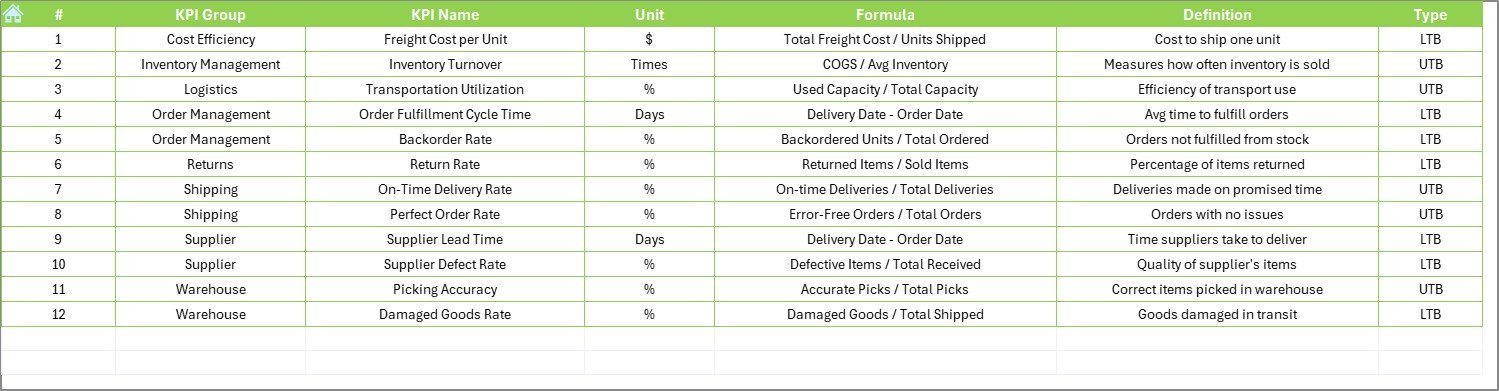
KPI Definition Sheet – Maintain formulas, units, and metric types
📆 MTD and YTD Views
-
Analyze Month-to-Date (MTD) vs Year-to-Date (YTD) progress
-
Compare Actual vs Target vs Previous Year
-
Track progress and gaps clearly using up/down trend arrows
📈 KPI Trend Visualization
-
Select any KPI from a dropdown
-
View MTD/YTD progress in line charts
-
Spot areas needing attention — fast!
🧠 User-Friendly Data Entry
-
No complex formulas required
-
Change fiscal start month in just one cell (E1)
-
All charts update automatically
📦 What’s Inside the Excel Dashboard?
🔹 Dynamic Dashboard Sheet – Performance snapshots for all KPIs
🔹 Drop-down Based Filters – Select the month to auto-update all visuals
🔹 Visual Performance Trends – Conditional formatting shows trends at a glance
🔹 Data Input Tabs – Simplify monthly data entry with a structured format
🔹 Definition Sheet – Keep all formulas, KPI types (UTB or LTB), and logic documented
🔹 All-in-One System – Actuals, targets, trends, and definitions in one workbook
🛠 How to Use the Dashboard
-
✅ Open the Excel file and go to the Actual Numbers Input sheet
-
📥 Enter monthly values for MTD and YTD for each KPI
-
🎯 Head to the Target Sheet and enter goal figures
-
🗂️ Load previous year’s performance in the Previous Year tab
-
📊 Navigate to the Dashboard to see insights update instantly
-
📈 Use the KPI Trend Sheet to analyze individual KPI movements
All visual elements auto-update — no manual refresh required.
👥 Who Should Use This Dashboard?
This Excel tool is perfect for:
🚚 Supply Chain Managers – Track delivery performance, costs, and delays
📦 Logistics Teams – Monitor transit time, order cycle time, and on-time delivery
📊 Operations Analysts – Identify inefficiencies and areas of cost-saving
🏢 Manufacturing, Retail, E-commerce & Distribution – Tailored for any industry
🧑💼 Executives – Use summary visuals for reporting and decision-making
🚀 Benefits of the KPI Dashboard
✅ Instant Overview – Access all performance data in one screen
✅ Customizable – Modify KPIs, formulas, visuals, and sheet layout
✅ Beginner Friendly – Drop-downs, auto-formulas, and clear instructions
✅ Printable & Presentable – Create reports for meetings in seconds
✅ No Extra Software Needed – 100% Excel-based, no subscriptions
✅ Accurate Tracking – View trends across actual, target, and past year
✅ Editable Fiscal Year Start – Align with your business calendar
💡 Best Practices for Using the Dashboard
🧾 Keep Definitions Clear – Use the KPI Definition Sheet to align your team
📅 Update Data Monthly – Enter fresh data every month for accuracy
📊 Use Trend Analysis – Focus on KPIs with declining performance
🎯 Highlight Top KPIs – Focus on metrics that impact cost, delivery, and customer service
👥 Train Your Team – Help your staff understand how to use the tool
🔁 Click here to read the Detailed blog post
📺 Visit our YouTube channel to learn step-by-step video tutorials


Reviews
There are no reviews yet.