


Planning and executing a virtual event is only half the battle—the real challenge lies in understanding what worked and what didn’t. That’s exactly where the Virtual Events KPI Dashboard in Power BI comes in. Whether you’re tracking registrations, engagement, or content effectiveness, this powerful analytics tool gives you real-time visibility into every critical metric—all in one visually intuitive platform.
With just a connected Excel file, this dashboard becomes your event performance command center, helping you measure success, identify gaps, and make smarter decisions faster.
✨ Key Features of the Virtual Events KPI Dashboard
📌 Summary Page – The Performance Command Center

This is your main dashboard, showing an at-a-glance summary of all key metrics using:
-
🎯 KPI Cards for Total KPIs, MTD Target Met, and Target Missed
-
📅 Slicers to filter by Month and KPI Group
-
📈 High-impact visuals for instant trend recognition
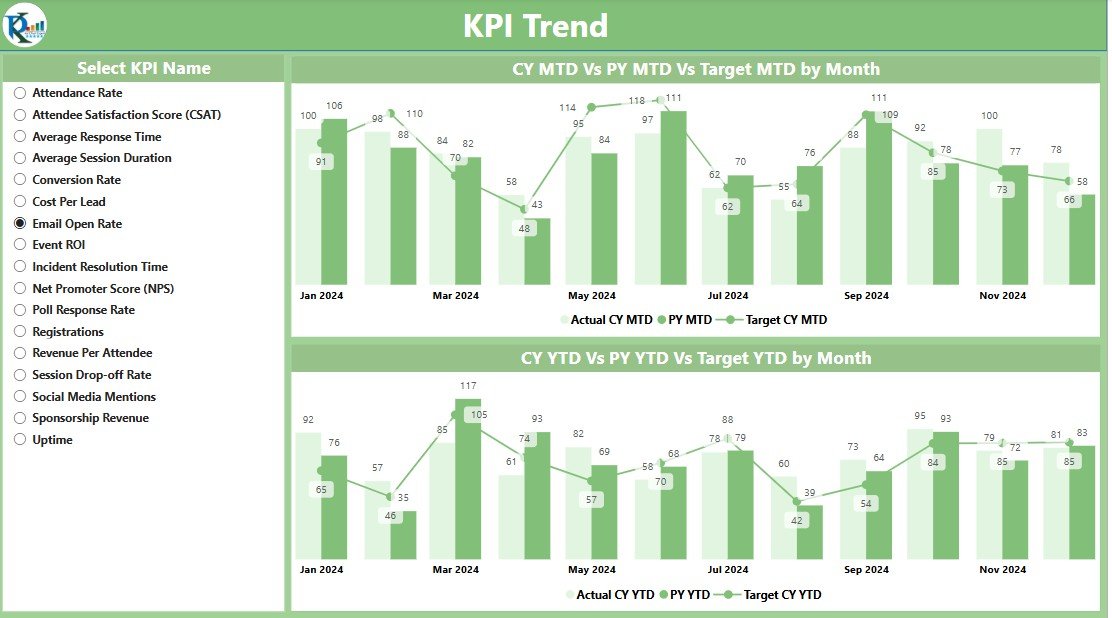
📈 KPI Trend Page – See the Bigger Picture
Want to know how your KPIs are evolving over time? This page includes:
-
A slicer to pick any KPI for analysis
-
Combo charts showing:
-
Current Year Actual vs Target
-
Previous Year Actual
-
MTD and YTD values, side by side
-
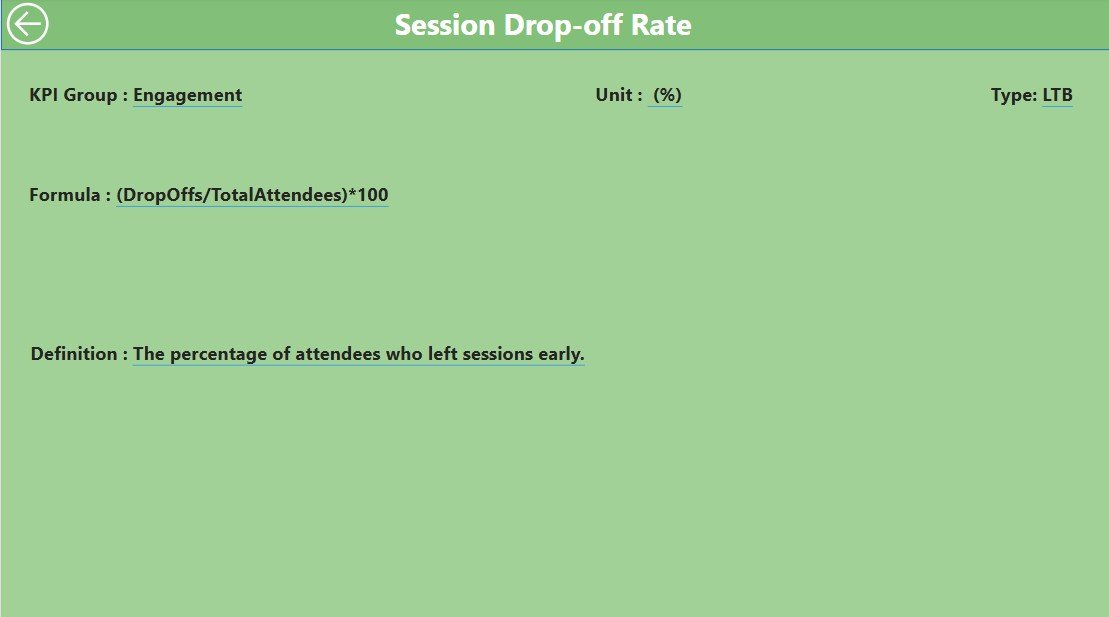
🔍 KPI Definition Page – Your Metric Encyclopedia
Dive deeper into your KPIs by drilling through from the Summary page. You’ll see:
-
Definitions
-
KPI Formulas
-
Type indicators (LTB = Lower the Better, UTB = Upper the Better)
Everything is clearly defined so your team always speaks the same data language.
📦 What’s Inside the Dashboard Package
-
✅ Three Power BI Pages: Summary, KPI Trend, KPI Definition
-
📊 Interactive Filters and Visual Cards
-
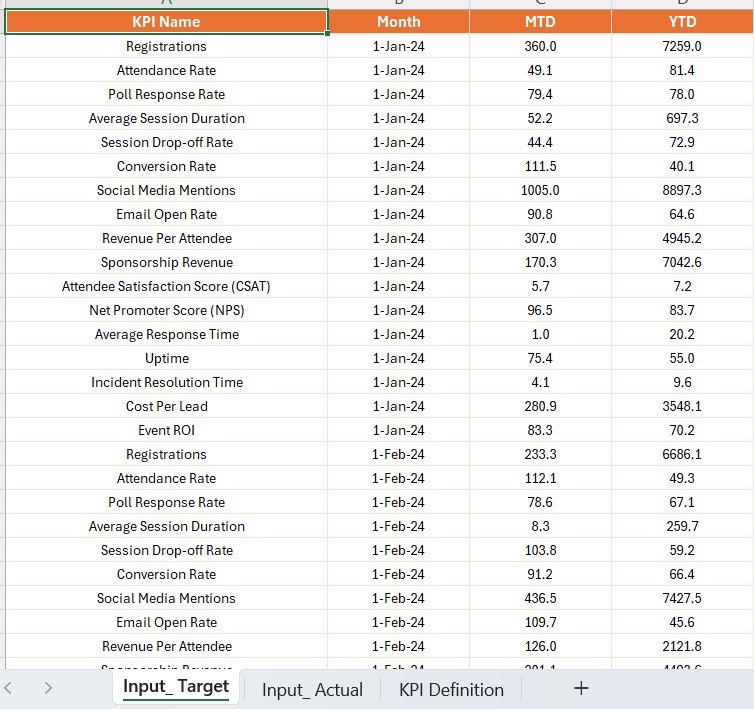
🔄 Excel Data Source with 3 key sheets:
-
Input_Actual: MTD & YTD actuals -
Input_Target: MTD & YTD targets -
KPI Definition: KPI metadata, formulas, and types
-
-
🔁 Auto-updating visuals based on refreshed Excel data
🧠 How to Use the Product
-
🖥 Open Power BI Desktop and load the dashboard
-
📥 Connect the Excel file and update with your event data
-
📊 Use slicers to explore performance by month or KPI group
-
📈 Analyze trends using combo charts on the KPI Trend page
-
🔍 Drill-through to see formula and type for each KPI
-
♻️ Refresh data anytime for real-time updates
No coding needed—just plug in your data and get insights!
👥 Who Can Benefit from This Dashboard?
-
🎙 Event Planners – Track registration and attendance goals
-
📢 Marketing Teams – Monitor engagement and lead conversion
-
📈 Data Analysts – Discover trends and gaps across event KPIs
-
🧑💼 CMOs & Stakeholders – View high-level performance metrics
-
🏢 Agencies & Consultants – Deliver client-ready event reports fast
🔗 Click here to read the Detailed blog post
📺 Visit our YouTube channel to learn step-by-step video tutorials


Reviews
There are no reviews yet.