


In a high-stakes, customer-driven world, your supply chain can’t afford delays, inaccuracies, or blind spots. That’s where the Supply Chain and Logistics Quality Assurance KPI Dashboard in Excel steps in — an interactive, visual, and easy-to-use Excel tool that empowers you to monitor key performance indicators, uncover inefficiencies, and make smarter decisions with real-time data.
Built specifically for quality assurance within logistics and supply chain management, this Excel dashboard provides an all-in-one view of MTD, YTD, and YoY performance across the KPIs that matter most.
✨ Key Features of the Dashboard
🏠 Home Sheet – One-Click Navigation Hub
Navigate between dashboard sections easily with six clickable buttons. No scrolling. Just click and go.
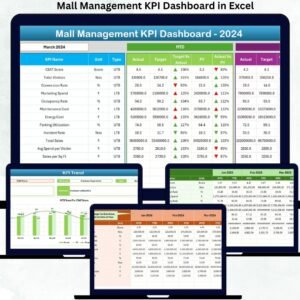
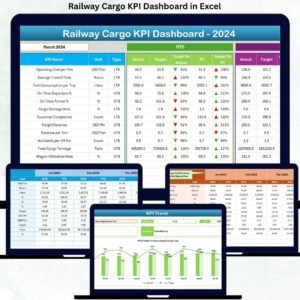
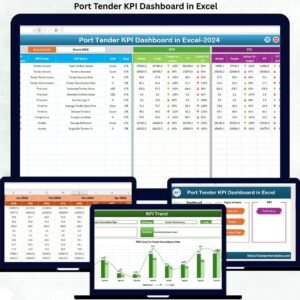
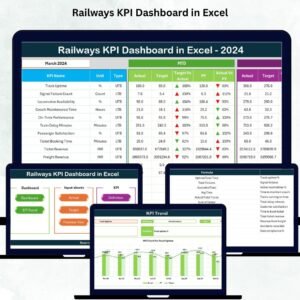
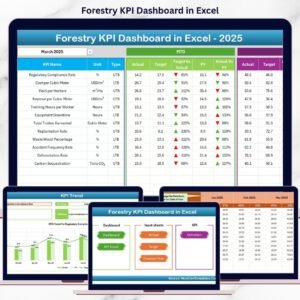
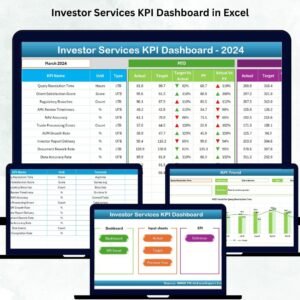
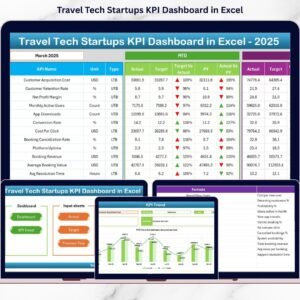
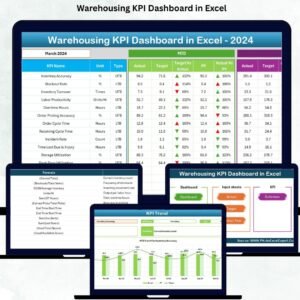
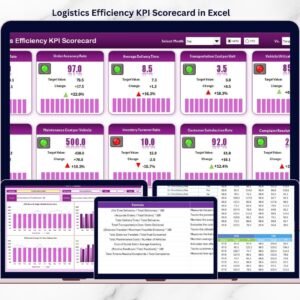
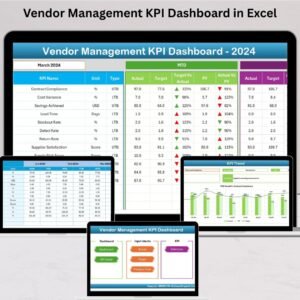
📊 Dashboard Sheet – Monthly Performance Snapshot

-
🔽 Drop-down Month Selector – Choose any month and the entire dashboard refreshes instantly
-
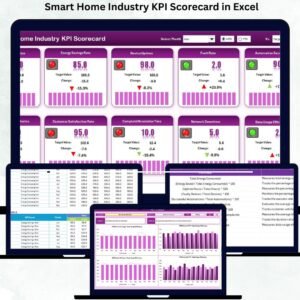
📈 KPI Cards for MTD & YTD – Track actual, target, and previous year values
-
⬆️⬇️ Arrows for Trend Analysis – Visual alerts using conditional formatting for under/overperformance
-
💡 Instantly spot delays, dips, or red flags
📉 KPI Trend Sheet – Month-by-Month Tracking
-
📋 Select any KPI using a drop-down
-
🧠 View key metadata (Unit, Group, Formula, LTB/UTB)
-
📈 Line charts for MTD & YTD trends across Actual, Target, and Previous Year
🧾 Actual Numbers Input Sheet – Simple Data Entry
-
📅 Set the first month in cell E1
-
✏️ Enter MTD & YTD actuals for all KPIs
-
🔄 Dashboard auto-updates — no manual linking needed
🎯 Target Sheet – Define Your Success Metrics
-
Input monthly MTD and YTD targets
-
Set expectations and benchmarks for every KPI
📆 Previous Year Sheet – YoY Performance Comparisons
-
Record previous year MTD & YTD values
-
Evaluate growth, decline, or stagnation
📚 KPI Definition Sheet – Team-Wide Clarity
-
KPI Name, Group, Formula, Unit
-
LTB/UTB Type explained for context
-
Ideal for onboarding and strategy alignment
🧠 Why This Dashboard Matters
Tracking KPIs like On-Time Delivery, Order Accuracy, and Supplier Defect Rate isn’t optional — it’s vital for:
-
Reducing costs
-
Preventing delays
-
Improving service quality
-
Meeting regulatory and customer expectations
By centralizing all your supply chain quality data into one automated system, you unlock proactive decision-making and strategic visibility.
🚀 Advantages of Using the Dashboard
🔎 Complete KPI Visibility – See performance at a glance
📈 Trend-Based Insights – Spot growth, seasonal patterns, or recurring bottlenecks
✅ Accurate Targeting – Set and measure progress toward strategic goals
📊 Actionable Visuals – Arrows and color cues draw attention instantly
⚙️ Fully Customizable – Modify KPI lists, formulas, visuals, or themes
🧾 Data-Driven Culture – Share performance across teams to align goals
🕒 Save Time Weekly – No need to rebuild reports from scratch
💰 No Subscription – One-time Excel template, reusable forever
👤 Who Should Use This Dashboard?
Ideal for professionals in:
🏭 Manufacturing & Production
🚚 Logistics & Distribution
🏬 Retail Supply Chains
📦 E-commerce Fulfillment
🏥 Healthcare Supply Operations
🔧 Automotive Supply Chains
If your work touches inventory, warehousing, delivery, or procurement — this dashboard is your new best friend.
🔧 Real-World Use Case
Let’s say you’re noticing late deliveries and unhappy customers. You open the dashboard and see that your Order Cycle Time has increased over the past 3 months. In the KPI Trend Sheet, you spot a dip in On-Time Delivery, aligning with a change in your primary supplier.
You use this insight to renegotiate delivery timelines — or find a better supplier. Result: improved delivery, reduced complaints, and optimized cost.
🧩 Best Practices for Dashboard Use
✔️ Update Monthly or Weekly – Fresh data = relevant insights
✔️ Use Conditional Formatting – Let color cues flag risks
✔️ Review as a Team – Discuss the dashboard in monthly meetings
✔️ Adjust Targets Annually – Reflect business priorities each year
✔️ Use Definitions Tab – Onboard teams faster and align expectations
🔁 Click here to read the Detailed blog post
📺 Visit our YouTube channel to learn step-by-step video tutorials


Reviews
There are no reviews yet.