



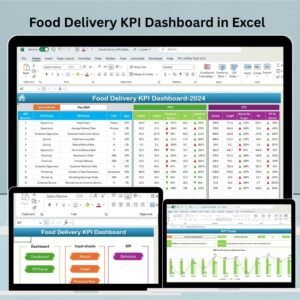
The Food Delivery KPI Dashboard in Excel is a powerful tool designed to help food delivery services, restaurants, and logistics teams track and optimize their key performance indicators (KPIs). This Excel-based dashboard provides comprehensive insights into critical aspects of food delivery operations, including delivery times, order accuracy, customer satisfaction, and delivery volume, allowing you to make data-driven decisions to improve operational efficiency and enhance customer service.
By using this dashboard, food delivery businesses can monitor their performance in real time, identify bottlenecks, and make necessary adjustments to improve delivery times, reduce errors, and maximize customer satisfaction. Whether you’re managing a small local delivery service or a large-scale food delivery operation, this dashboard is customizable and scalable to fit your needs.
Key Features of the Food Delivery KPI Dashboard in Excel
🚚 Delivery Time Tracking
Track delivery times for each order and identify any delays or inefficiencies in the delivery process. Monitor the average time it takes to deliver food from the restaurant to the customer’s location.
📊 Order Accuracy Monitoring
Track order accuracy to ensure that customers receive their food exactly as ordered. Reduce errors and improve customer satisfaction by identifying patterns in order mistakes and addressing them promptly.
📈 Customer Satisfaction Metrics
Measure customer satisfaction through feedback and reviews. Monitor key metrics like customer ratings, complaints, and overall feedback to improve the customer experience.
📅 Delivery Volume & Capacity Monitoring
Track the volume of orders and the number of deliveries over time. This feature allows you to identify peak delivery times, optimize driver routes, and allocate resources efficiently.
⚙️ Customizable KPIs
Customize the dashboard to include KPIs that are most relevant to your food delivery operation. Whether you’re focusing on delivery speed, order volume, or customer satisfaction, the dashboard can be tailored to your business needs.
📉 Time-Based Performance Tracking
Monitor KPIs over different time periods (daily, weekly, monthly) to identify trends and make proactive adjustments. This time-based analysis helps you spot performance patterns and improve long-term efficiency.
Why You’ll Love the Food Delivery KPI Dashboard in Excel

✅ Comprehensive Insights at a Glance
Track all critical food delivery performance metrics in one place, including delivery times, accuracy, customer feedback, and delivery volume.
✅ Optimize Delivery Efficiency
Monitor delivery times and identify areas for improvement. Use data insights to reduce delays, optimize routes, and enhance the overall delivery process.
✅ Enhance Customer Satisfaction
Track customer ratings and feedback to ensure high service quality. Address complaints and improve the delivery experience based on real-time insights.
✅ Data-Driven Decision Making
Use the data to make informed decisions about resource allocation, route optimization, and process improvements. Drive operational improvements across your food delivery business.
✅ Customizable & Scalable
Tailor the dashboard to fit your unique business needs. It’s customizable and scalable, making it suitable for small local businesses or large-scale delivery operations.
What’s Inside the Food Delivery KPI Dashboard in Excel?
Delivery Time Tracking: Monitor delivery times to ensure timely service.
Order Accuracy Monitoring: Track and minimize order mistakes to enhance customer satisfaction.
Customer Satisfaction Metrics: Measure and analyze customer feedback to improve the service.
Delivery Volume & Capacity Tracking: Monitor the number of orders and deliveries over time.
Customizable KPIs: Adapt the dashboard to your specific delivery business needs.
Time-Based Analysis: Monitor performance over different time periods for trend analysis.
How to Use the Food Delivery KPI Dashboard in Excel
1️⃣ Download the Template: Access the Food Delivery KPI Dashboard in Excel instantly.
2️⃣ Integrate Your Data Sources: Input your delivery data, including order times, delivery times, customer feedback, and more.
3️⃣ Monitor KPIs & Performance: Track key metrics like delivery time, order accuracy, and customer satisfaction.
4️⃣ Analyze Trends & Insights: Use time-based analysis to identify trends and optimize performance.
5️⃣ Optimize Operations: Use the insights from the dashboard to make data-driven decisions and improve the efficiency of your food delivery service.
Who Can Benefit from the Food Delivery KPI Dashboard in Excel?
🔹 Food Delivery Services
🔹 Restaurants with Delivery Operations
🔹 Logistics and Distribution Companies
🔹 E-commerce Food Platforms
🔹 Delivery Fleet Managers
🔹 Customer Service Teams
🔹 Small & Medium Enterprises (SMBs) in the Food Industry
🔹 Large Food Delivery Operations and Chains
Streamline your food delivery service and ensure customer satisfaction with the Food Delivery KPI Dashboard in Excel. Track delivery times, accuracy, customer feedback, and more to optimize your food delivery process and improve your bottom line.
Click here to read the Detailed blog post
Visit our YouTube channel to learn step-by-step video tutorials
Youtube.com/@PKAnExcelExpert
Compatibility and Requirements
- Works in Microsoft Excel desktop (Excel 2016 or later, or Microsoft 365).
- New to Excel dashboards? Microsoft’s guide Create a chart from start to finish covers the basics.
Frequently Asked Questions
Which KPIs does the dashboard track?
Delivery times, order accuracy, customer satisfaction (ratings, feedback and complaints) and order volume.
Can I view results by day, week or month?
Yes. You can monitor KPIs daily, weekly or monthly to spot trends.
Can it show my busiest periods?
Yes. The delivery volume section tracks orders and deliveries over time, which helps you see peak demand.
Can I add my own KPIs?
Yes. You can customize the KPIs to fit your delivery operation.
Is it available in Google Sheets or Power BI?
Yes. See the Food Delivery KPI Dashboard in Google Sheets and the Food Delivery KPI Dashboard in Power BI.
Related Food Delivery Templates
- Food Delivery KPI Dashboard in Google Sheets: the same KPIs in Google Sheets
- Food Delivery KPI Dashboard in Power BI: the Power BI edition
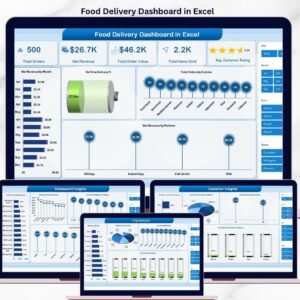
- Food Delivery Dashboard in Excel: a full food delivery dashboard in Excel
- Food Delivery Log Data Entry System in Excel: log each delivery in Excel
- Restaurants & Food Services KPI Dashboard in Excel: KPIs for restaurants and food services
Browse all Excel KPI dashboards.





























Reviews
There are no reviews yet.