

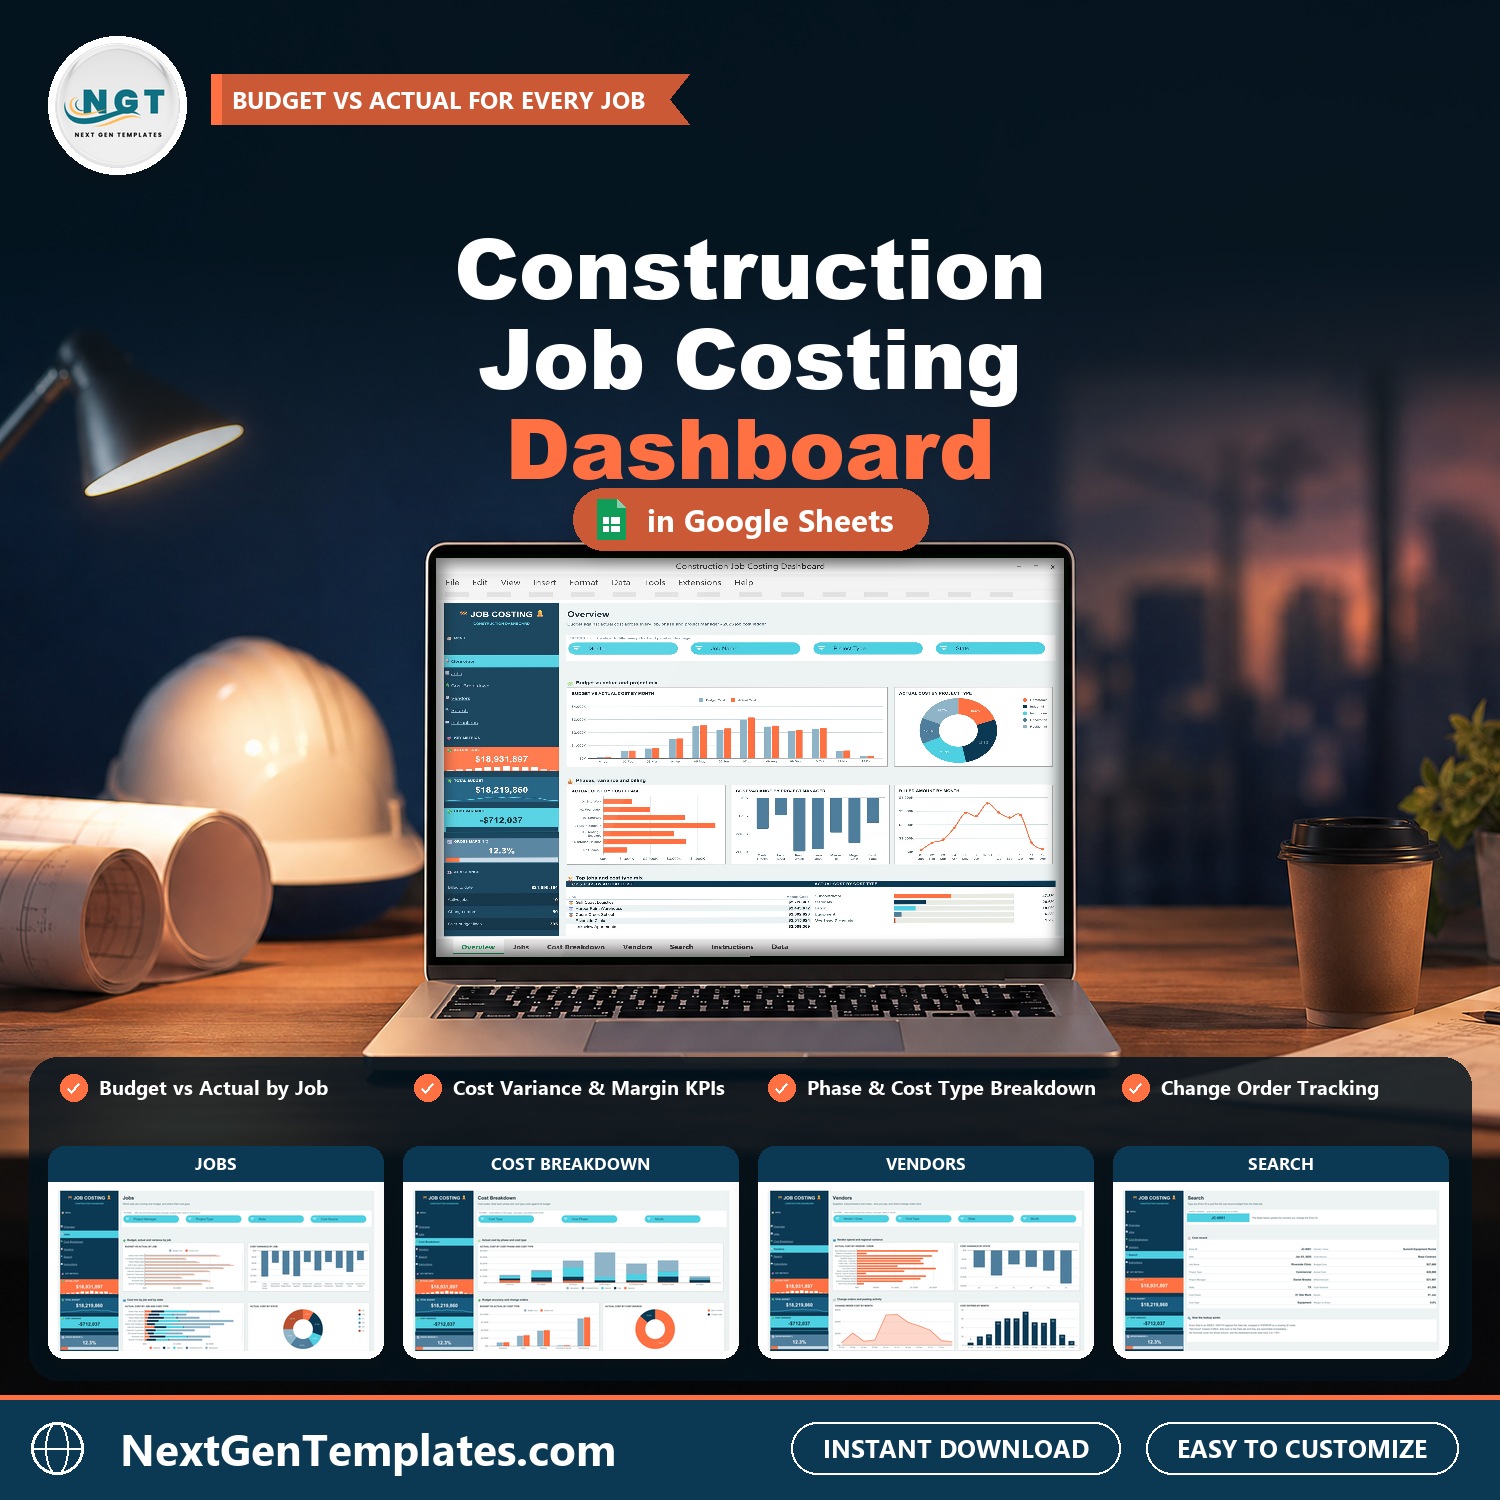

Most contractors find out a job ran over budget after it is finished. The Construction Job Costing Dashboard in Google Sheets is a construction cost dashboard that puts budget, actual cost, billed amount and margin for every job on one screen, then breaks them down by phase, cost type, vendor, project manager and state, so overruns show up while there is still time to act.
🌍 Join 10,000+ customers in 180+ countries using NextGenTemplates to replace paid SaaS tools with one-time-purchase Excel, Google Sheets, Power BI and HTML templates.
✅ Instant download · One-time payment · No subscription · No per-user fees · Lifetime access
Watch the Construction Job Costing Dashboard in Google Sheets walkthrough
Good to know: this is a reporting dashboard, not construction accounting or estimating software. You type or paste cost entries into the Data tab. All sample jobs, vendors and figures are fictional.
🔑 Key Features of the Construction Job Costing Dashboard
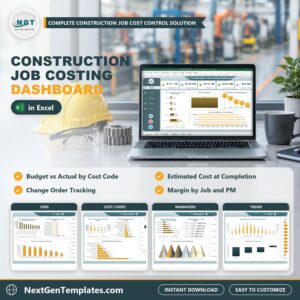
📌 A job costing dashboard in Google Sheets. This job costing template for construction shows budget vs actual cost for every job, with cost variance and gross margin on every page.
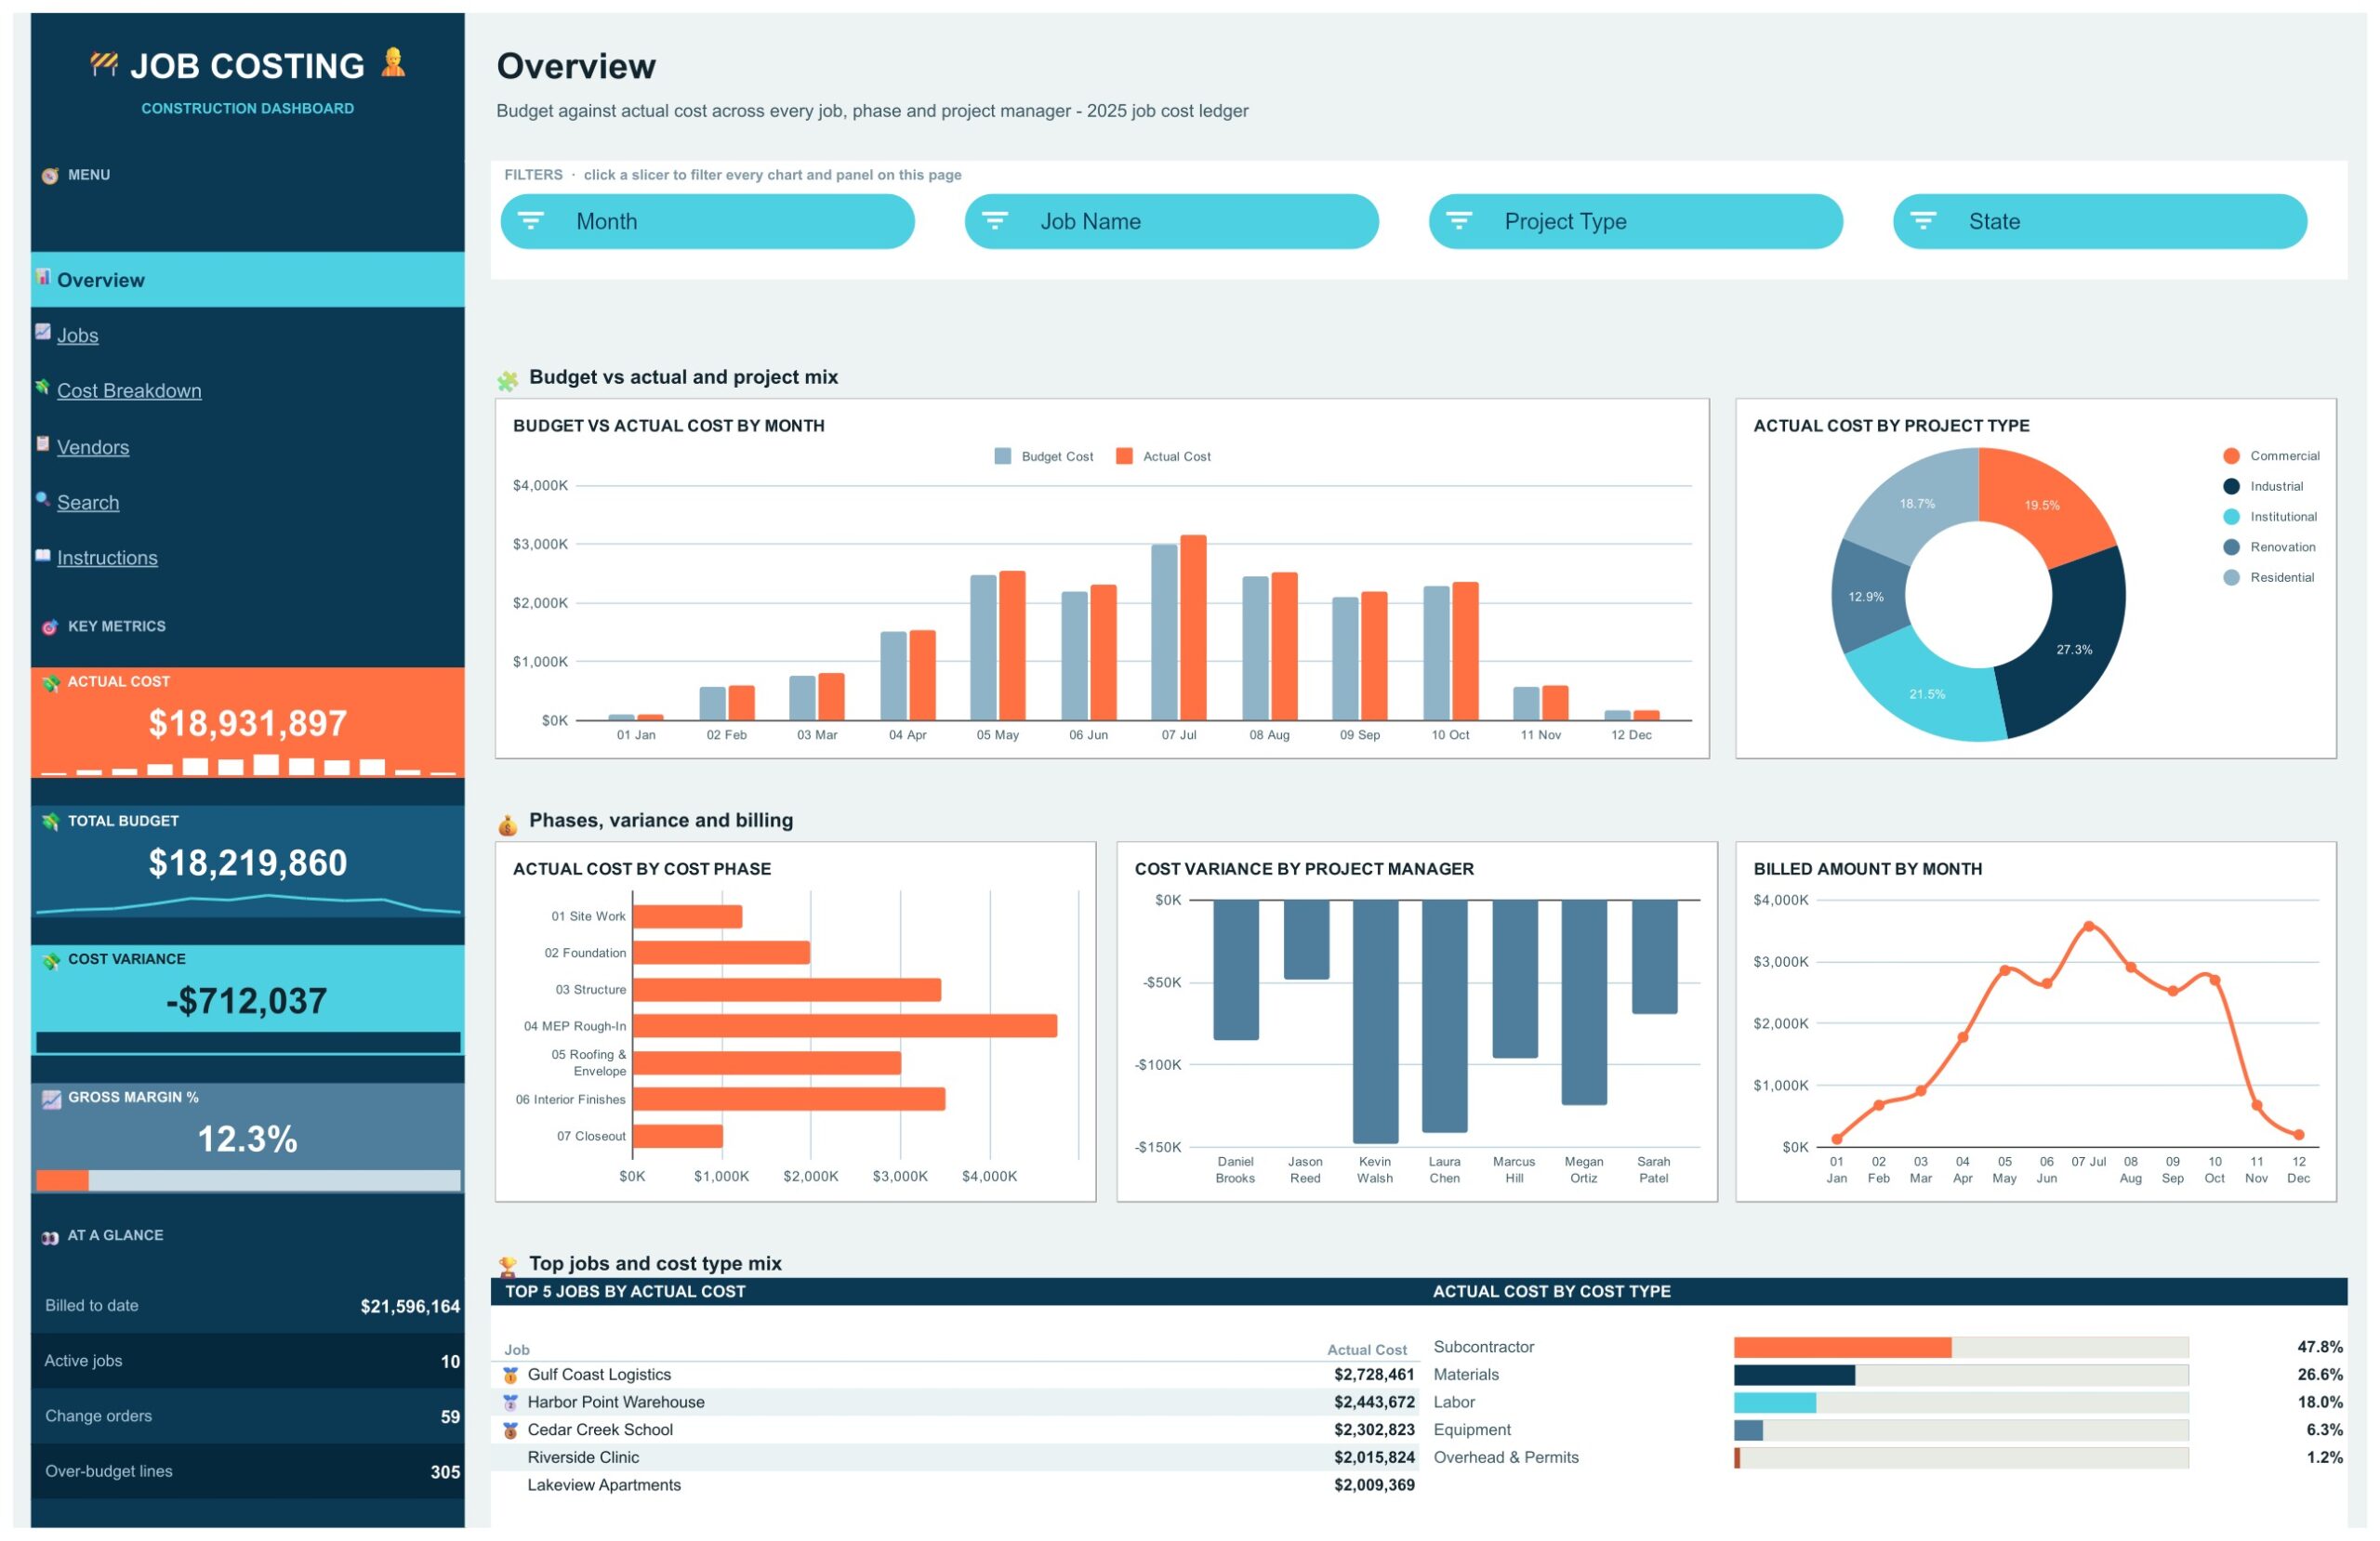
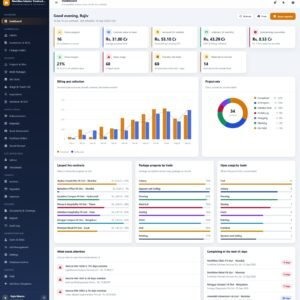
📌 Four KPI cards that never leave the screen. Actual Cost, Total Budget, Cost Variance and Gross Margin % sit in a side rail, with At a Glance counts for billed to date, active jobs, change orders and over-budget lines.
📌 Native slicers. Month, Job Name, Project Type, State, Project Manager, Cost Source, Cost Type, Cost Phase and Vendor / Crew filter the charts and Top 5 panels on their pages with one click.
📌 Phase and cost type breakdown. See actual cost by phase from Site Work to Closeout, and by Labor, Materials, Equipment, Subcontractor and Overhead and Permits.
📌 Change order tracking. Cost Source separates base contract cost from change orders, and a chart shows change order cost by month.
📌 Vendor and crew spend. A vendors page ranks suppliers, subcontractors and crews by actual cost.
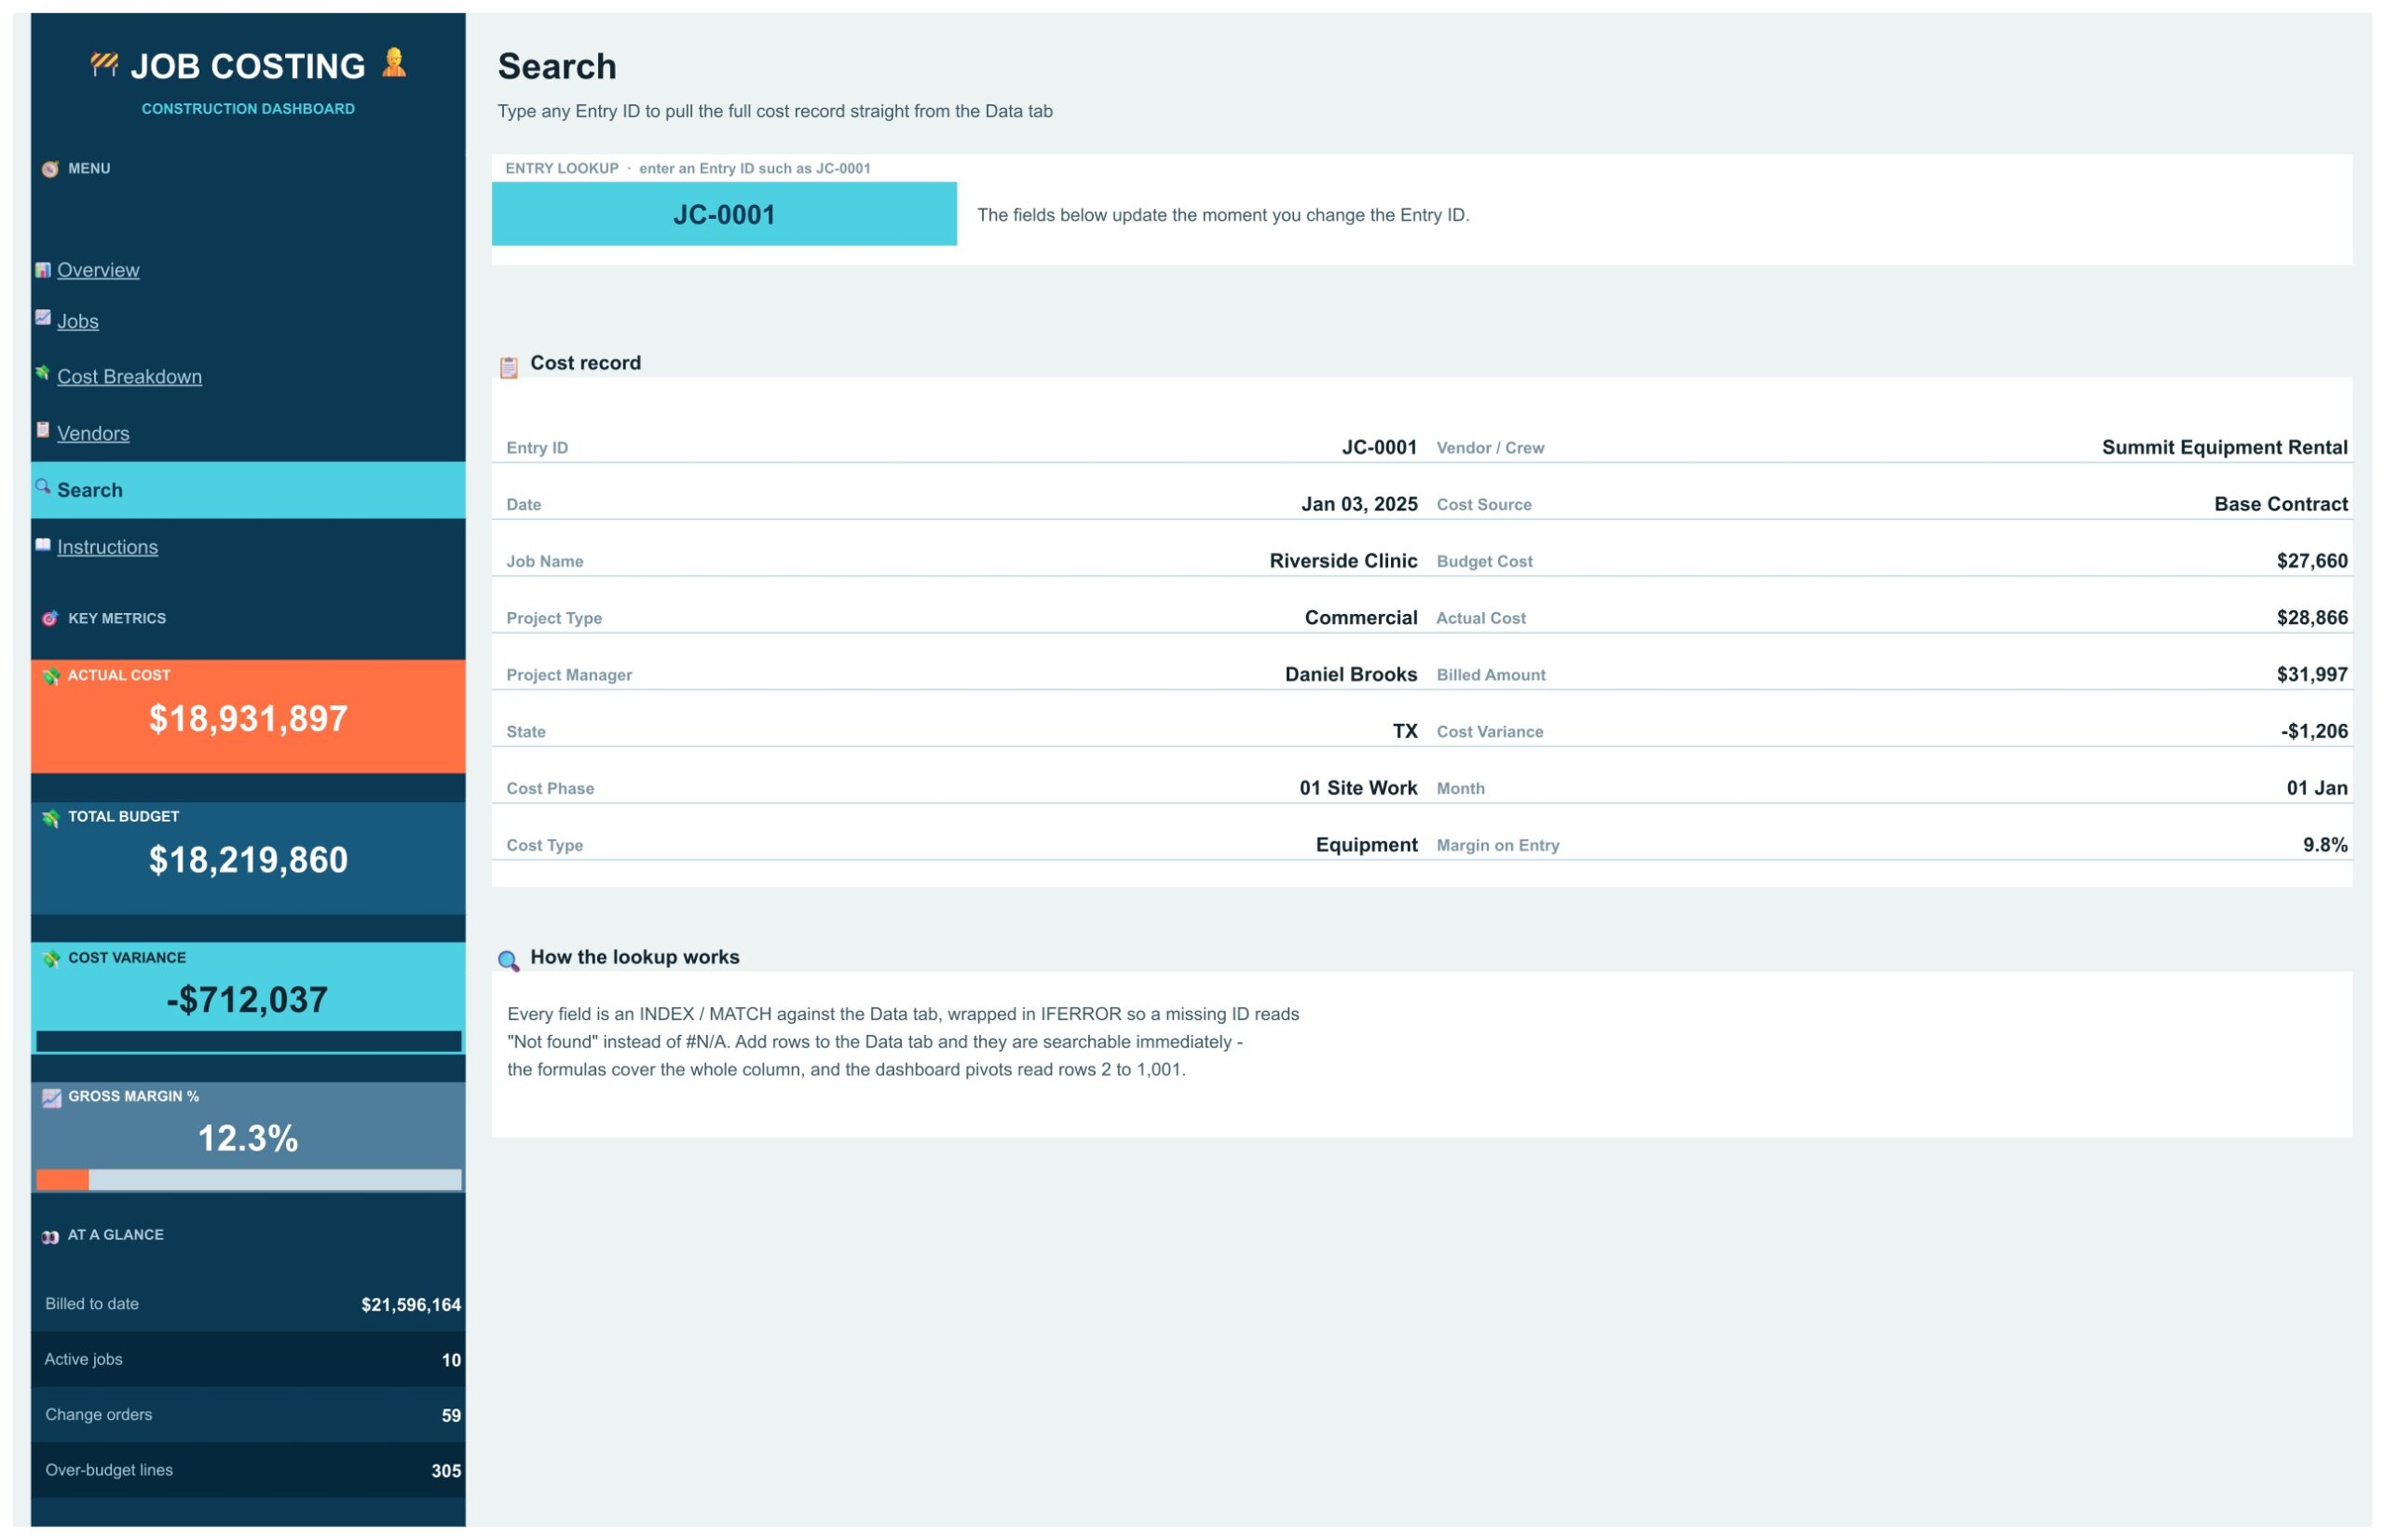
📌 Record-level Search page. Type any Entry ID such as JC-0001 and the full cost record appears.
📌 No add-ons. Built with formulas, pivot tables and native slicers. No add-on, no script, no macro.
📌 Room for 1,000 cost entries. Paste your own entries over the sample rows and the pages update on their own.
📦 What is Inside the Construction Job Costing Dashboard
Four dashboard pages (Overview, Jobs, Cost Breakdown, Vendors), a Search page, an Instructions page and a Data tab. Your download is a PDF guide with the link to open the dashboard and make your own editable copy.
Overview Page
The Overview page leads with the figures a contractor checks first: Actual Cost, Total Budget, Cost Variance and Gross Margin % sit in a side rail that stays in view on every page. Charts show Budget vs Actual Cost by Month, Actual Cost by Project Type, Actual Cost by Cost Phase, Cost Variance by Project Manager and Billed Amount by Month. A Top 5 Jobs by Actual Cost panel and an Actual Cost by Cost Type breakdown finish the page. Month, Job Name, Project Type and State slicers filter everything on it.
Jobs Page
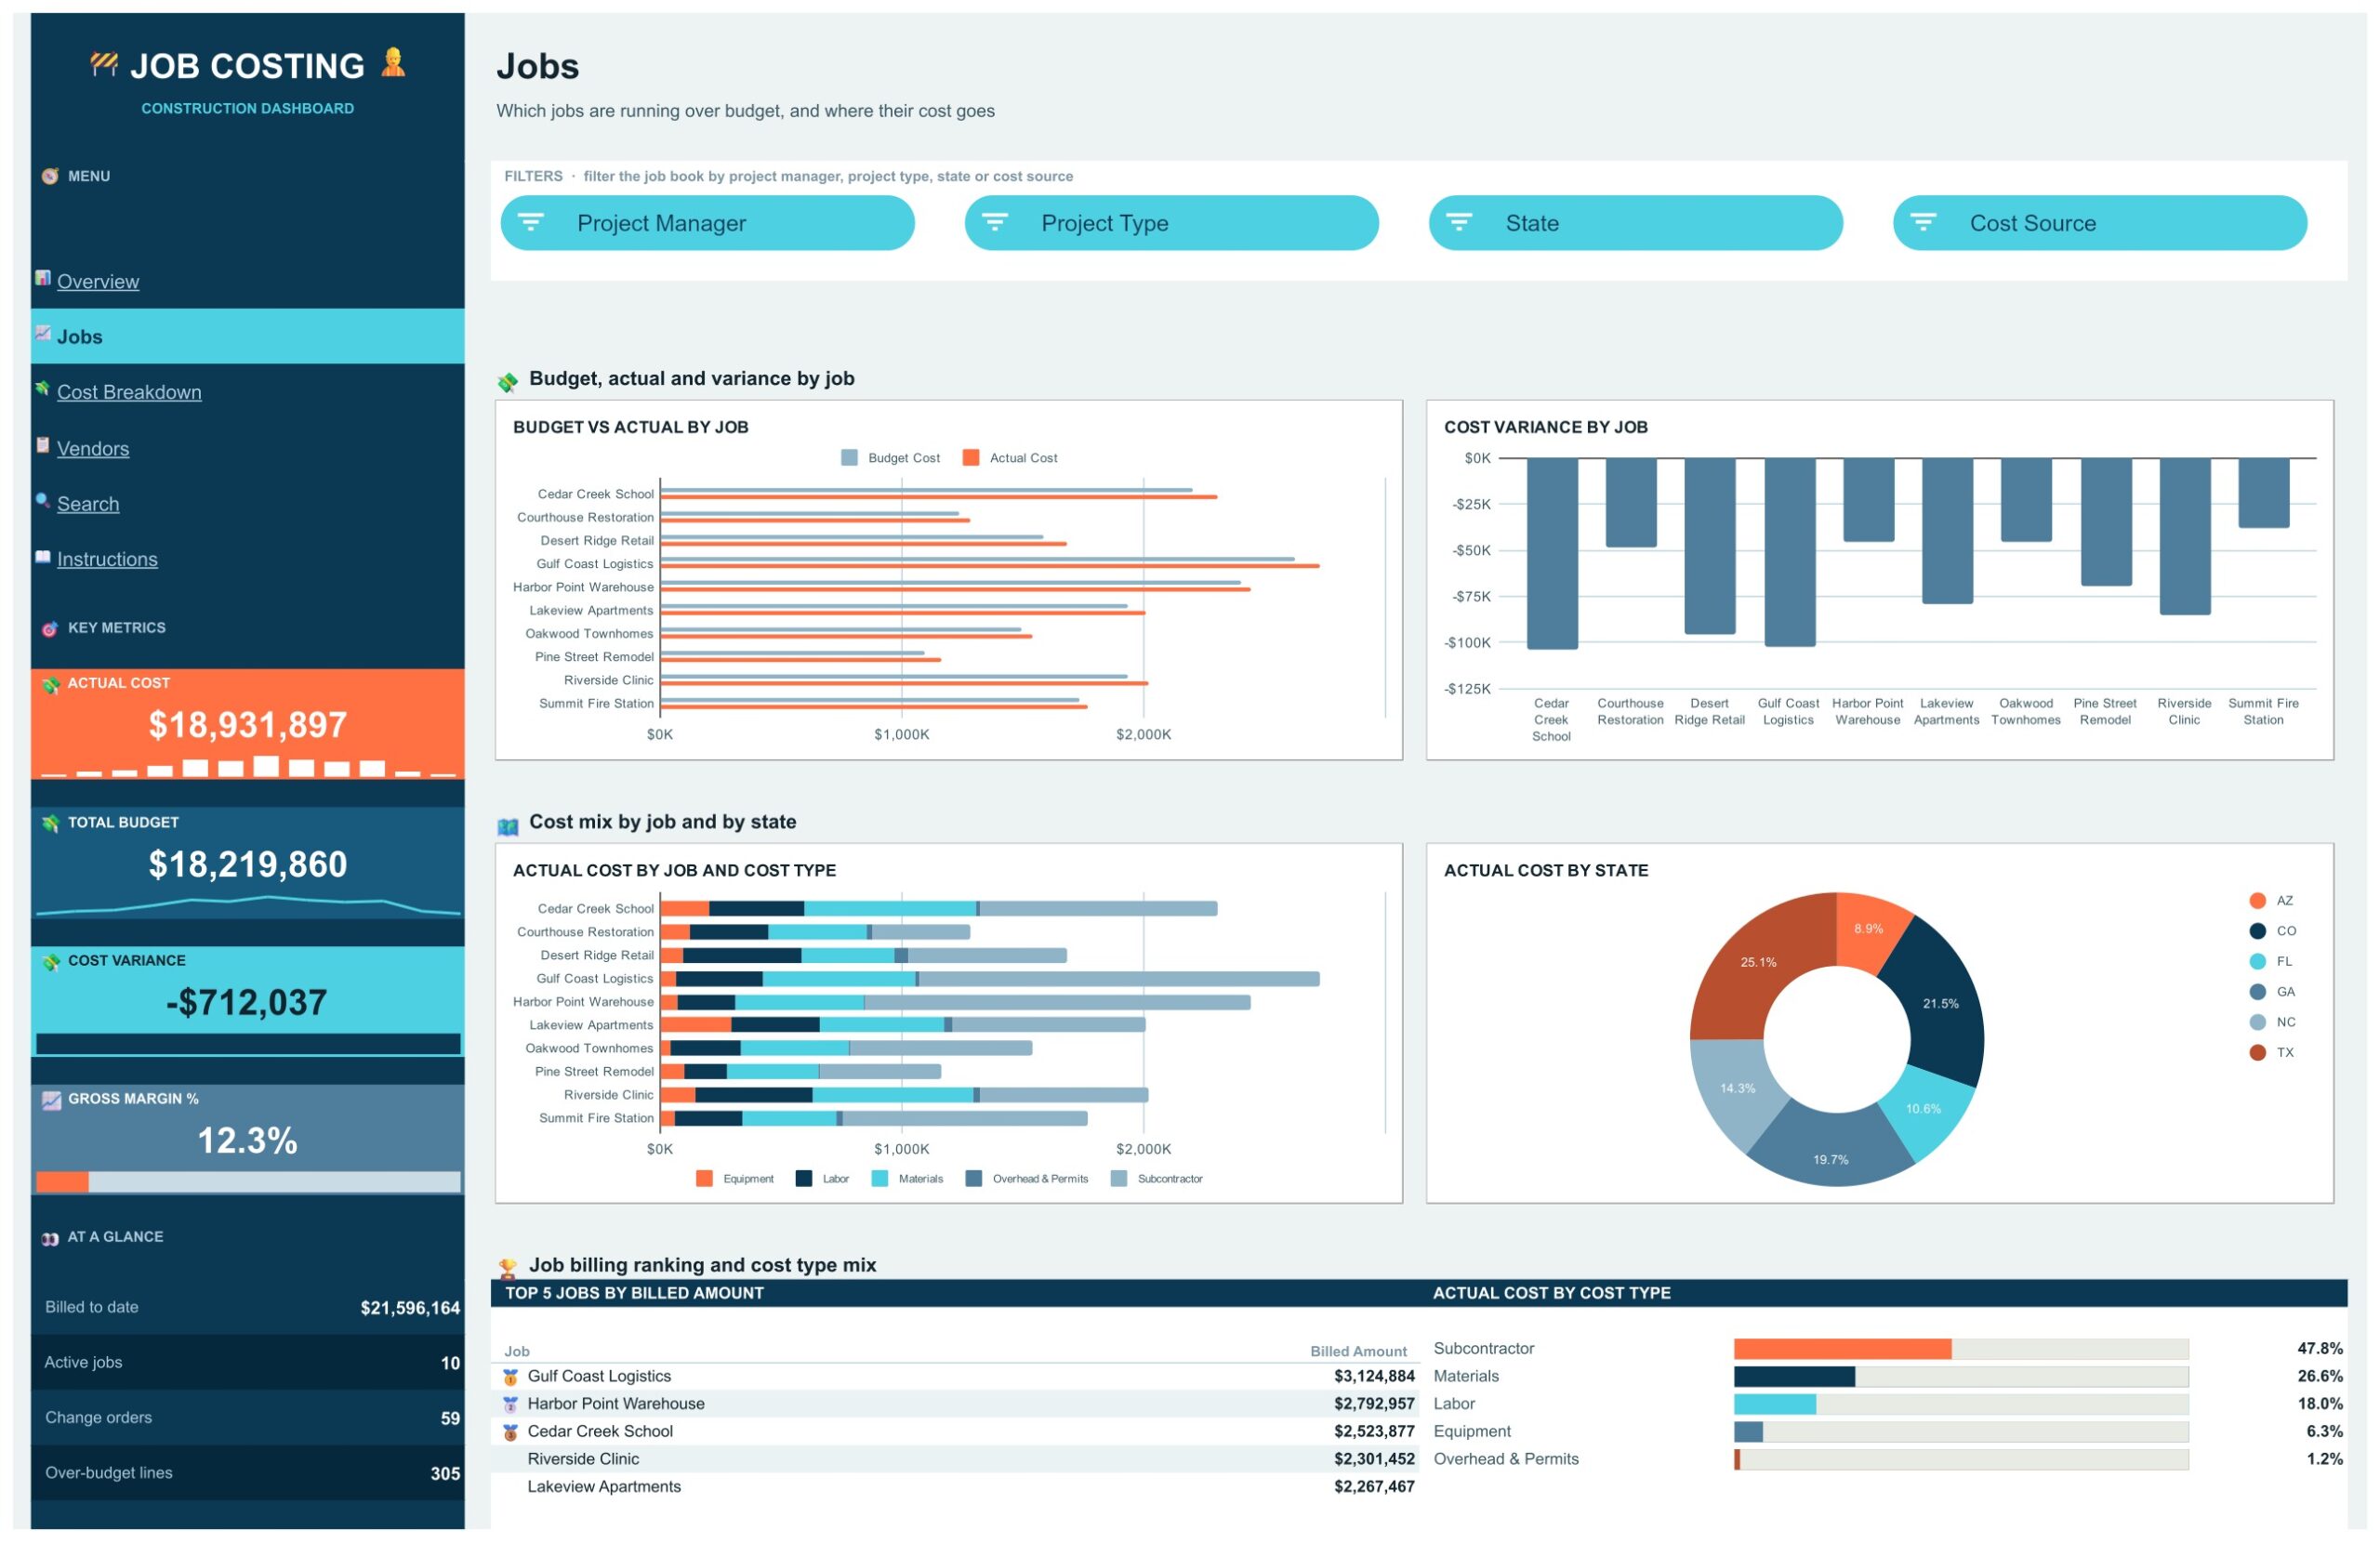
Shows which jobs are running over budget and where their cost goes. Budget vs Actual by Job, Cost Variance by Job, Actual Cost by Job and Cost Type and Actual Cost by State sit beside a Top 5 Jobs by Billed Amount panel. Project Manager, Project Type, State and Cost Source slicers filter the job book.
Cost Breakdown Page
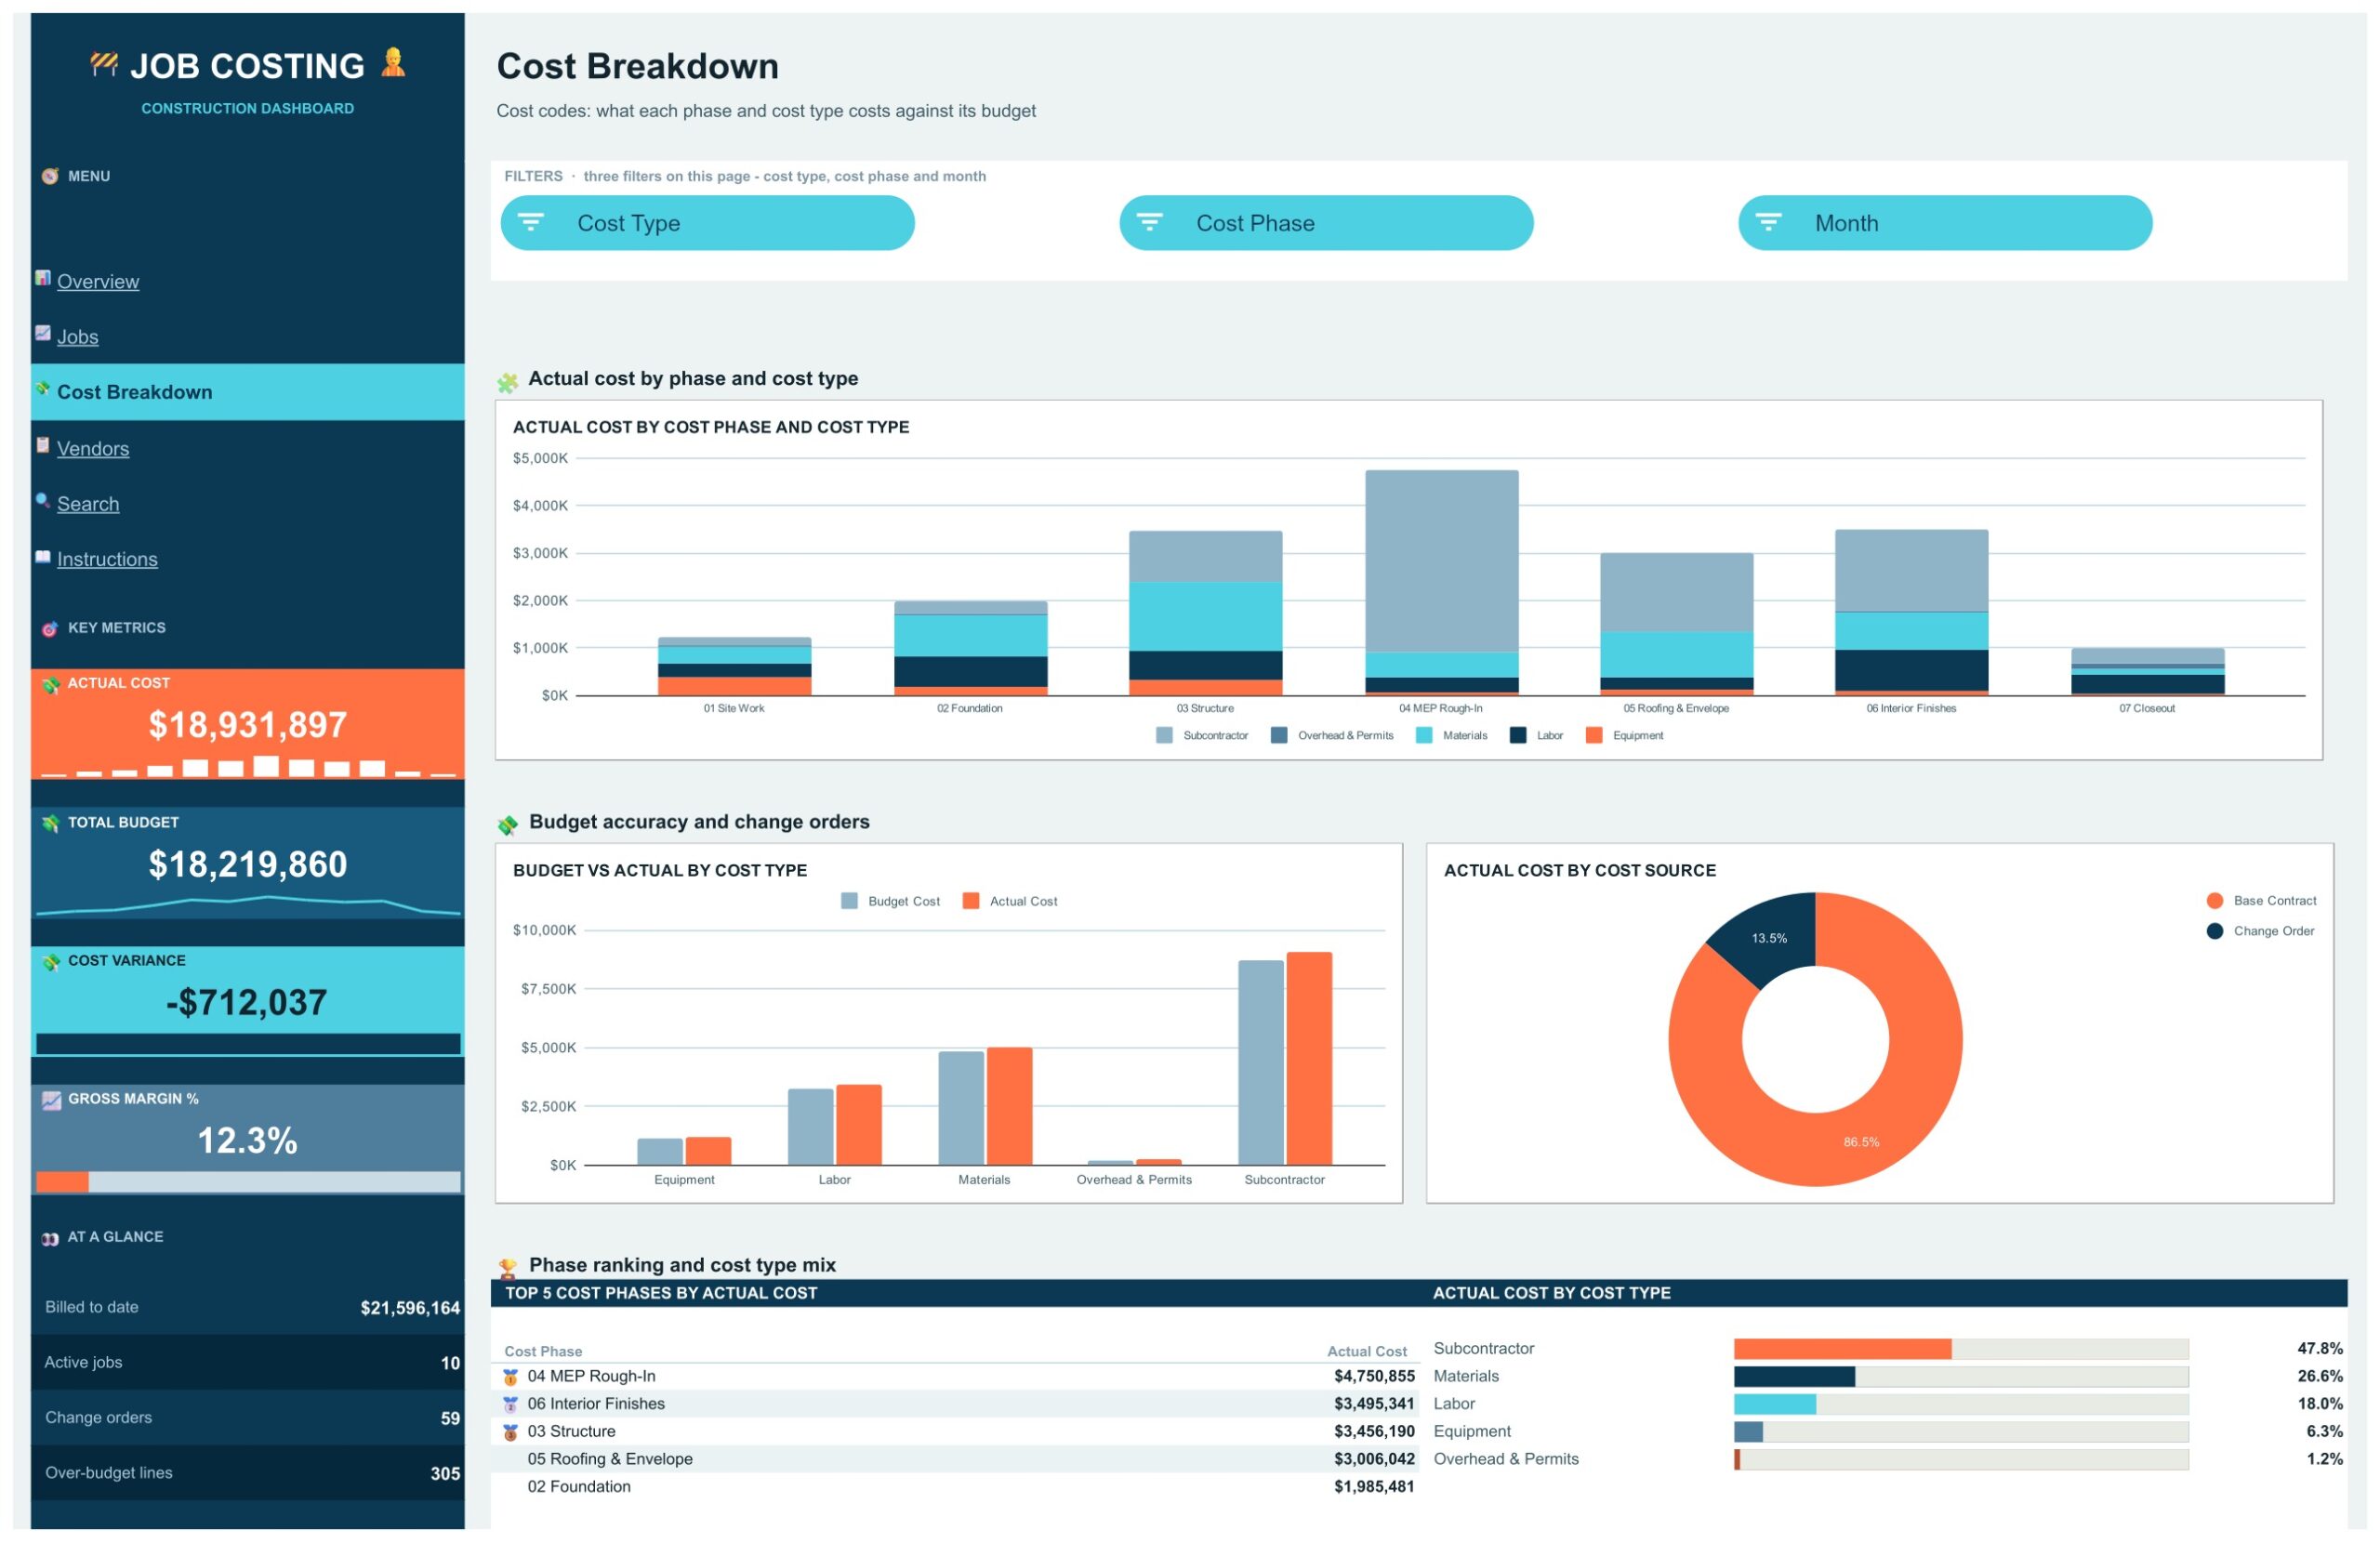
Cost codes: what each phase and cost type costs against its budget. Actual Cost by Cost Phase and Cost Type, Budget vs Actual by Cost Type and Actual Cost by Cost Source (base contract against change orders) are joined by a Top 5 Cost Phases panel. Cost Type, Cost Phase and Month slicers filter the page.
Vendors Page
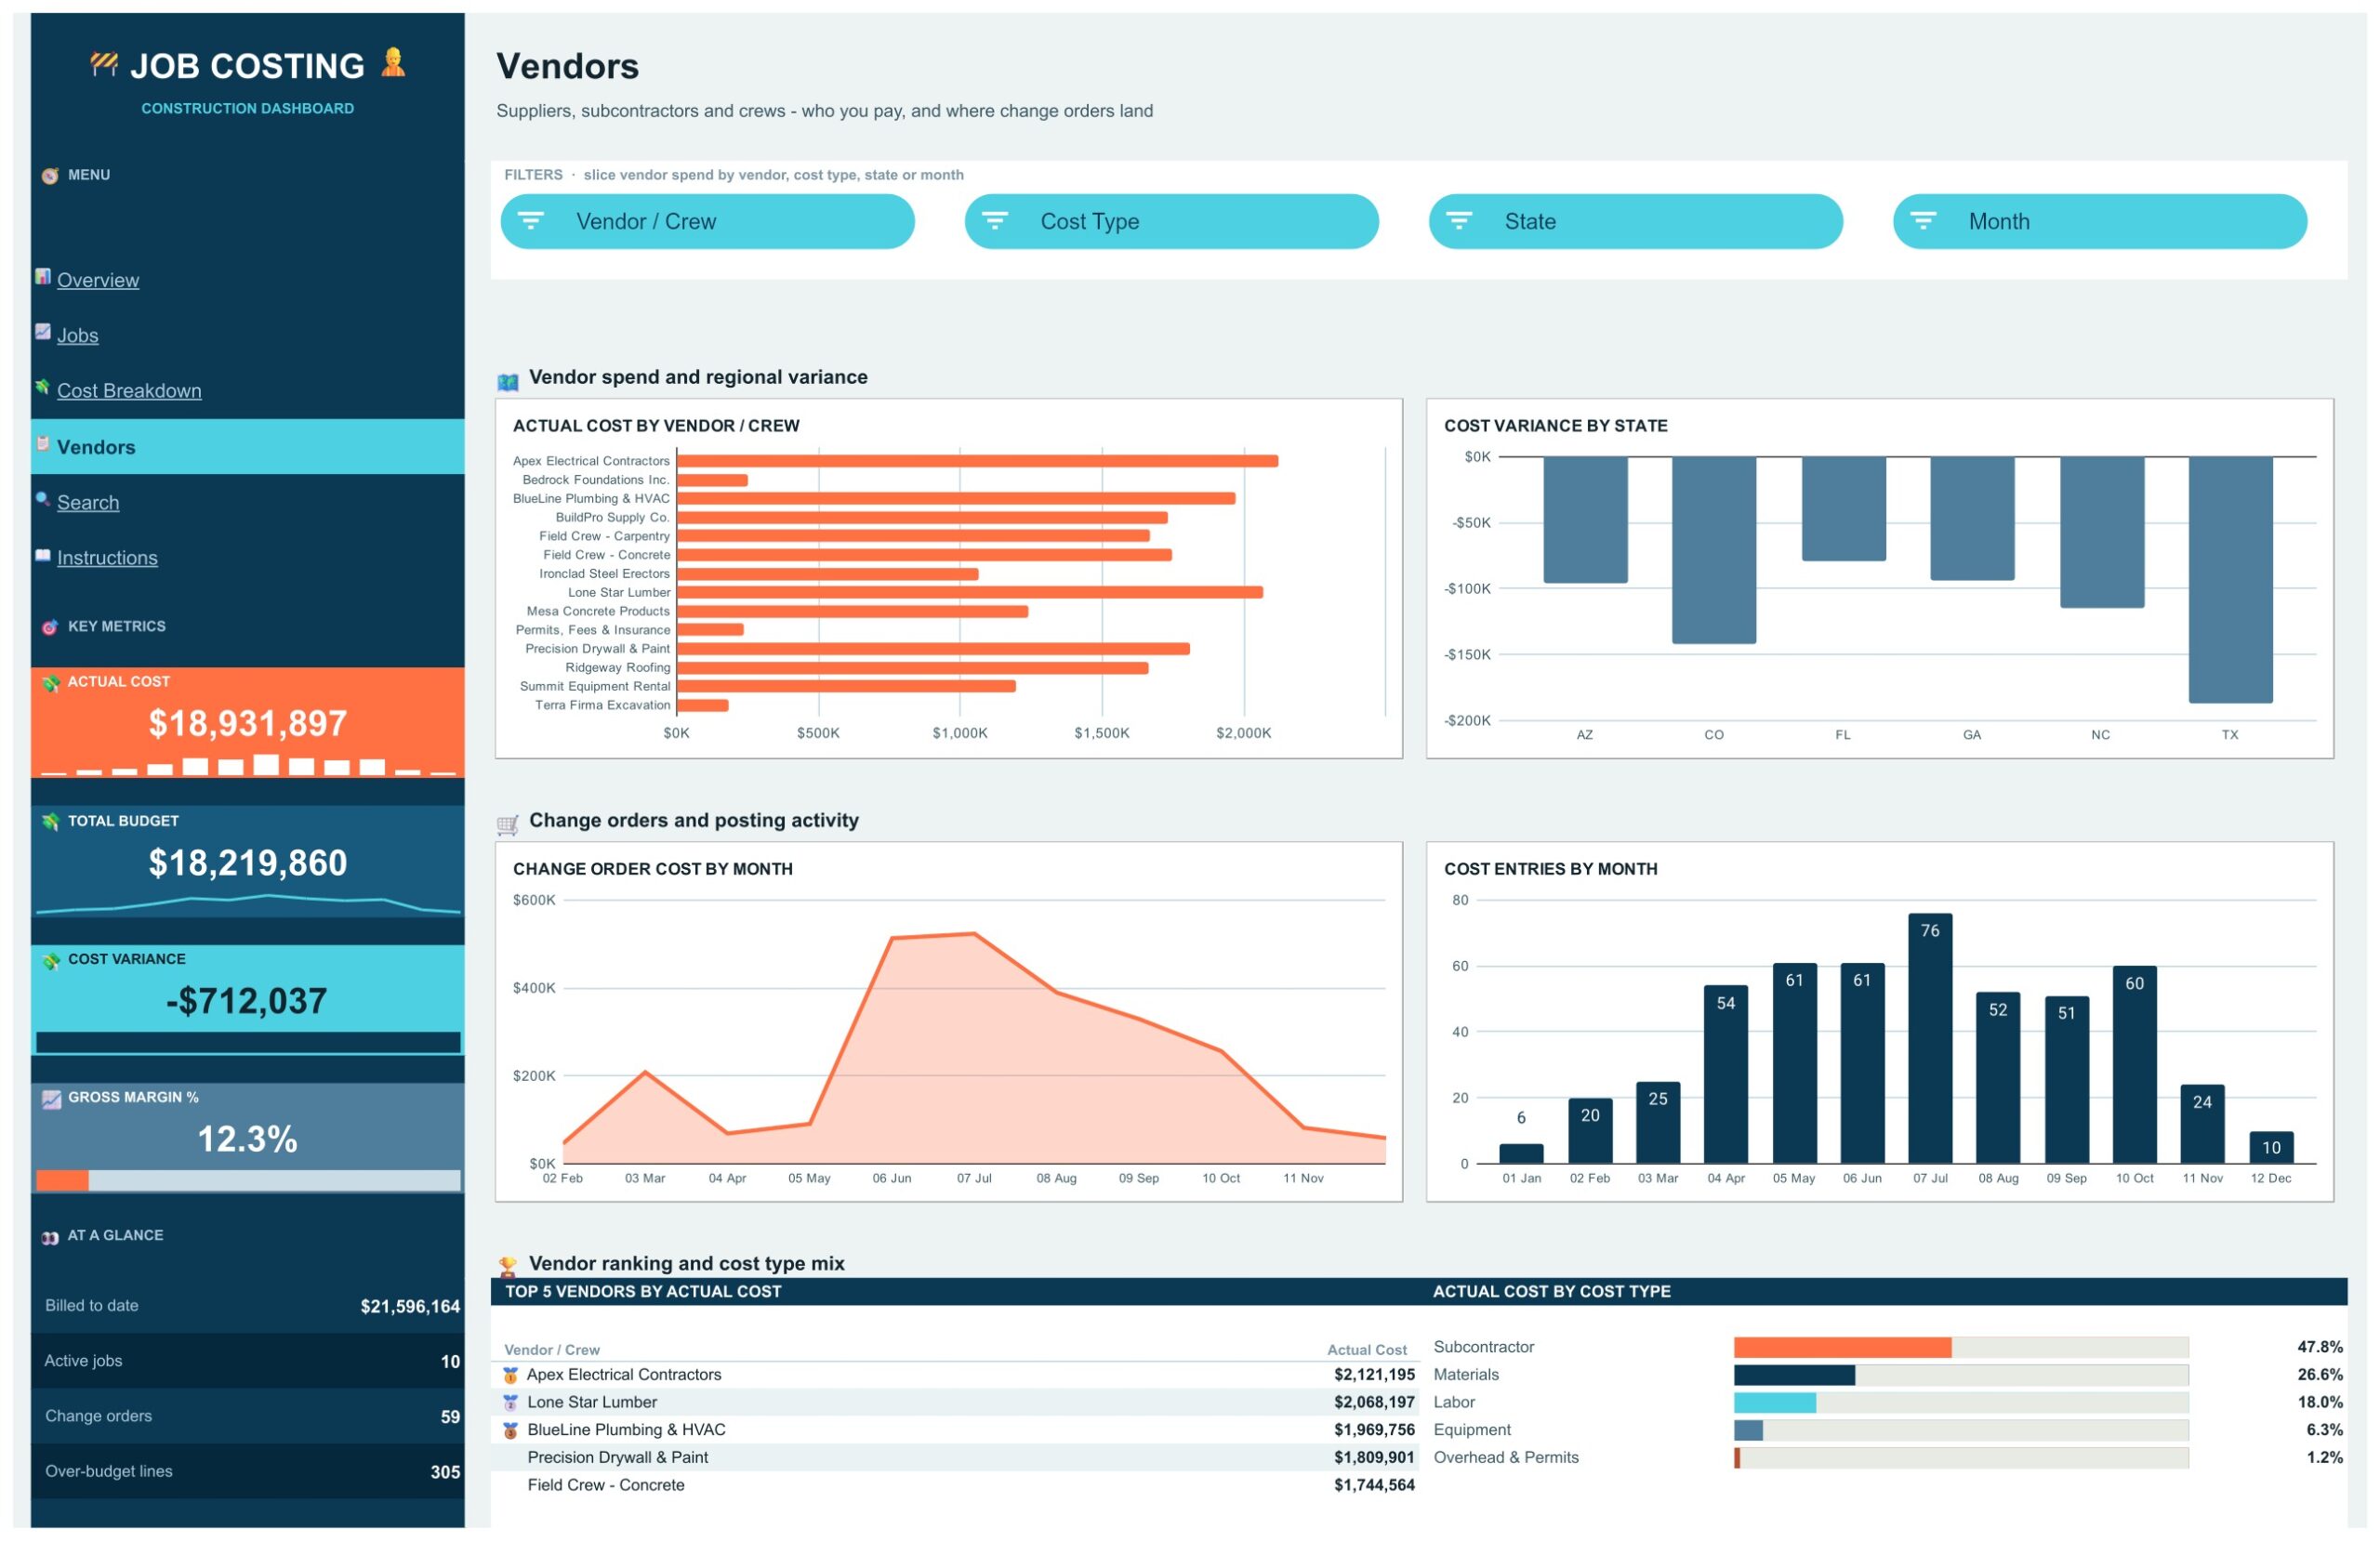
Suppliers, subcontractors and crews: who you pay, and where change orders land. Actual Cost by Vendor / Crew, Cost Variance by State, Change Order Cost by Month and Cost Entries by Month sit beside a Top 5 Vendors by Actual Cost panel. Vendor / Crew, Cost Type, State and Month slicers filter the page.
Search Page
Type any Entry ID, such as JC-0001, and the full cost record appears: date, job name, project type, project manager, state, cost phase, cost type, vendor or crew, cost source, budget cost, actual cost, billed amount, cost variance, month and margin on entry. A missing ID reads Not found instead of an error.
Instructions Page
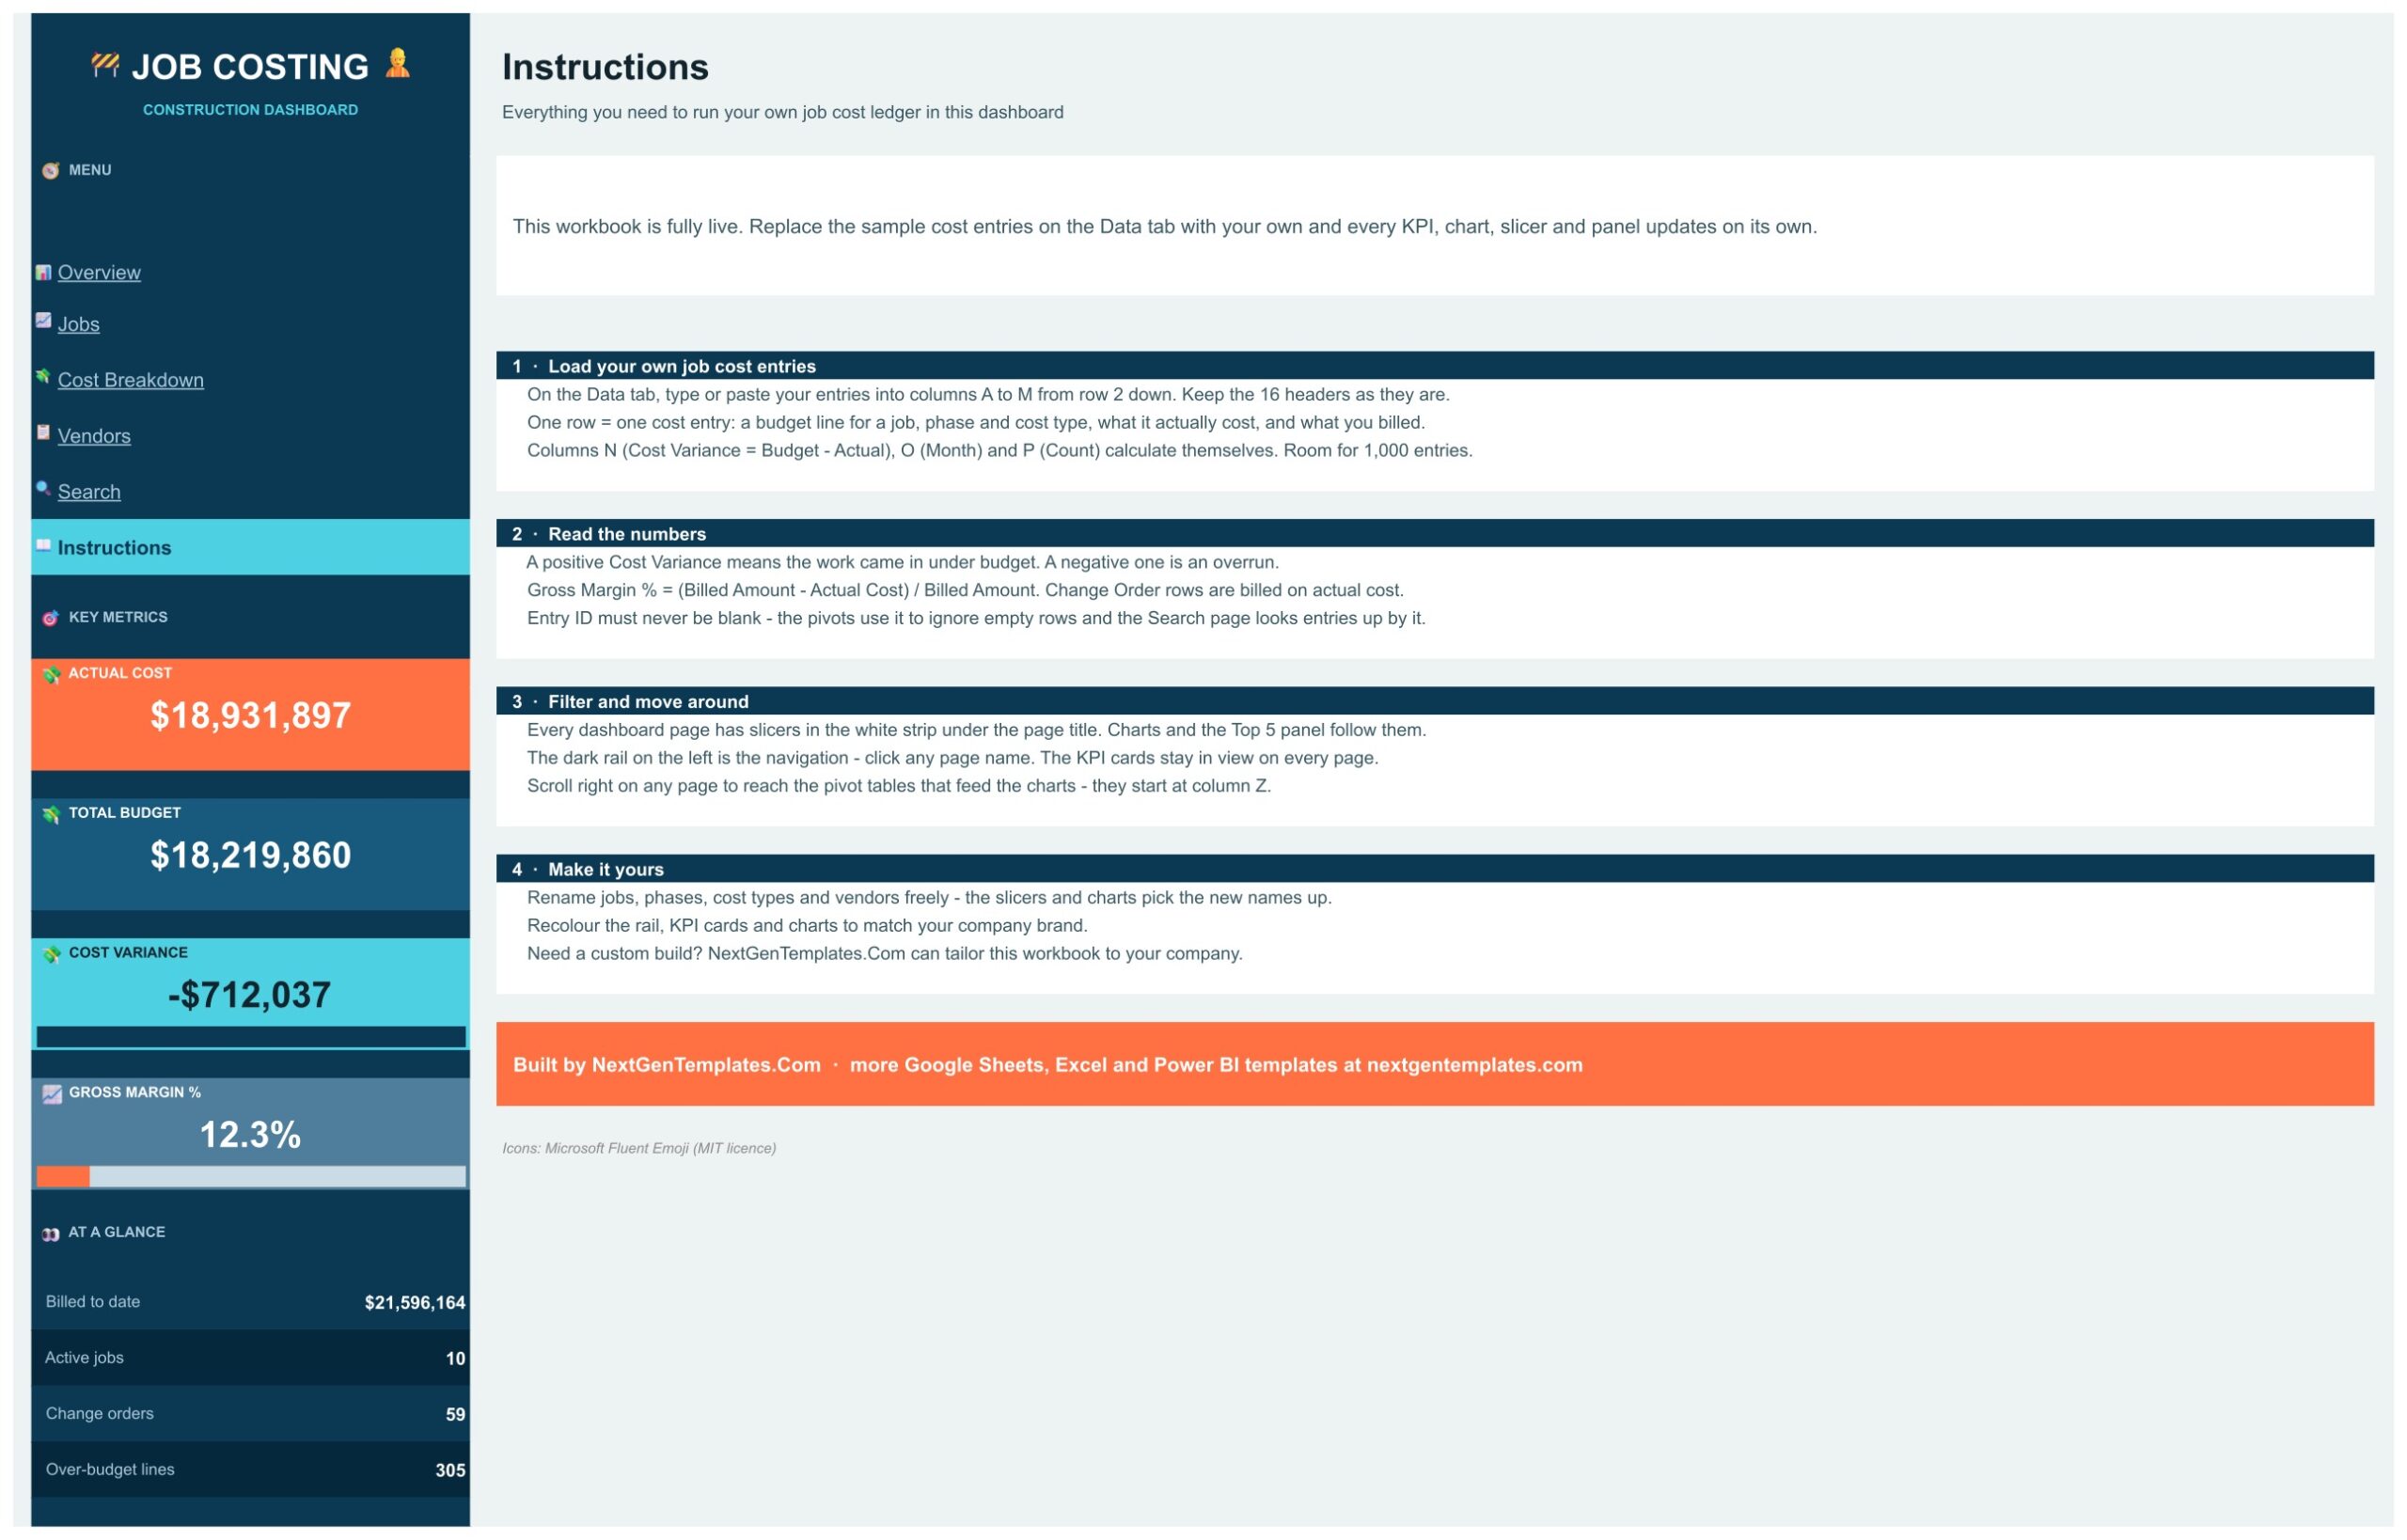
Four short steps: load your own job cost entries on the Data tab (16 headers, room for 1,000 entries), read the numbers (a positive Cost Variance is under budget, a negative one is an overrun), filter and move around with the slicers and the left rail, and make it yours by renaming jobs, phases, cost types and vendors.
📊 Construction Job Costing Dashboard vs. a Job Cost Spreadsheet vs. Construction Software: Where This Fits
| Feature | This Google Sheets dashboard | Plain job cost spreadsheet | Construction management software |
|---|---|---|---|
| Cost | $9.99 one-time ✅ | Free, but you build it | Monthly subscription, often per user |
| Budget vs actual by job, phase and cost type | Charts and cards ✅ | Manual formulas | Yes ✅ |
| Change order cost by month | Yes ✅ | Build it yourself | Varies |
| Slicers for job, manager, vendor and month | Yes ✅ | No | Varies |
| Estimating, bidding and payroll | No | No | Often included |
| Add-ons or scripts required | No | No | Not applicable |
If you already keep a job cost ledger and want to see overruns by job, phase and vendor without another subscription, this dashboard fits. If you need estimating, bidding, scheduling or payroll, you need other software as well.
👥 Who This Template Is For, and Who It Is Not For
✅ This template is built for:
- General contractors and specialty trades who track cost job by job
- Project managers who need budget against actual by phase and cost type
- Owners and controllers who review gross margin and billed amount
- Small construction firms that want job costing without paying for software
❌ This template is NOT for:
- Teams that need estimating, bidding, scheduling or payroll, because it only reports on cost entries you add
- Anyone looking for accounting, lien, tax or compliance functions, which it does not provide
- Teams that need a live feed from an accounting system, because entries are typed or pasted into the Data tab
⚙️ How to Use the Construction Job Costing Dashboard
- Open the PDF guide in your download and click the link to open the dashboard.
- Choose File, then Make a copy and save it to your own Google Drive.
- Go to the Data tab and type or paste your own cost entries over the sample rows. Keep the 16 headers unchanged.
- Use the slicers on each page to filter the charts and Top 5 panels.
- Move through Overview, Jobs, Cost Breakdown and Vendors from the navigation rail.
💼 Real-World Use Cases
The weekly job review. A project manager filters the Jobs page to one manager and sees which jobs have a negative cost variance.
The phase check. An estimator opens Cost Breakdown, compares budget and actual by cost type, and sees where the budget was too thin.
The change order question. An owner looks at Cost Source and the change order chart to see how much cost arrived after the base contract.
❓ Frequently Asked Questions
What does the Construction Job Costing Dashboard in Google Sheets show?
It turns a job cost ledger into budget against actual cost, cost variance, billed amount and gross margin, split by job, project manager, cost phase, cost type, vendor, state and month.
Is this construction accounting or estimating software?
No. It is a reporting dashboard. You type or paste cost entries into the Data tab and the pages report on them. It does not estimate, bid, post to a general ledger or replace your accounting software.
How do I get my own copy?
Open the PDF guide in your download, click the link and choose File, then Make a copy. The copy lands in your Google Drive and is fully editable.
Do I need add-ons, scripts or macros?
No. It is built with formulas, pivot tables and native slicers. There is no add-on, no Apps Script and no macro to authorise.
How many cost entries can it hold?
The Data tab has room for 1,000 entries. Each row is one cost entry: a budget line for a job, phase and cost type, what it actually cost and what you billed.
How is cost variance calculated?
Cost Variance is Budget minus Actual. A positive figure means the work came in under budget and a negative figure is an overrun. Gross Margin % is Billed Amount minus Actual Cost, divided by Billed Amount.
Is the sample data real?
No. The ten jobs, project managers, vendors and every figure are fictional sample data. Replace them with your own entries.
Can I rename jobs, phases and vendors?
Yes. Use your own names on the Data tab and the slicers and charts pick them up.
👤 About the Author
Built by PK, Microsoft Certified Professional with 15+ years of Excel, Google Sheets and Power BI experience. Founder of NextGenTemplates. Every template is hand-built and tested before release.
🔗 Explore Related Templates
- Construction Job Costing Dashboard in Excel: the Excel edition of this dashboard.
- Interior Fit-Out Project Management System Web App: manage fit-out projects end to end.
- Kitchen Remodeling KPI Dashboard in Google Sheets: a KPI scorecard for remodeling work.
- Zero-Based Budget Template in Excel and Google Sheets: plan budgets before you report against them.
Browse all Google Sheets dashboards.
🎥 Visit our YouTube channel for step-by-step video tutorials
👉 YouTube.com/@NextGenTemplates
📅 Last updated: November 2026
Compatibility and Requirements
- Works in Google Sheets. You need a free Google account and a web browser.
- Every chart reads a native Google Sheets pivot table. Google explains how to build charts in Add and edit a chart or graph.




















Reviews
There are no reviews yet.