

The best travel agency dashboard template for most agencies and tour operators in 2026 is the Travel & Tourism Dashboard in Excel ($17.99): it tracks bookings, revenue, cost, profit and satisfaction by channel, region, tour type and month from one data sheet. The Google Sheets edition is the best value at $9.99, and six more ranked picks cover KPIs, group tours and luxury travel.
Last updated: October 2026
Key takeaways
- Best overall travel agency dashboard template: the Travel & Tourism Dashboard in Excel at $17.99, with Overview, Customer Segment, Department, Region, Tour Type and Monthly Trend views.
- Best value: the Travel and Tourism Dashboard in Google Sheets at $9.99, shared by every agent in a browser.
- Tour operators running escorted departures get a full operations system, not just reports, in the Group Tour Coordination Management System Web App for a one-time $39.99.
- Seven of the eight picks are reporting templates priced $9.99 to $17.99; travel agency and tour operator software is usually billed per user, per month.
- Templates report on your bookings; they do not take reservations, connect to a GDS or process payments, which stay in your booking system.
Travel agency and tour operator templates compared
| Template | Format | Best For | Price |
|---|---|---|---|
| Travel & Tourism Dashboard | Excel | Best overall: bookings, revenue, profit by channel, region and tour type | $17.99 |
| Travel and Tourism Dashboard | Google Sheets | Best value: multi-branch agencies sharing one live file | $9.99 |
| Group Tour Coordination Management System | Web App | Tour operators running group departures end to end | $39.99 |
| Travel Agencies KPI Dashboard | Excel | Monthly agency KPIs vs target and last year | $14.99 |
| Travel Agencies KPI Dashboard | Power BI | Owners presenting KPIs to partners or investors | $11.99 |
| Travel & Tourism KPI Scorecard | Excel | Red, amber, green scorecard of 10 KPIs | $14.99 |
| Travel & Tourism KPI Dashboard | Google Sheets | Shared KPI tracking for small agencies | $9.99 |
| Luxury Travel KPI Dashboard | Power BI | Luxury, concierge and boutique travel brands | $11.99 |
How we picked these travel templates
We searched the full NextGenTemplates catalogue of Excel, Google Sheets, Power BI and web app products for travel, tourism, tour, booking and agency tools, then kept the eight that a travel agency owner, branch manager or tour operator would open every week. Each pick had to run from a real data sheet or database, show genuine travel measures such as booking revenue, cancellation rate or departure load, and be editable without a consultant.
We left out niche tourism dashboards (eco, medical, heritage, pilgrimage and adventure tourism) and employee travel-expense trackers from the ranking because they serve a different buyer, and we list the closest ones in the decision section. Prices are the current one-time list prices on each product page. For industry context we use the World Travel & Tourism Council economic impact research, the most widely cited public dataset on the size of the sector.
Why travel agencies and tour operators need a dashboard
A travel business runs on thin margins and many moving parts. One booking can involve a flight, a hotel, transfers, insurance and a commission split, and each component has its own supplier cost, payment date and cancellation policy. The data usually exists, but it is scattered across a booking engine, supplier invoices, a payment gateway and an agent’s own spreadsheet.
So the Monday meeting starts with someone copying exports into a workbook, and the questions that matter still take a day to answer: which channel brings bookings that actually make a profit, which packages are selling below cost after supplier increases, and which agent converts enquiries best. Seasonality makes this worse, because a strong summer can hide a margin problem that only shows up when demand drops.
Travel agency CRMs and tour operator platforms do include reports, but they are subscriptions, typically priced per user per month, and many smaller agencies cannot justify another seat licence just for reporting. A travel agency dashboard template sits on top of your exports. It does not replace the booking system; it turns the numbers into a one-page view for a one-time $9.99 to $17.99.
The 8 best travel agency and tour operator templates for 2026
1. Travel & Tourism Dashboard in Excel: best overall
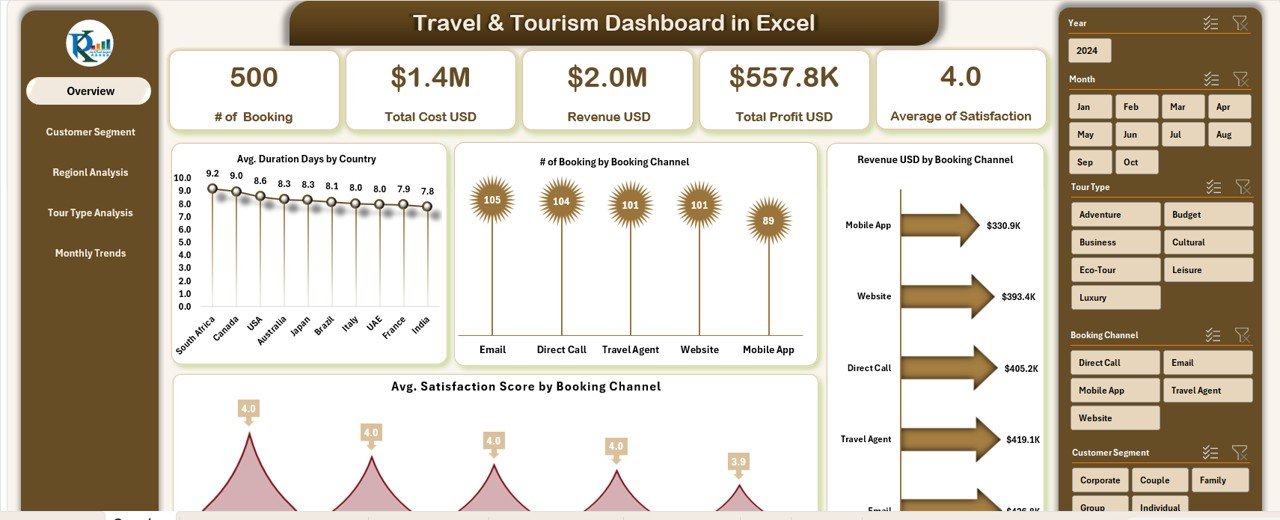
This is the most complete travel agency dashboard template in the roundup, and it ranks first because it is the only reporting pick that joins bookings, revenue, cost, profit and customer satisfaction across channel, region, tour type and customer segment in one Excel file. Slicers filter every view, and nothing needs macros or Power BI.
Who it is for: travel agency owners, tour company managers and tourism analysts who already report in Microsoft Excel.
- Overview with KPI cards for number of bookings, total cost, revenue, total profit and average satisfaction.
- Charts for revenue by booking channel, profit by tour type and satisfaction score by customer segment.
- Customer Segment, Department and Regional Analysis pages to compare costs, revenue and efficiency.
- Tour Type Analysis (adventure, business, cultural, luxury) and a Monthly Trends view for bookings, travellers, duration and profit.
Concrete uses: the sample data shows 500 bookings, $2.0M revenue, $1.4M cost and $557.8K profit, roughly a 28% margin, which is the number to watch each month; compare online, agent and walk-in channels to see which one converts revenue into profit; and spot the tour type with high satisfaction but thin margin before you reprice it. Price: $17.99. Get the Travel & Tourism Dashboard in Excel →
Best for: the agency that wants one complete Excel view of bookings, profit and customer experience.
2. Travel and Tourism Dashboard in Google Sheets: best value
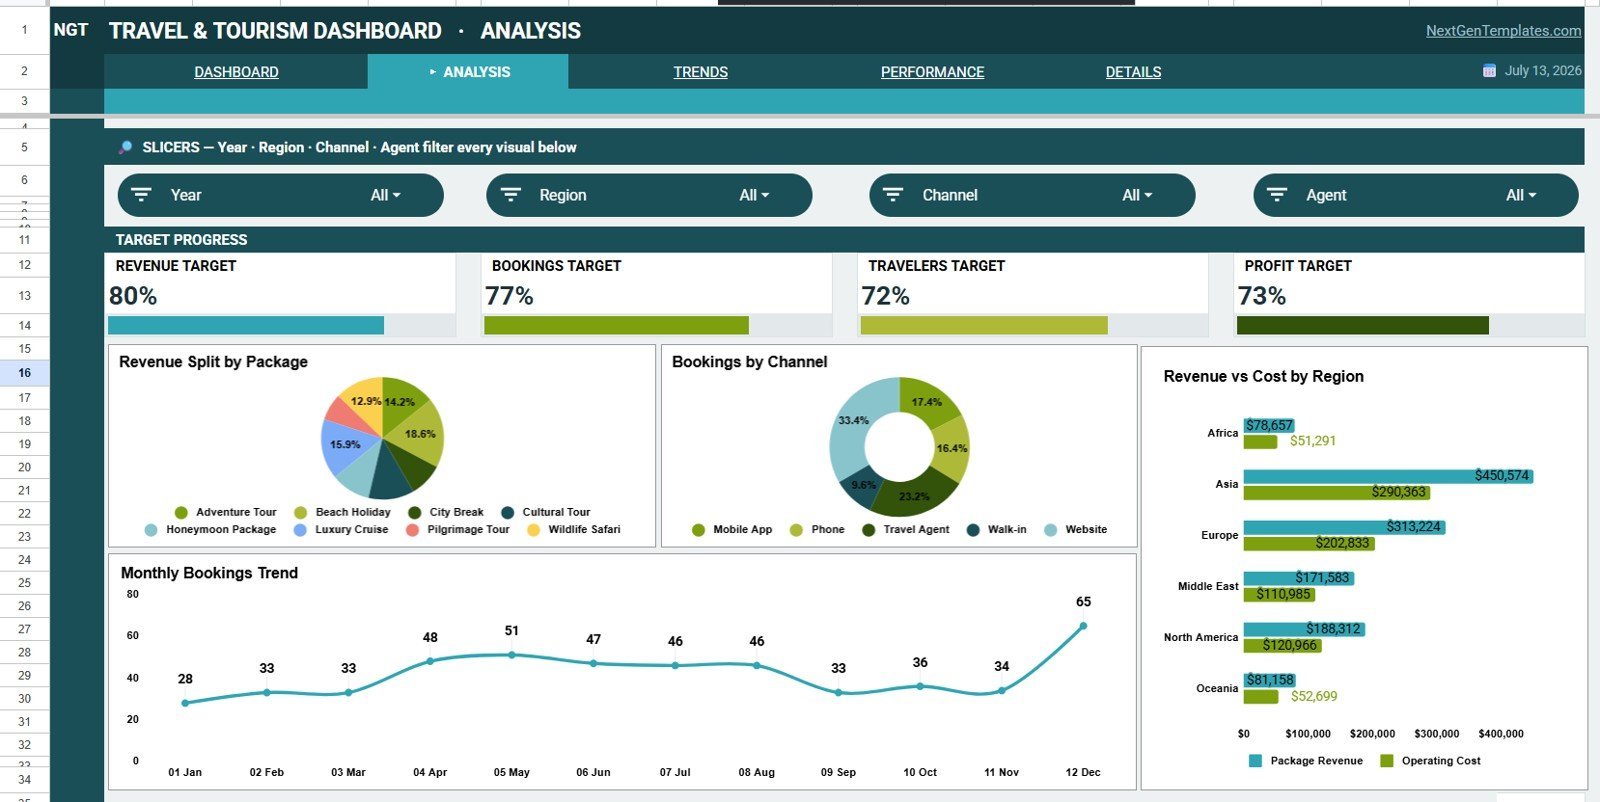
At $9.99 this is the best value in the list. It is a separate build, not a copy of the Excel file: six tabs (Overview, Analysis, Trends, Performance, Details and Data Sheet) run in Google Sheets, so agents in different branches open the same live file from any browser.
Who it is for: small and multi-branch agencies, tour operators and destination teams already working in Google Workspace.
- Seven KPI cards: Total Revenue, Total Cost, Net Profit, and progress against revenue, bookings, travellers and profit targets.
- Revenue and cost by package, revenue by region and bookings by channel and month.
- Performance tab comparing revenue and cost by agent, profit by month and profit by region.
- Details tab with revenue and profit by booking ID, for tracing a summary number back to the bookings behind it.
Concrete uses: see that revenue sits at 80% of target while travellers sit at 72%, a sign of rising spend per traveller rather than more volume; rank agents by profit rather than revenue; and send branch managers a view-only link instead of a weekly PDF. Price: $9.99. Get the Travel and Tourism Dashboard in Google Sheets →
Best for: agencies that need shared, browser-based reporting at the lowest price.
3. Group Tour Coordination Management System Web App: best for tour operators
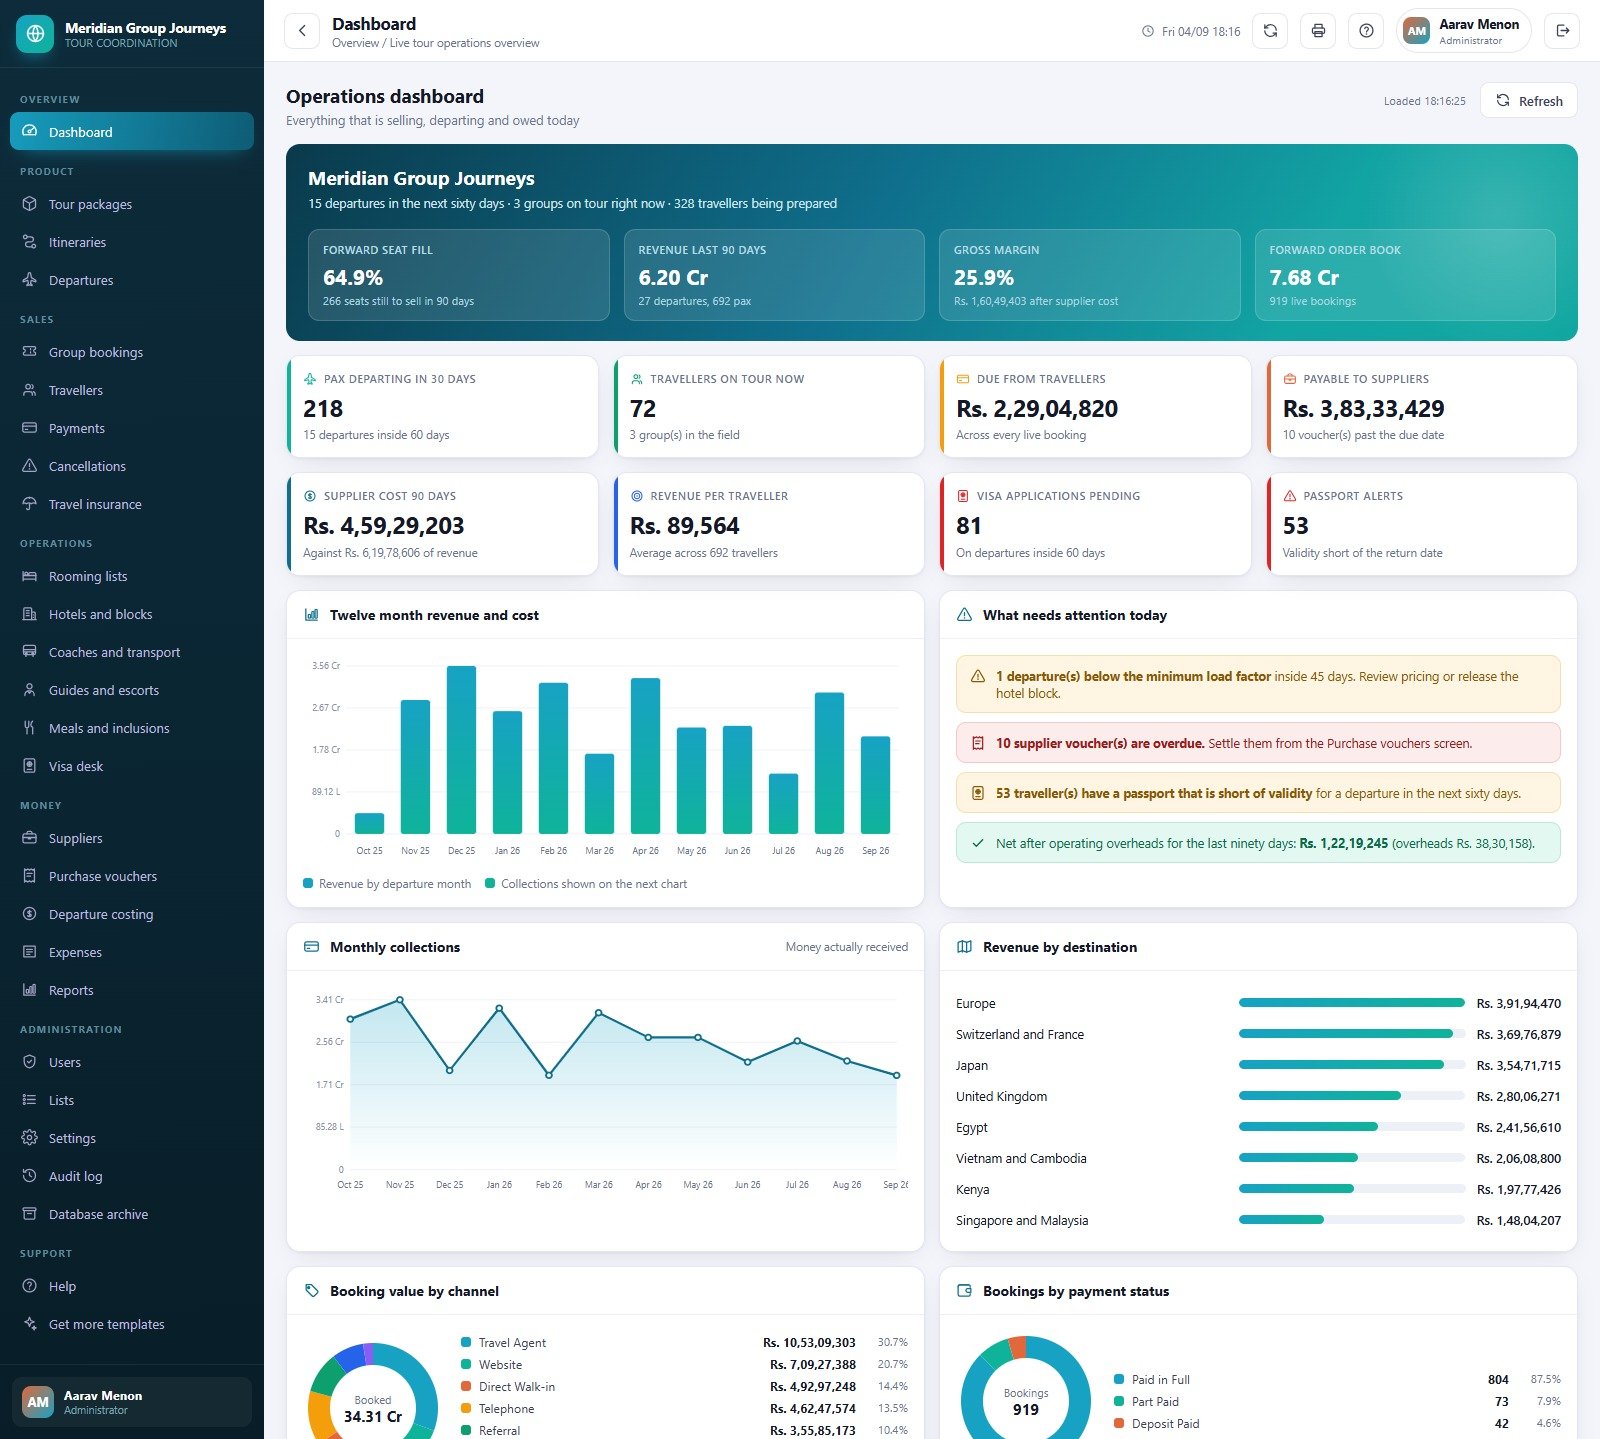
The only pick that runs the operation rather than reporting on it. This Google Apps Script web app covers the full life of an escorted group departure in 27 screens over 28 database tables, with 17 printable reports and six user roles enforced by 52 server-side permissions. It runs on your own Google account, you own the source, and there is no monthly fee.
Who it is for: tour operators, destination management companies and group travel organisers that run fixed departures.
- Product: tour packages, a day-by-day itinerary builder and departures with live seat inventory and load factor.
- Sales: group bookings, traveller records with passport expiry and visa state, payments, cancellations and travel insurance.
- Operations: rooming lists, hotel blocks with release dates, coaches, guides, meals and a working visa desk.
- Money: suppliers, purchase vouchers, departure costing with margin per departure, and expenses.
Concrete uses: a below-load-threshold counter flags departures inside 45 days that are not selling, so you can push them or consolidate; a passport validity watch catches travellers whose passports expire too close to the return date; and departure costing shows margin before the group leaves, not after. A live demo is linked on the product page. Price: $39.99. See the Group Tour Coordination Management System →
Best for: operators who want a system of record for group tours without a monthly SaaS bill.
Not sure where to start? Most agencies start with the Travel & Tourism Dashboard in Excel ($17.99). If your agents work in Google Workspace, the Google Sheets edition ($9.99) is the cheapest way to put one bookings and profit view in front of everyone.
4. Travel Agencies KPI Dashboard in Excel
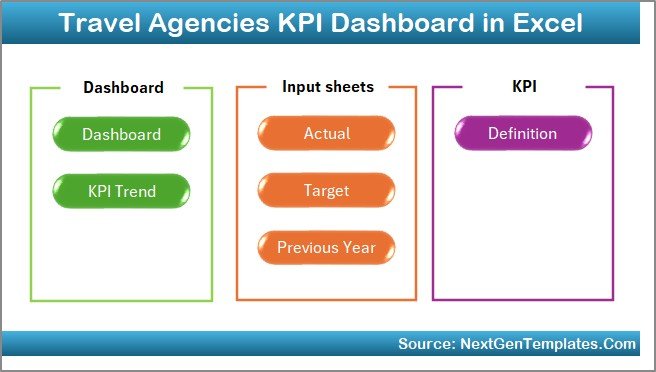
A different style of template: a KPI scorecard rather than a transaction dashboard. You enter one monthly number per KPI, load targets and last year’s figures, and the dashboard shows month-to-date and year-to-date performance with green and red arrows.
Who it is for: agency owners, sales and operations managers and branch heads who report a fixed set of KPIs every month.
- Seven sheets: Home, Dashboard, KPI Trend, Actual Numbers Input, Target, Previous Year Numbers and KPI Definition.
- Month selector that refreshes MTD and YTD actual, target and previous-year values with variances.
- KPI Trend sheet with group, unit, KPI type (upper or lower is better), formula and definition for each measure.
- Add, rename or remove KPIs to fit your own agency scorecard.
Concrete uses: report new customers, repeat booking rate, commission earned and lead conversion rate against target each month; show year-on-year growth to a bank or partner; and hand new branch managers the KPI Definition sheet so every office measures the same way. Price: $14.99. Get the Travel Agencies KPI Dashboard in Excel →
Best for: agencies that manage by monthly targets and previous-year comparison.
5. Travel Agencies KPI Dashboard in Power BI
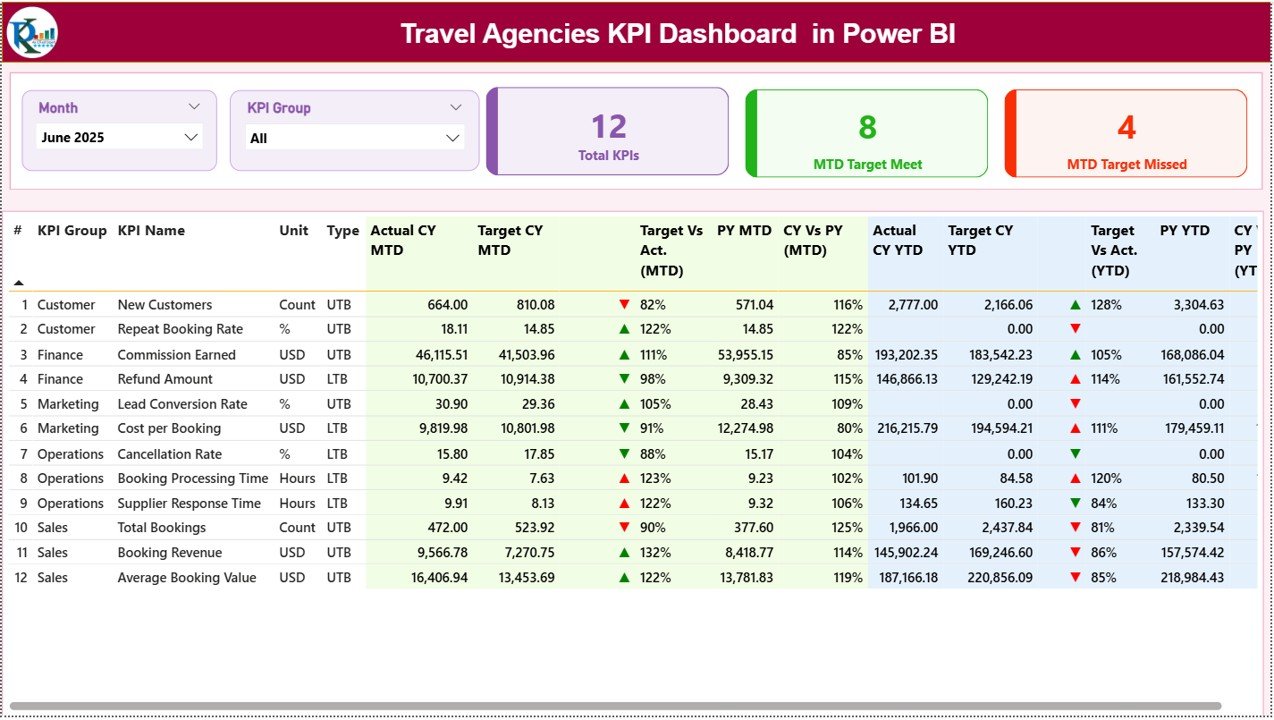
The same KPI framework as pick 4, built as a Power BI report. The Summary page shows total KPIs, how many met their MTD target and how many missed, with month and KPI group slicers and drill-through to each KPI’s formula and definition.
Who it is for: owners and finance leads who present agency performance on screen to partners, investors or franchise networks.
- KPI groups covering customer, finance, marketing, operations and sales.
- Sample measures include cancellation rate, booking processing time, supplier response time, cost per booking and average booking value.
- MTD and YTD trend charts for actual, target and previous year.
- Data maintained in a simple Excel input file and refreshed in Power BI.
Concrete uses: filter to the Operations group to see whether booking processing time is falling after a new process; track refund amount alongside cancellation rate; and run the monthly review from one live screen. Price: $11.99. See the Travel Agencies KPI Dashboard in Power BI →
Best for: agencies that already use Power BI or want an investor-ready KPI view.
6. Travel & Tourism KPI Scorecard in Excel
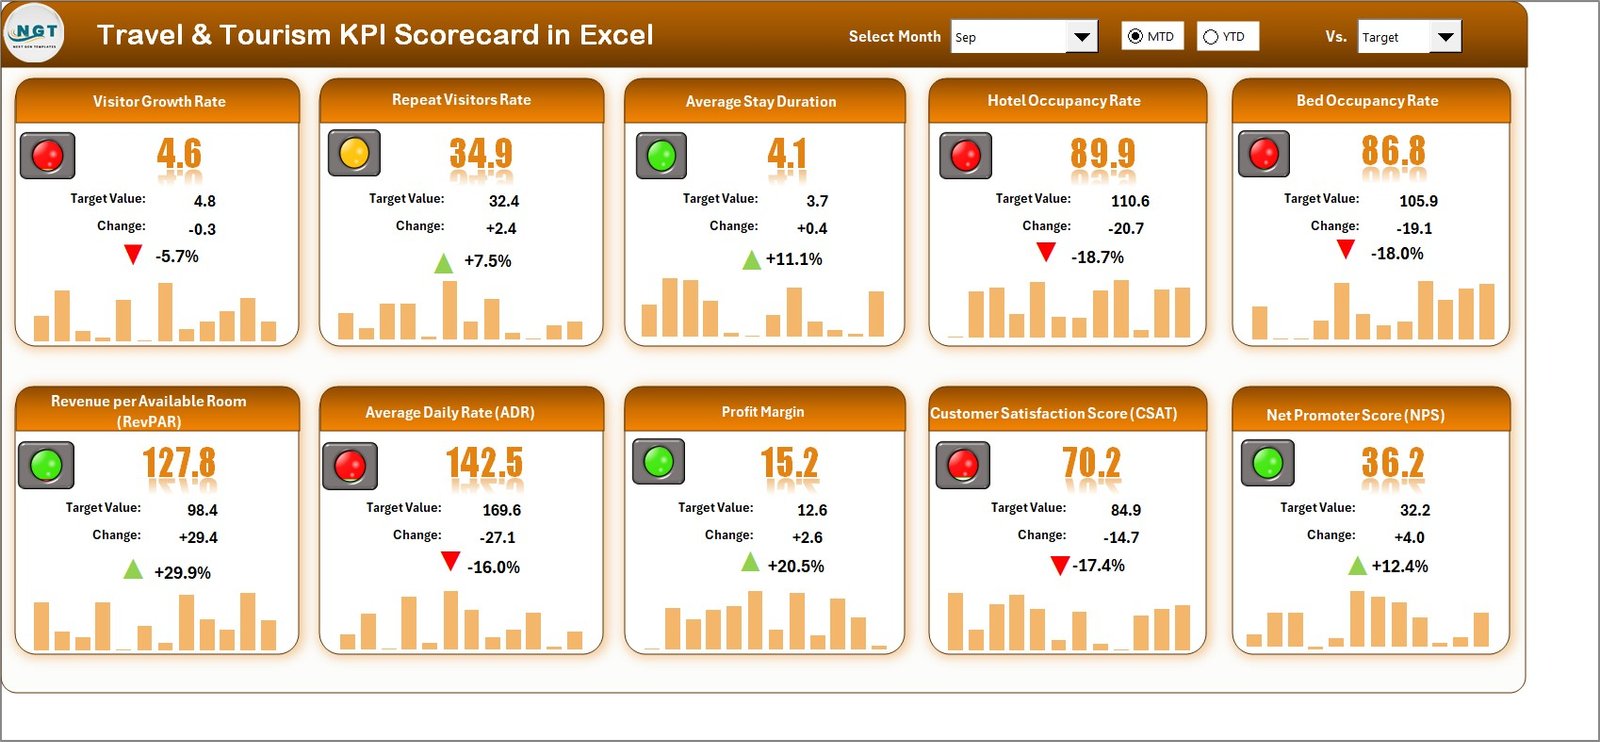
A traffic-light scorecard of 10 KPIs side by side, built for leaders who want status at a glance rather than a wall of charts. Red, yellow and green icons show where each KPI stands against target for the selected month and year to date.
Who it is for: travel agencies, tour operators, destination management companies and hotel groups that report to owners or boards.
- Scorecard sheet with actual vs target, MTD and YTD for 10 KPIs.
- KPI Trend sheet with a KPI drop-down and charts for actual, target and previous year.
- Input Data and KPI Definition sheets for clean, consistent monthly entry.
- Works in Excel 2016, 2019, 2021 and Microsoft 365.
Concrete uses: put occupancy, revenue per room and customer satisfaction on one page for a mixed agency-and-hotel business; show the board which three KPIs are red this month; and keep KPI definitions agreed across departments. Price: $14.99. Get the Travel & Tourism KPI Scorecard in Excel →
Best for: leadership teams that want a one-page red, amber, green status report.
7. Travel & Tourism KPI Dashboard in Google Sheets
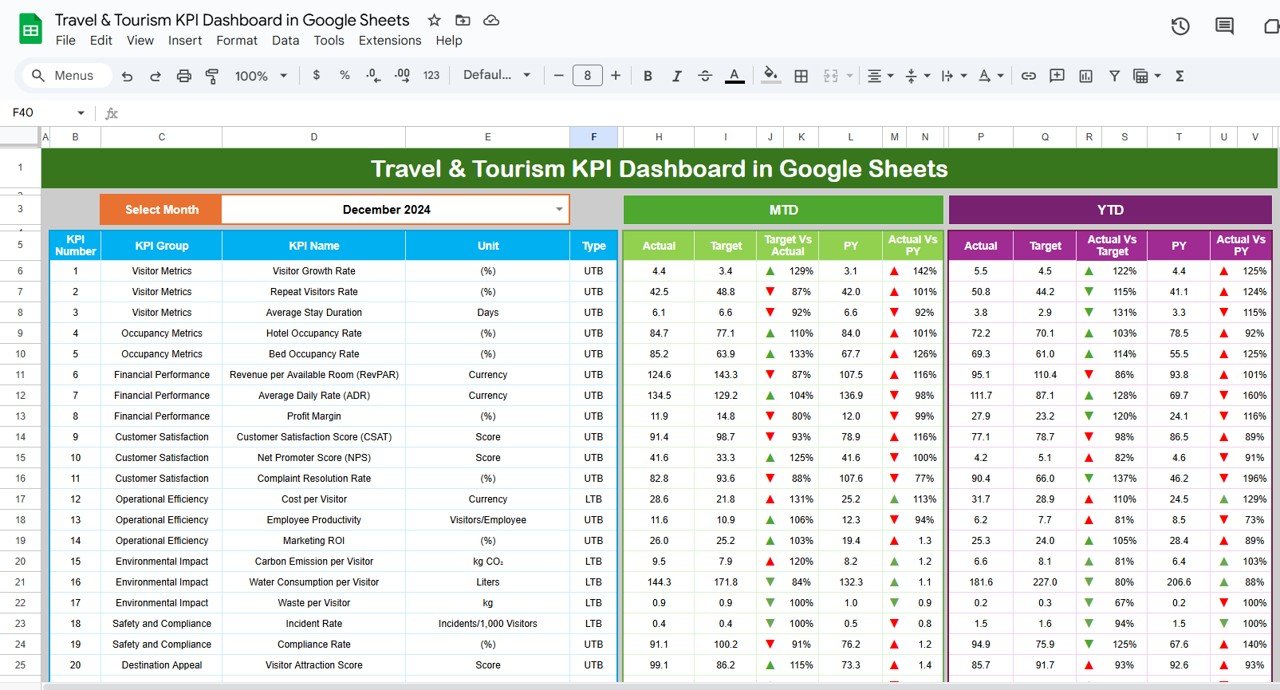
A Google Sheets KPI dashboard aimed at travel agencies, tour operators and hospitality businesses that want shared, customisable KPI tracking without Excel. Formulas calculate averages, percentages and trends automatically as you enter monthly data.
Who it is for: small agencies and tour operators in Google Workspace that are setting up KPI reporting for the first time.
- Customisable KPIs such as booking trends, customer satisfaction and seasonal demand.
- Hospitality measures including occupancy rate, average daily rate and revenue per available room.
- Charts that show trends across months for quick review.
- Browser-based sharing with no installation.
Concrete uses: watch seasonal demand build ahead of peak months; track satisfaction scores after each departure; and let a remote partner update the same file. Price: $9.99. Get the Travel & Tourism KPI Dashboard in Google Sheets →
Best for: a first shared KPI tracker on a small budget.
8. Luxury Travel KPI Dashboard in Power BI
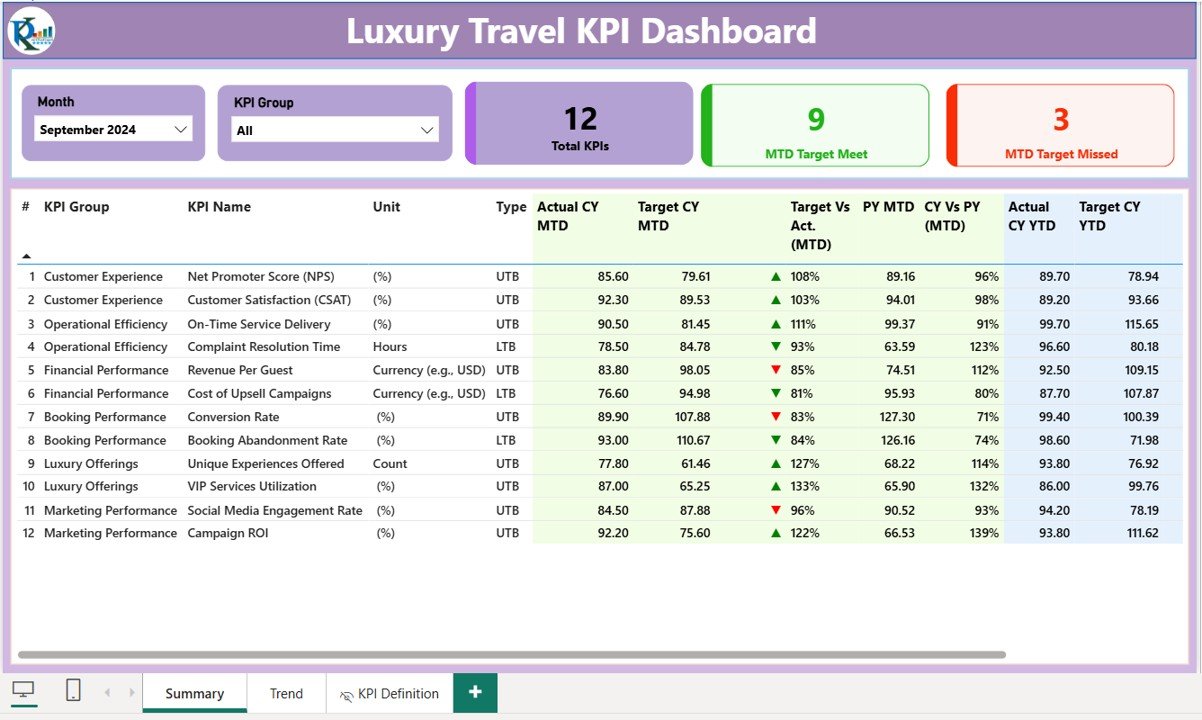
A Power BI KPI report tuned for high-end travel, where service quality matters as much as volume. The Summary page counts KPIs that met or missed target, the KPI Trend page charts MTD and YTD performance, and a drill-through page explains each KPI’s formula.
Who it is for: luxury travel agencies, concierge services, boutique resorts and yacht charter businesses.
- Month and KPI Group slicers with KPI cards for Total KPIs, Target Met and Missed.
- Tables showing MTD and YTD actuals vs targets and previous year, with green and red icons.
- KPI Definition drill-through with formula and description.
- Excel input sheets for actuals, targets and KPI definitions.
Concrete uses: track average spend per client and repeat-client rate against target; watch service-quality KPIs after a new supplier joins; and give a franchise partner a clear monthly KPI pack. Price: $11.99. See the Luxury Travel KPI Dashboard in Power BI →
Best for: premium travel brands that manage by service KPIs.
The travel agency KPIs every dashboard should show
Whichever travel agency dashboard template you choose, make sure your monthly report answers these questions. The formulas work in any spreadsheet once your bookings sit in one table.
| KPI | Formula | What to watch for |
|---|---|---|
| Average booking value | Booking revenue divided by confirmed bookings | Rising value with flat bookings means you are selling up, not selling more |
| Gross margin per booking | (Revenue minus supplier cost) divided by revenue | Compare by package and channel; supplier price rises hit margin before revenue |
| Lead conversion rate | Confirmed bookings divided by enquiries | Track by agent and source to find where enquiries are lost |
| Cancellation rate | Cancelled bookings divided by total bookings | Spikes often trace to one supplier, destination or campaign |
| Repeat booking rate | Customers with 2+ bookings divided by total customers | Cheaper growth than paid acquisition; watch it after service issues |
| Cost per booking | Sales and marketing cost divided by confirmed bookings | Read alongside average booking value, not on its own |
| Departure load factor (tour operators) | Seats sold divided by seat capacity per departure | Set a break-even load for each departure and act early when it lags |
The KPI dashboards in this guide include several of these out of the box, such as cancellation rate, cost per booking, average booking value and repeat booking rate. The Group Tour web app calculates load factor per departure automatically. If you sell packages under consumer protection rules, such as the UK ATOL scheme for flight-inclusive holidays, keep those obligations in your booking and accounting systems, not in a dashboard.
How to choose the right travel agency dashboard template
Match the template to two things: whether you need reporting or a full operating system, and the software your team already uses.
- Agency owner reporting in Excel: the Travel & Tourism Dashboard in Excel ($17.99).
- Several branches or home-based agents: the Google Sheets edition ($9.99).
- Tour operator running group departures: the Group Tour Coordination Management System ($39.99); cruise sellers can look at the Cruise Booking Management System Web App ($39.99).
- Managing by monthly targets: the Travel Agencies KPI Dashboard in Excel ($14.99) or the Power BI edition ($11.99).
- Board or owner wants one status page: the Travel & Tourism KPI Scorecard ($14.99), or the Travel and Tourism KPI Scorecard in Google Sheets ($9.99).
- Luxury or concierge travel: the Luxury Travel KPI Dashboard ($11.99).
Also worth a look: the Travel & Tourism KPI Dashboard in Excel ($12.99) and Travel & Tourism KPI Dashboard in Power BI ($11.99), the Adventure Tourism Dashboard in Excel for activity operators, and the low-cost Travel Itinerary Checklist in Excel ($3.49) for client trip planning. Agencies that also serve companies should see the Business Travel Services Dashboard in Excel and the Corporate Travel Booking Request Tracker in Google Sheets. If you run a property alongside the agency, our hotel and resort templates roundup covers occupancy and RevPAR in depth, and the 12 customer service KPIs guide and CRM in Excel guide help with enquiry follow-up.
When a travel template is NOT the right answer
A dashboard is a reporting layer, not a system of record. Be honest about where a travel agency dashboard template stops:
- You need live availability, reservations and ticketing. That is booking engine and GDS territory. Export from those systems into a dashboard; do not try to sell seats from a spreadsheet.
- You take online payments and hold client deposits. Payment processing, trust accounts and refunds belong in your payment gateway and accounting software.
- Many agents enter bookings at once with permissions and an audit trail. Google Sheets handles light collaboration; high-volume multi-user entry needs a database-backed system, such as the Group Tour web app or a commercial travel CRM.
- You need supplier connectivity or dynamic packaging. Live hotel, flight and transfer feeds require a commercial travel platform.
- You store passport and identity data. Keep personal documents in secured systems and use the dashboards only for booking-level numbers.
If none of those apply, and for reporting they usually do not, a template is the faster, cheaper and more flexible choice, and it keeps working if you change booking platform later.
Agencies in other sectors use the same approach: compare our agency dashboard templates for advertising and creative agencies for campaign ROAS, billable utilisation and client profitability.
Frequently asked questions
What is a travel agency dashboard template?
A travel agency dashboard template is a ready-made Excel, Google Sheets or Power BI file that turns booking, revenue, cost and customer records into KPI cards and charts. You replace the sample rows with your own bookings, and the template shows revenue, profit, bookings by channel, top packages and regional performance without building reports by hand.
Which KPIs should a travel agency track?
Track total bookings, booking revenue, average booking value, gross profit per booking, commission earned, lead conversion rate, cancellation rate, refund amount, repeat booking rate and customer satisfaction. Tour operators should add departure load factor and cost per traveller. The Travel Agencies KPI Dashboard templates already include most of these measures.
Is a dashboard template a replacement for travel agency software?
No. Booking engines, GDS tools and travel CRMs handle reservations, supplier inventory, payments and customer records. A dashboard template is a reporting layer that reads an export from those systems or from your own booking sheet, and it costs a one-time $9.99 to $17.99 instead of a monthly per-user subscription.
What is the best template for a tour operator running group departures?
The Group Tour Coordination Management System Web App is the only pick here built for operations rather than reporting. It manages packages, itineraries, departures with seat inventory, travellers, payments, rooming lists, suppliers and a visa desk, with 17 reports and six user roles, for a one-time $39.99.
Excel, Google Sheets or Power BI: which suits a travel agency best?
Choose Excel when one owner or manager prepares the monthly report, Google Sheets when agents in different branches need one live file in the browser, and Power BI when booking history runs to many thousands of rows or you present to investors or a board on screen. All three are one-time purchases.
How do I calculate average booking value and cancellation rate?
Average booking value is total booking revenue divided by the number of confirmed bookings. Cancellation rate is cancelled bookings divided by total bookings made in the same period, shown as a percentage. Track both by channel and package, because a single bad supplier or campaign can distort the agency-wide figure.
Can these templates track agent commissions?
Yes, in two ways. The Travel Agencies KPI Dashboards include a Commission Earned measure against target and previous year, and the Google Sheets Travel and Tourism Dashboard compares revenue and cost by agent. For payouts, keep the commission calculation in your accounting system and use the dashboard to monitor it.
Do I need macros, coding or a Power BI Pro licence?
No. The Excel dashboards use formulas, pivot tables and slicers, the Google Sheets versions run in any browser, and both Power BI templates open in the free Power BI Desktop app. You only need a paid Power BI licence to publish the report online and share it with colleagues who do not have the file.
Can I use these templates for a hotel or a corporate travel team?
Partly. The Travel & Tourism KPI Scorecard and the Google Sheets KPI dashboard include hospitality measures such as occupancy and revenue per room, but a hotel is better served by a dedicated hotel template. Corporate travel managers should look at the Business Travel Services Dashboard and the travel request trackers.
How long does setup take?
Most agencies are reporting within an afternoon. Export bookings with date, package, channel, region, agent, revenue and supplier cost, paste them into the Data sheet using the same column headings, refresh, then check the Total Revenue card against a figure you trust from your accounting system before sharing it.
Get more travel agency and tour operator templates
Ready to see bookings, revenue and profit on one page? Start with our best overall travel agency dashboard template, the Travel & Tourism Dashboard in Excel ($17.99), or the best-value Google Sheets edition ($9.99). Tour operators should try the live demo of the Group Tour Coordination Management System ($39.99). Every option is a one-time purchase with no subscription and no per-user fee.
Compare formats more widely with our Power BI dashboard templates ranked by industry, the premium Power BI templates under $20, the shareable Google Sheets templates for teams and the 25 best-selling business templates. Subscribe to the NextGenTemplates YouTube channel for setup tutorials.