

The best hotel management dashboard Excel template for most properties in 2026 is the Hotel and Hospitality Revenue Dashboard in Excel ($17.99): five pages cover revenue, guests, properties and booking trends from one data sheet. Hotels that need to run bookings, not just report on them, should pick the $39.99 Hotel Booking Management System web app.
Last updated: September 2026
Key takeaways
- Our top pick is the Hotel and Hospitality Revenue Dashboard in Excel ($17.99): Overview, Revenue Breakdown, Guest Analysis, Property Performance and Booking Trends pages, with no VBA or macros.
- The Web App Based Hotel Booking Management System ($39.99) is the only operational pick. It has 21 screens, 4 user roles, a booking calendar, Gantt timeline, housekeeping and 14 KPI cards including ADR and RevPAR.
- Resort groups comparing several properties should look at the Hospitality & Resorts Dashboard: $13.99 in Excel, or $17.99 in Power BI.
- All eight templates cost $6.99 to $39.99 once. Hotel property-management software is sold as a monthly subscription per property.
- Three picks are KPI trackers (Excel, Power BI and Google Sheets) that compare month-to-date and year-to-date results with targets. The Google Sheets booking dashboard is the best value at $6.99.
Hotel and resort templates compared
| Template | Format | Best For | Price |
|---|---|---|---|
| Hotel and Hospitality Revenue Dashboard (Best overall) | Excel | Revenue, guest and property reporting in one file | $17.99 |
| Web App Based: Hotel Booking Management System | Google Sheets web app | Running bookings, front desk and housekeeping | $39.99 |
| Hospitality & Resorts Dashboard | Excel | Profit by department, resort and room type | $13.99 |
| Hospitality & Resorts Dashboard | Power BI | Multi-resort chains that want drill-down | $17.99 |
| Hotel and Hospitality Revenue Dashboard | HTML (browser) | Hotels with no Excel or Power BI licence | $12.99 |
| Hospitality & Resorts KPI Dashboard | Excel | Monthly MTD/YTD target vs actual reviews | $12.99 |
| Hospitality & Resorts KPI Dashboard | Power BI | KPI reviews with drill-through definitions | $11.99 |
| Hospitality & Guest Booking Performance Dashboard (Best value) | Google Sheets | Small hotels, homestays and guesthouses sharing by link | $6.99 |
Hotels and resorts have a reporting problem few other businesses share: the product expires every night. A room left empty on Tuesday can never be sold again, so managers need to know occupancy, average daily rate and revenue per available room every week, not at quarter-end. The data behind those numbers is spread across the property-management system, the channel manager, OTA extranets, the restaurant till and the spa booking sheet. Most general managers end each month copying exports into a spreadsheet by hand.
The software answer is a cloud hotel property-management system (PMS) such as Cloudbeds, Mews, Little Hotelier or RoomRaccoon. They are capable platforms, but they are sold as subscriptions, typically quoted per property per month and often scaled by room count. Prices are commonly quoted from around $80 to $300 a month for a small property, so check each vendor’s current pricing. A hotel management dashboard Excel template bought once for $12.99–$17.99 will not replace a PMS. It does replace the manual month-end reporting on top of the PMS, and the web app in this list can run bookings on its own for a small property.
How we picked these
We searched the full NextGenTemplates catalog for products built for hotels, resorts, guesthouses and hospitality groups. We kept the eight that model how a property actually runs: bookings, room revenue, occupancy, departments, properties, guest satisfaction and monthly KPIs. Hotel calendars and general event trackers were left out because they plan the year rather than measure the property.
Every pick has a live product page, a one-time price and a documented list of pages or worksheets. The ranking weighs depth of analysis first, then fit for a specific job in the hotel, then price. Where the same design exists in several formats, each format gets its own entry because it suits a different kind of property.
The 8 best hotel and resort templates for 2026
1. Hotel and Hospitality Revenue Dashboard in Excel: best hotel management dashboard Excel template overall
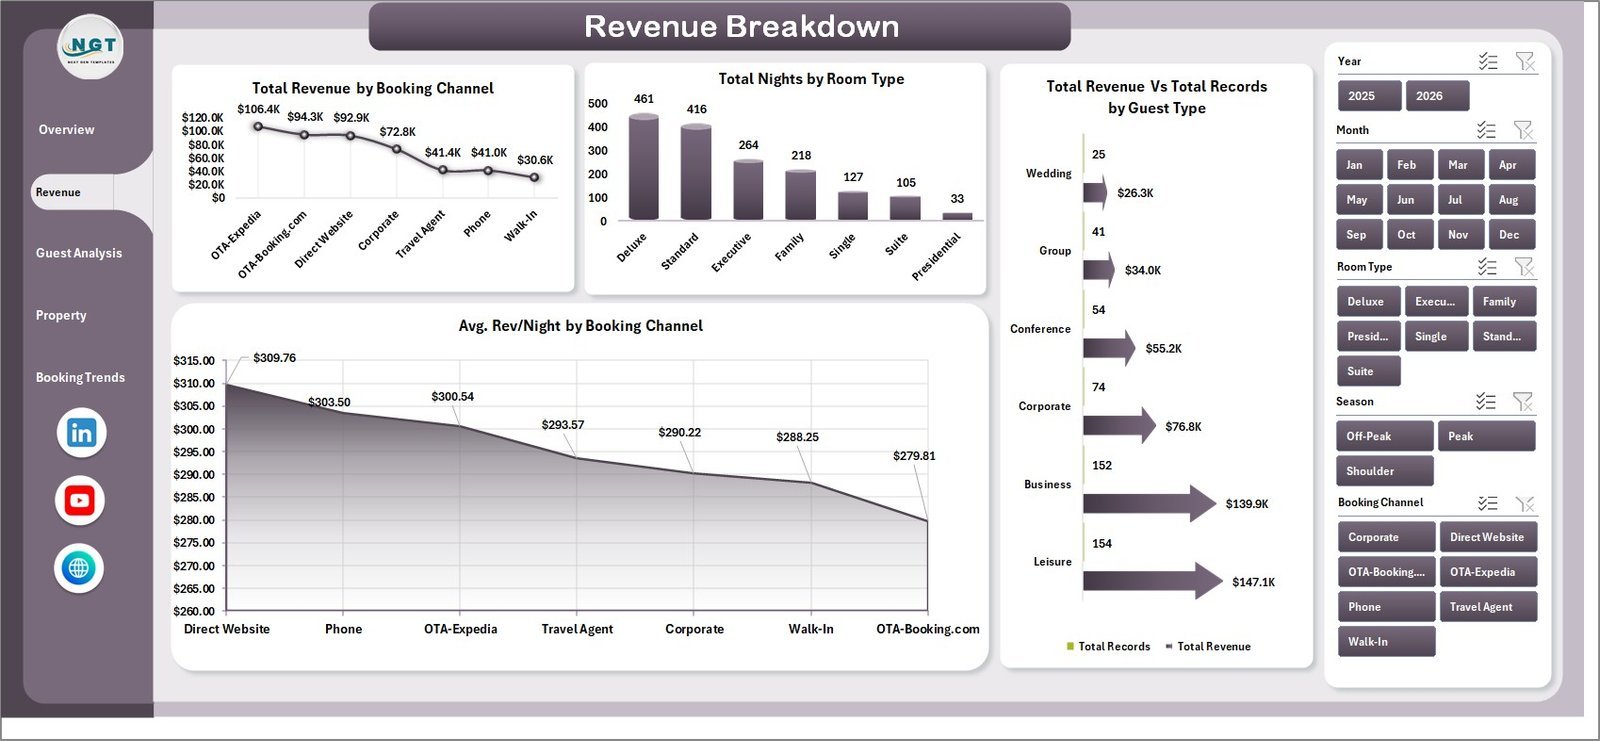
This is the hotel management dashboard Excel template we would hand a general manager first. It answers the questions owners ask every month: how much did we earn, where did it come from, which property and room type performed best, and are guests happy. One data sheet feeds five analysis pages through pivot tables, and Refresh All updates every chart and KPI.
Who it is for: general managers, revenue analysts and owners of independent hotels or small groups who already work in Microsoft Excel.
What is inside:
- Five pages: Overview, Revenue Breakdown, Guest Analysis, Property Performance and Booking Trends, plus a data sheet and a support sheet of pivots
- KPI cards for Total Revenue, Total Room Revenue, Total Records, Total Nights and Avg. Satisfaction
- Revenue by room type, booking channel, guest type and property
- Check-outs vs cancellations, yearly revenue and channel performance over time
- Slicers for property, room type, booking channel, season and loyalty tier; formula and pivot based, no VBA, Excel 2016 or later
Concrete uses: find which booking channel brings the most room revenue before renewing an OTA contract; compare satisfaction by loyalty tier to see whether repeat guests are treated better; see whether a summer revenue jump came from room rates or from F&B; and track cancellations month by month after changing your deposit policy.
Price: $17.99. Buy the Hotel and Hospitality Revenue Dashboard in Excel.
Best for: one-file revenue, guest and property reporting for a hotel or small group.
2. Web App Based: Hotel Booking Management System: best for running daily operations
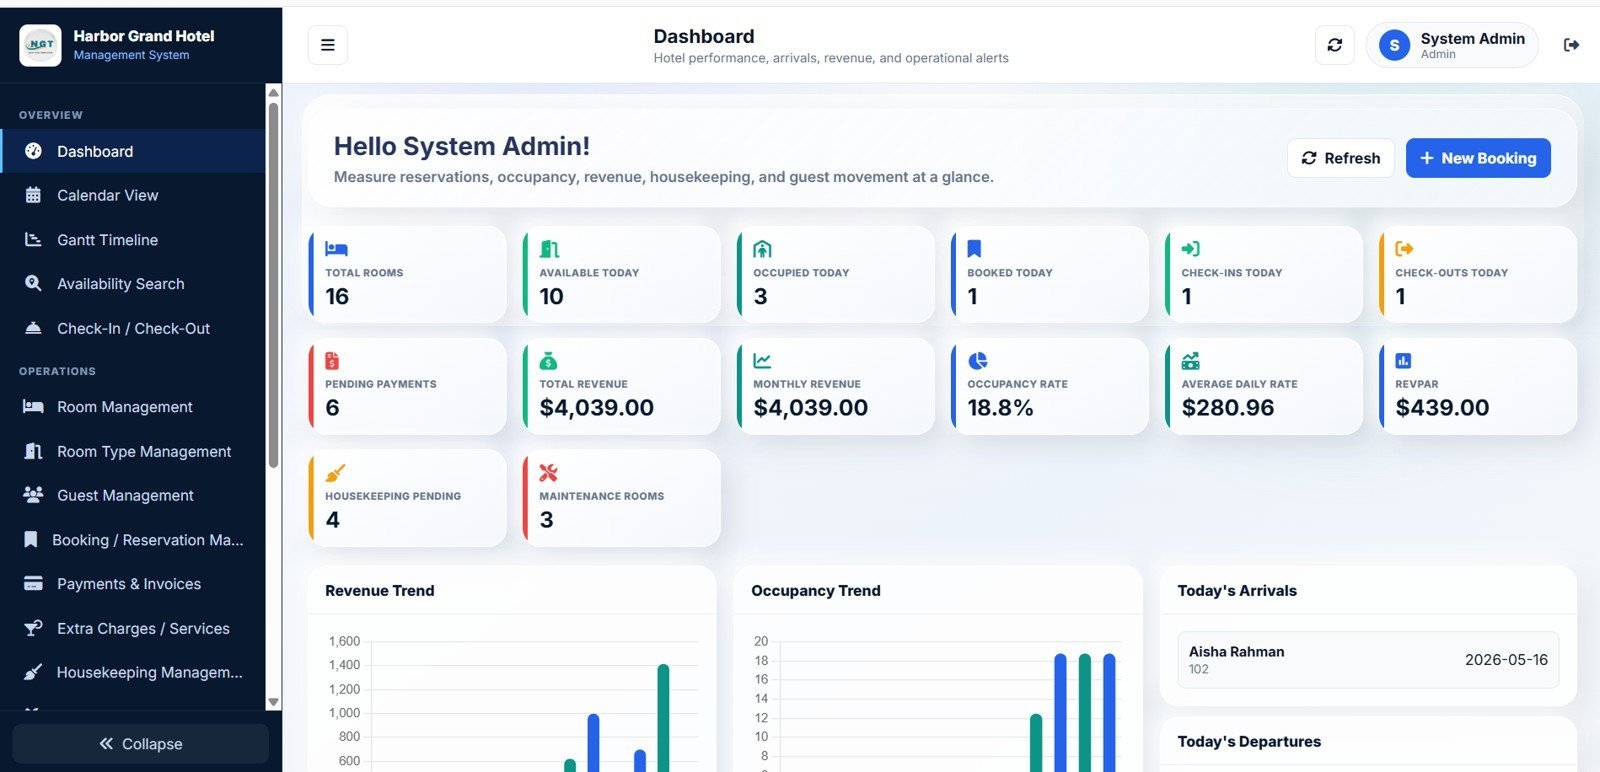
Every other pick in this list reports on data you already have. This one creates it. It is a Google Sheets and Apps Script web app that your team logs into through a browser. Every booking, payment and guest record is stored in a Google Sheet you own. It deploys to your own Google account in under 15 minutes with no server, hosting or per-user fee.
Who it is for: boutique hotels, guesthouses, B&Bs and small multi-property owners who manage bookings in a notebook or a basic spreadsheet today.
What is inside:
- 21 connected screens including login, dashboards, calendar, Gantt timeline, availability search, check-in/check-out, payments, invoices, reports and settings
- 4 roles with role-based access: Admin, Manager, Receptionist (Front Desk) and Housekeeper
- 14 KPI cards including Occupancy Rate, Average Daily Rate, RevPAR, Pending Payments, Check-Ins Today and Housekeeping Pending
- Rates by room type for weekday, weekend, holiday and extra person, with seasonal date ranges
- Guest records with nationality, VIP and blacklist flags and ID upload, plus housekeeping and maintenance modules
Concrete uses: quote a walk-in guest from the availability search; spot back-to-back stays and gaps on the Gantt timeline; chase unpaid balances from the Pending Payments chart; and assign rooms to housekeepers each morning. A live demo with test logins for every role is on the product page.
Price: $39.99. Get the Hotel Booking Management System web app.
Best for: small properties that want a booking system they own instead of a monthly PMS bill.
3. Hospitality & Resorts Dashboard in Excel: best for profit by department and resort
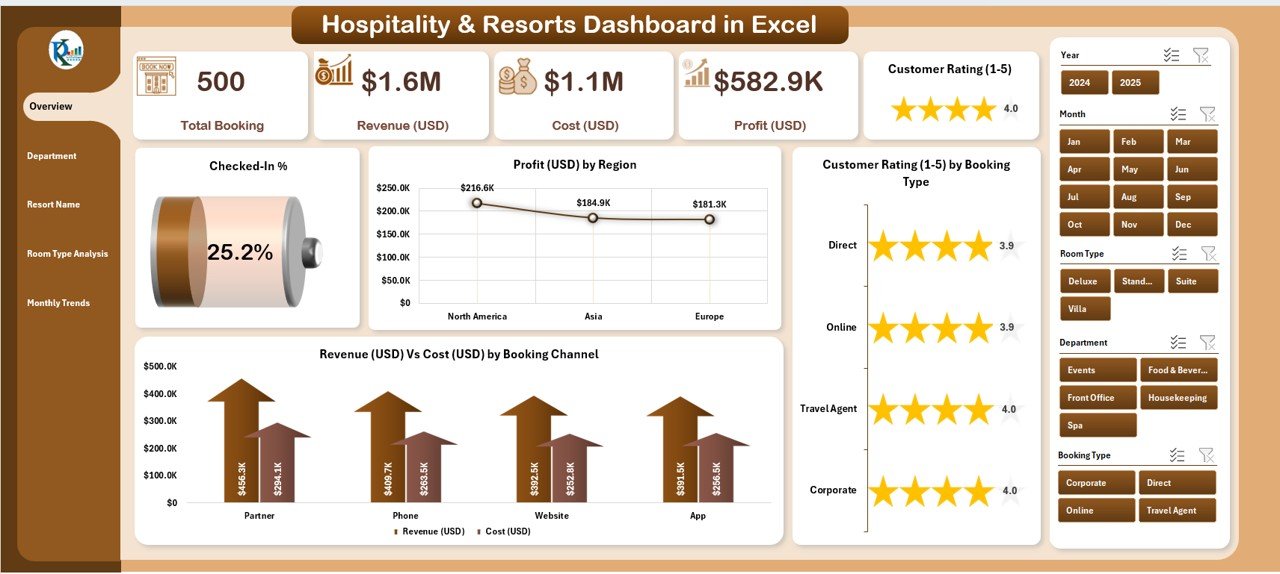
Pick #1 follows revenue. This one follows profit. It pairs revenue with cost for every department, resort and room type, so you can see which parts of the property make money and which only look busy.
Who it is for: resort owners, finance teams and department heads at properties with a restaurant, spa or activities alongside rooms.
What is inside:
- Five pages: Overview, Department Analysis, Resort Analysis, Room Type Analysis and Monthly Trends
- KPI cards for Guests, Revenue, Profit, Check-In % and Rating Average
- Revenue vs cost and profit charts by department, resort, room type and month
- Booked % and customer rating by room type
- Filters for month, region and booking type, with support and data sheets for your own records
Concrete uses: find the department whose cost is eating its revenue; compare profit per resort before deciding where to invest in renovation; check whether suites earn more profit than standard rooms after cost; and watch check-in % by month to size seasonal staffing.
Price: $13.99. Buy the Hospitality & Resorts Dashboard in Excel.
Best for: resorts that need profit, not just revenue, by department and property.
Not sure which to buy? For hotel revenue reporting, the Hotel and Hospitality Revenue Dashboard in Excel is $17.99. To run bookings and the front desk, choose the Hotel Booking Management System at $39.99. For resort profit by department, the Hospitality & Resorts Dashboard in Excel is $13.99.
4. Hospitality & Resorts Dashboard in Power BI: best for multi-resort chains
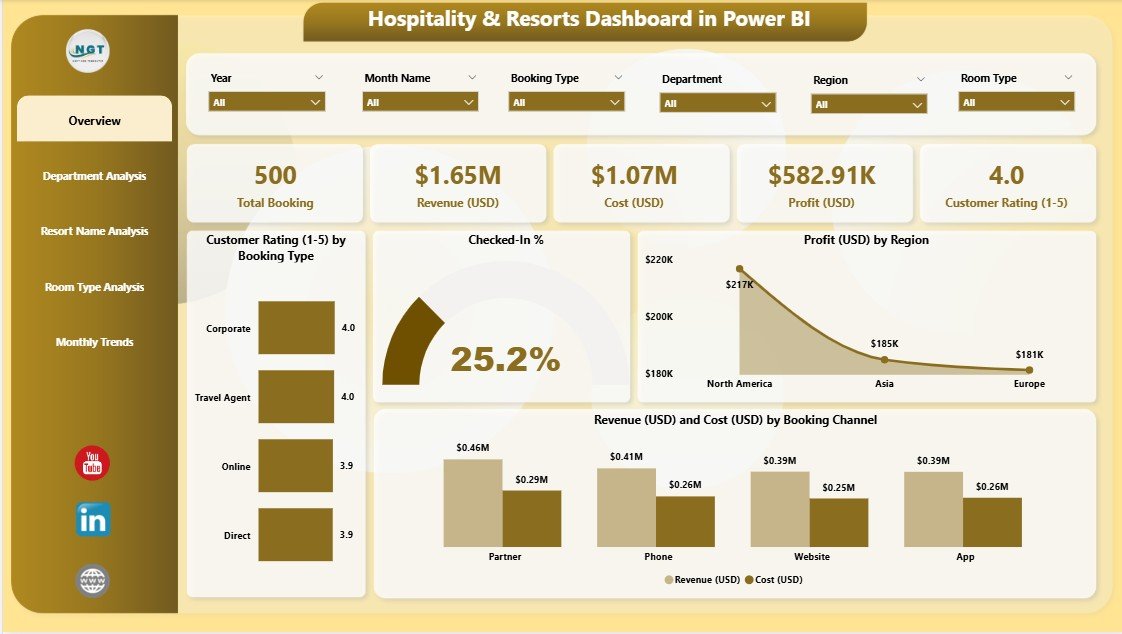
The same five-page design as pick #3, rebuilt in Power BI. It suits resort groups on Microsoft 365 that want managers to open the report on a phone, drill into a single resort, or publish one report for every property to Power BI Service.
Who it is for: hospitality groups with several resorts, regional managers and owners who review performance away from the property.
What is inside:
- Five pages: Overview, Department, Resort Name, Room Type and Monthly Trends
- Headline figures for total bookings, revenue, cost, profit and customer rating
- Profit by region and resort, revenue vs cost by resort and room type
- Customer rating (1–10) by room type, department and resort
- Slicers for region, resort, booking channel and month, with drill-down on visuals
Concrete uses: rank resorts by profit, not just revenue, at the monthly group meeting; compare customer rating by department across sites to find the weakest team; check profit by month and resort to plan promotions for the low season; and give each resort manager the same report.
Price: $17.99. Get the Hospitality & Resorts Dashboard in Power BI.
Best for: Power BI groups that want interactive drill-down across resorts.
5. Hotel and Hospitality Revenue Dashboard in HTML: best with no software to install
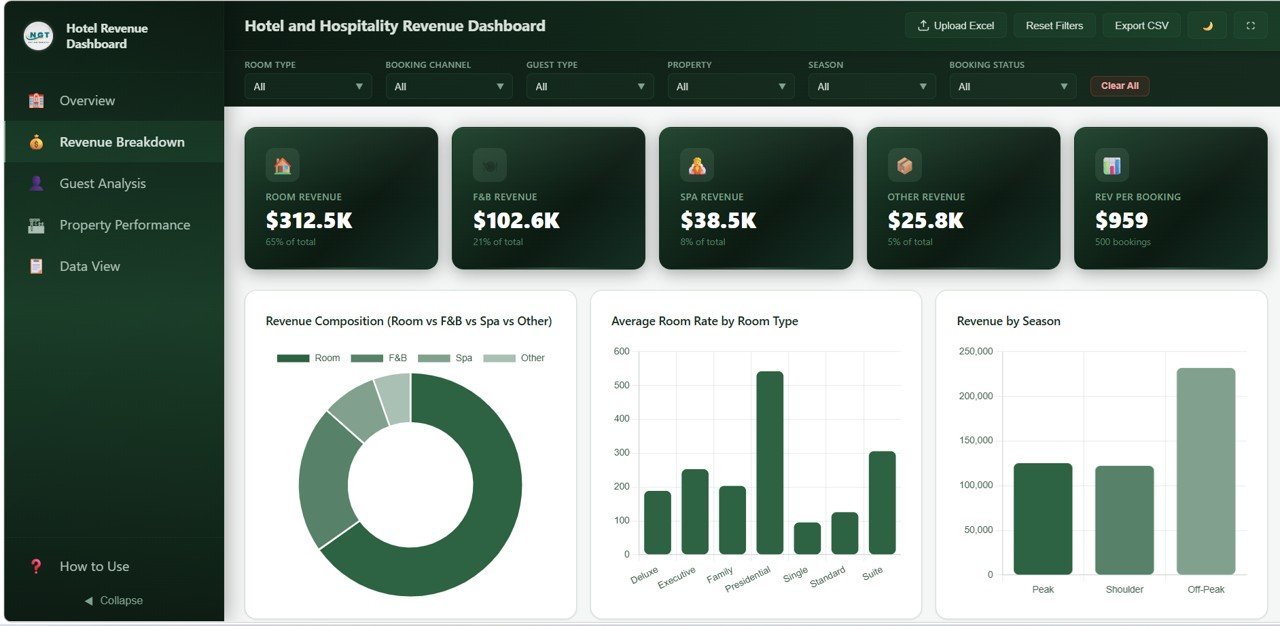
The browser edition of pick #1. It is a single dashboard that opens in Chrome, Edge, Firefox or Safari with no Excel, Power BI or Google account. That makes it the easiest choice for a property whose front-office computers do not carry Microsoft Office.
Who it is for: small hotels, guesthouses and owners who want a dashboard on a tablet or the office intranet.
What is inside:
- Five pages: Overview, Revenue Breakdown, Guest Analysis, Property Performance and Data View
- Six KPI cards: Total Revenue, Total Bookings, Avg Room Rate, Avg Nights Stayed, Avg Satisfaction and Occupancy Rate
- Revenue split into Room, F&B, Spa and Other, by property, room type, season and guest type
- Cancellation rates, booking channels and monthly trends by property
- A Data View with search, sort, pagination and CSV export
Concrete uses: see what share of revenue comes from F&B and spa rather than rooms; compare cancellation rates by booking channel; export a filtered list of loyalty guests for a return-visit offer; and check occupancy on a tablet during the morning briefing.
Price: $12.99. Buy the Hotel and Hospitality Revenue Dashboard in HTML.
Best for: properties that want a polished dashboard without Excel or Power BI.
6. Hospitality & Resorts KPI Dashboard in Excel: best for monthly target reviews

Picks #1 to #5 analyse booking-level records. This one is a KPI tracker: you enter monthly actuals, targets and last year’s figures for each KPI, choose a month, and the dashboard compares month-to-date and year-to-date results with arrows showing whether each KPI is on target.
Who it is for: general managers and owners who run a monthly performance meeting against a budget.
What is inside:
- Seven sheets: Summary, Dashboard, Trend, Actual Numbers, Target, Previous Year and KPI Definition
- MTD and YTD actual vs target vs previous year for each KPI
- KPI groups for occupancy, revenue, F&B and customer satisfaction
- A definition sheet recording each KPI’s formula, unit and whether higher or lower is better
- A month selector that updates every chart
Concrete uses: set an occupancy target for each month and see the YTD gap; compare this October with last October so seasonality is not mistaken for decline; follow RevPAR after a rate change; and give owners the same one-page view every month.
Price: $12.99. Buy the Hospitality & Resorts KPI Dashboard in Excel.
Best for: hotels that manage to a monthly budget rather than a booking log.
7. Hospitality & Resorts KPI Dashboard in Power BI: best KPI tracker for Microsoft 365 teams

The Power BI version of pick #6. You keep typing numbers into an Excel file, and Power BI turns them into an interactive report with slicers by month and KPI group, trend charts and a drill-through page explaining each KPI.
Who it is for: hotel and resort management teams already using Power BI, and MIS analysts who prepare the monthly pack for leadership.
What is inside:
- A summary page with MTD and YTD actual vs target and previous year, with status icons
- A KPI Trend page with two combo charts for MTD and YTD
- A drill-through KPI Definition page showing formula, definition and type (upper or lower is better)
- An Excel data file with Input Actuals, Input Targets and KPI Definitions sheets
Concrete uses: filter to the F&B KPI group before the F&B manager’s review; drill through to a KPI definition so every department calculates it the same way; spot seasonal patterns on the trend page; and publish one report for the leadership team.
Price: $11.99. Get the Hospitality & Resorts KPI Dashboard in Power BI.
Best for: KPI reviews in Power BI with shared definitions across departments.
8. Hospitality & Guest Booking Performance Dashboard in Google Sheets: best value
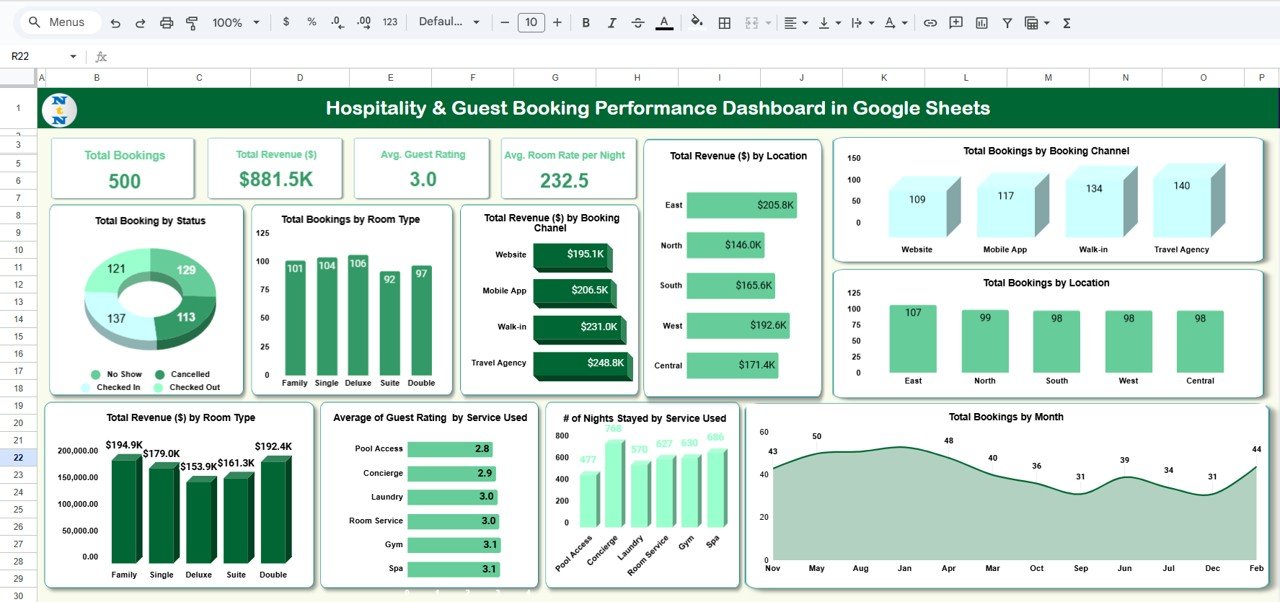
The cheapest pick in the list, and a solid one. It lives in Google Drive, so the owner, the front office and the accountant can all open the same live file by link, with no installation and no emailed workbooks.
Who it is for: homestays, guesthouses, small hotels and owners who run the business from Google Workspace.
What is inside:
- Dashboard, Search, Data and Support tabs
- KPI cards for Total Bookings, Total Revenue and Avg. Guest Rating
- Revenue and bookings by booking channel (website, mobile app, travel agency, direct), location and month
- Nights stayed and guest rating by service used, such as spa, gym or room service, plus revenue by room type
- A search tab to filter bookings by status, location, room type or service
Concrete uses: compare direct bookings with travel-agency bookings to see how much commission you could save; list all checked-in guests from the search tab; find which service earns the best guest rating; and let a part-time bookkeeper see revenue by link.
Price: $6.99. Get the Hospitality & Guest Booking Performance Dashboard in Google Sheets.
Best for: small properties that want booking analytics for the price of a coffee.
Which hotel KPIs should you track?
Whichever template you choose, a handful of numbers explain most of a property’s performance. These definitions follow the standard industry usage popularised by hotel benchmarking firms such as STR (CoStar). Targets vary by market, star rating and season, so compare yourself with your own last year and your competitive set.
| KPI | Formula | What to watch |
|---|---|---|
| Occupancy rate | Rooms sold ÷ rooms available | Track by day of week, not only by month |
| ADR (average daily rate) | Room revenue ÷ rooms sold | Rising ADR with falling occupancy may mean overpricing |
| RevPAR | Room revenue ÷ rooms available (or ADR × occupancy) | The single best headline number for room performance |
| TRevPAR | Total revenue (rooms, F&B, spa, other) ÷ rooms available | Essential for resorts with large non-room income |
| GOPPAR | Gross operating profit ÷ rooms available | Shows whether revenue growth is profitable |
| Cancellation rate | Cancelled bookings ÷ total bookings | Compare by booking channel |
| Guest satisfaction | Average review or survey score | Track by department and room type |
A worked example: a 60-room hotel has 1,800 room-nights available in a 30-day month. If it sells 1,260, occupancy is 70%. If those nights earn $151,200 of room revenue, ADR is $120 and RevPAR is $84. Raising ADR to $126 at the same occupancy adds $7,560 a month, as much as selling 63 extra nights. That is why revenue managers watch RevPAR rather than occupancy alone.
The same logic of revenue per available unit applies in restaurants; see our guide to 12 restaurant KPIs including prime cost and RevPASH if your hotel runs a restaurant. For repeat-guest numbers, our explainer on churn and retention metrics shows how to calculate return rates properly.
How to choose a hotel management dashboard Excel template (or another format)
Use this quick decision path:
- You want one hotel management dashboard Excel file for revenue reporting: Hotel and Hospitality Revenue Dashboard in Excel ($17.99).
- You need to take bookings, check guests in and assign housekeeping: Hotel Booking Management System web app ($39.99).
- You run a resort and need profit by department: Hospitality & Resorts Dashboard in Excel ($13.99), or Power BI ($17.99) for several resorts.
- Your computers have no Excel or Power BI: Hotel and Hospitality Revenue Dashboard in HTML ($12.99).
- You manage against a monthly budget: Hospitality & Resorts KPI Dashboard in Excel ($12.99) or Power BI ($11.99).
- You are a small guesthouse on Google Workspace: Hospitality & Guest Booking Performance Dashboard in Google Sheets ($6.99).
A sensible pairing is one booking-level dashboard (picks #1 to #5) for operational detail plus one KPI tracker (picks #6 to #8) for the monthly meeting. Buying the same design in two formats can also make sense; our explainer on when to buy Excel, Google Sheets and Power BI together covers that decision. If you also sell trips and packages, our travel agency dashboard template roundup ranks eight tools for agencies and tour operators. Before you pay, our buying guide on how to evaluate an Excel dashboard template lists the checks that matter.
Template vs hotel software: what does it cost over five years?
Subscription pricing adds up. At an assumed $150 a month for one property, a cloud PMS costs $1,800 a year and $9,000 over five years; at $300 a month it is $18,000. The Hotel and Hospitality Revenue Dashboard in Excel plus the KPI Dashboard in Excel costs $30.98 once. Adding the booking web app brings the full set to $70.97, still less than a single month of many subscriptions.
That does not make a PMS a bad buy. You are paying for channel-manager connections, online booking engines, payment processing and support. It means you should buy software for those functions and own your reporting. Our breakdown of what to buy and what to template in a small business software stack walks through the same logic, and how much a business dashboard template should cost shows where these prices sit in the market.
When a template is NOT the right answer
A template is the wrong buy in four situations. First, you need a channel manager that syncs availability with Booking.com, Expedia and Airbnb in real time to prevent overbooking. Second, you want an online booking engine that takes card payments on your website. Third, you run many properties with dozens of staff entering data at the same moment. Fourth, you need integrations with door locks, POS systems or accounting software.
In each of those cases, buy hotel software and use a template only for reporting on its export. For everything else, a $6.99–$39.99 template does the job a monthly subscription is oversized for. That covers a single hotel, resort or guesthouse tracking revenue, occupancy, departments, guests and monthly KPIs. Other service businesses face the same choice; see our best gym and fitness studio templates, the 6 best veterinary clinic templates, and our roundup of healthcare and hospital management templates.
Frequently asked questions
What is a hotel management dashboard in Excel?
A hotel management dashboard in Excel is a pre-built workbook that turns booking and revenue records into charts and KPIs. You paste data from your property-management system into a data sheet, click Refresh All, and pages show revenue, occupancy, room types, booking channels, properties and guest satisfaction without building formulas yourself.
Can I manage a small hotel in Google Sheets or Excel?
Yes, for a small property. The Hotel Booking Management System runs bookings, check-ins, payments and housekeeping on Google Sheets with a web app front end. Larger hotels that need a channel manager and online payments should keep a PMS and use Excel or Power BI templates for reporting.
What KPIs should a hotel track?
Track occupancy rate, ADR, RevPAR, TRevPAR, GOPPAR, cancellation rate, booking channel mix and guest satisfaction. RevPAR is the best single headline number because it combines price and occupancy. Resorts with restaurants and spas should add TRevPAR, which includes non-room revenue.
How do you calculate RevPAR?
Divide room revenue by rooms available for the period, or multiply ADR by occupancy rate. For example, a 60-room hotel with 1,800 room-nights available in a month and $151,200 of room revenue has a RevPAR of $84. At 70% occupancy, that equals an ADR of $120.
Is there a free alternative to hotel property management software?
No free tool fully replaces a PMS with channel manager and booking engine. A one-time template replaces the reporting, and the $39.99 Hotel Booking Management System covers bookings for small properties. The eight templates here cost $6.99 to $39.99 once, with no monthly fee.
Excel, Google Sheets, Power BI or HTML: which format should a hotel choose?
Choose the tool your team already uses. Excel suits a general manager who wants one self-contained file. Google Sheets suits properties sharing files by link. Power BI suits multi-resort groups wanting drill-down and mobile viewing. The HTML dashboard suits properties with no Office licence, because it opens in any browser.
Can these templates compare several hotels or resorts?
Yes. The Hotel and Hospitality Revenue Dashboards in Excel and HTML include a Property Performance page. The Hospitality & Resorts Dashboards in Excel and Power BI include a Resort Analysis page with profit and rating by resort. The booking web app also supports multiple properties from one Google Sheet.
How much do these hotel templates cost?
The eight ranked templates cost between $6.99 and $39.99 each as one-time purchases, with no subscription or per-user fees. Most analysis dashboards are $11.99 to $17.99, the Google Sheets booking dashboard is $6.99, and the full booking management web app is $39.99.
Do I need technical skills to use these templates?
No advanced skills are needed. For the Excel dashboards you paste records and click Refresh All; for the KPI trackers you type monthly numbers into labelled sheets. The Power BI files open in free Power BI Desktop, and the web app includes a step-by-step deployment guide for your Google account.
Get more hotel and resort templates
Ready to stop building month-end hotel reports by hand? The Hotel and Hospitality Revenue Dashboard in Excel ($17.99) is the hotel management dashboard Excel pick for revenue reporting. The Hospitality & Resorts KPI Dashboard in Excel ($12.99) runs your monthly target review. Together they cost $30.98, less than one month of most hotel software.
See our dashboards in action on the YouTube channel, @NextGenTemplates. You can also browse our cheap Excel dashboard templates under $15, premium Power BI templates under $20, or Google Sheets templates for teams.