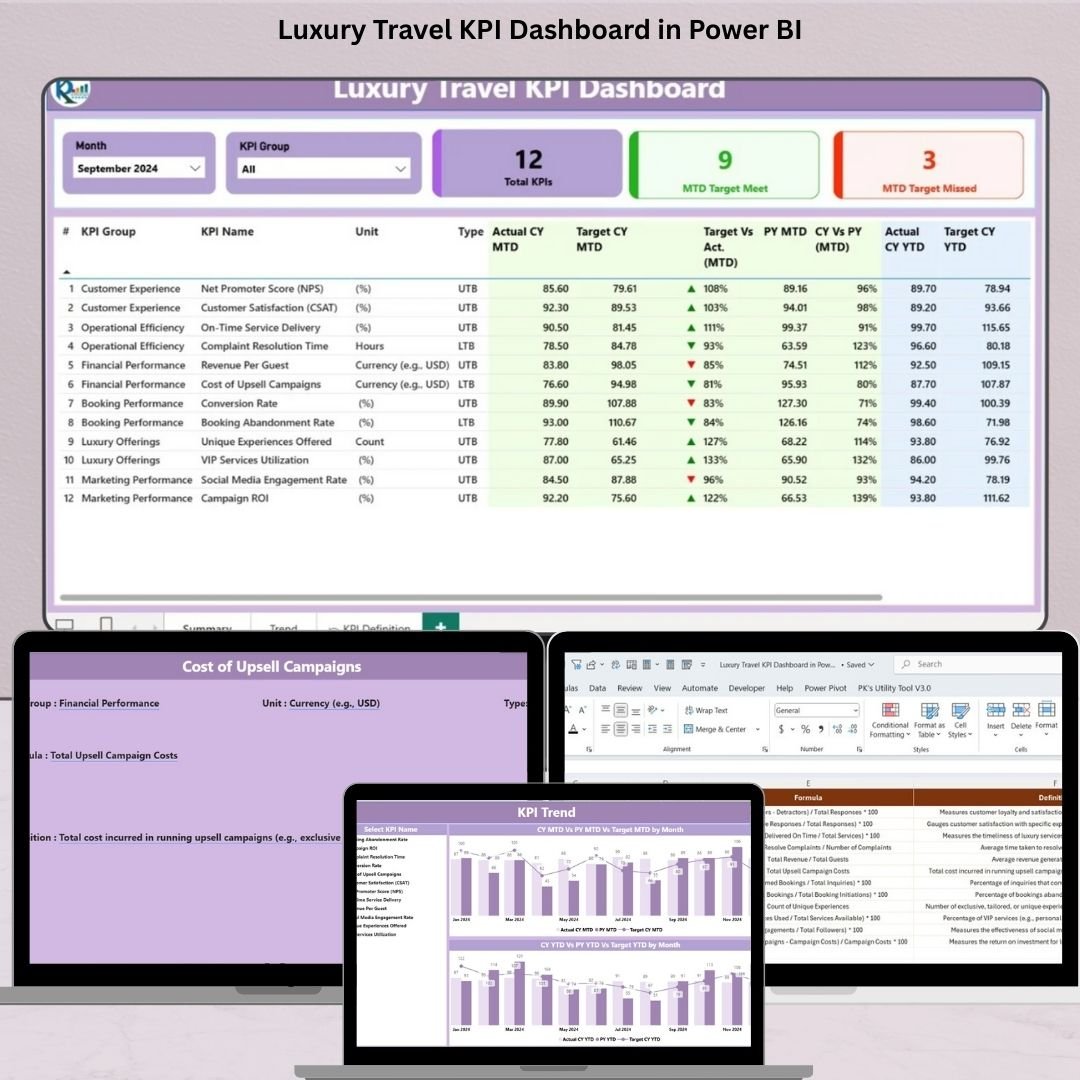
Managing a luxury travel brand means delivering exceptional service—every time. But behind each unforgettable stay, there’s data. The Luxury Travel KPI Dashboard in Power BI is your plug-and-play solution for tracking what truly matters: performance, service excellence, and strategic growth.
Whether you’re running a boutique resort, yacht charter, or global concierge network, this dashboard helps you monitor KPIs, spot trends, and hit your goals—with no coding or complex setup required.
✨ Key Features of the Luxury Travel KPI Dashboard
📊 Summary Page – Your Performance Command Center
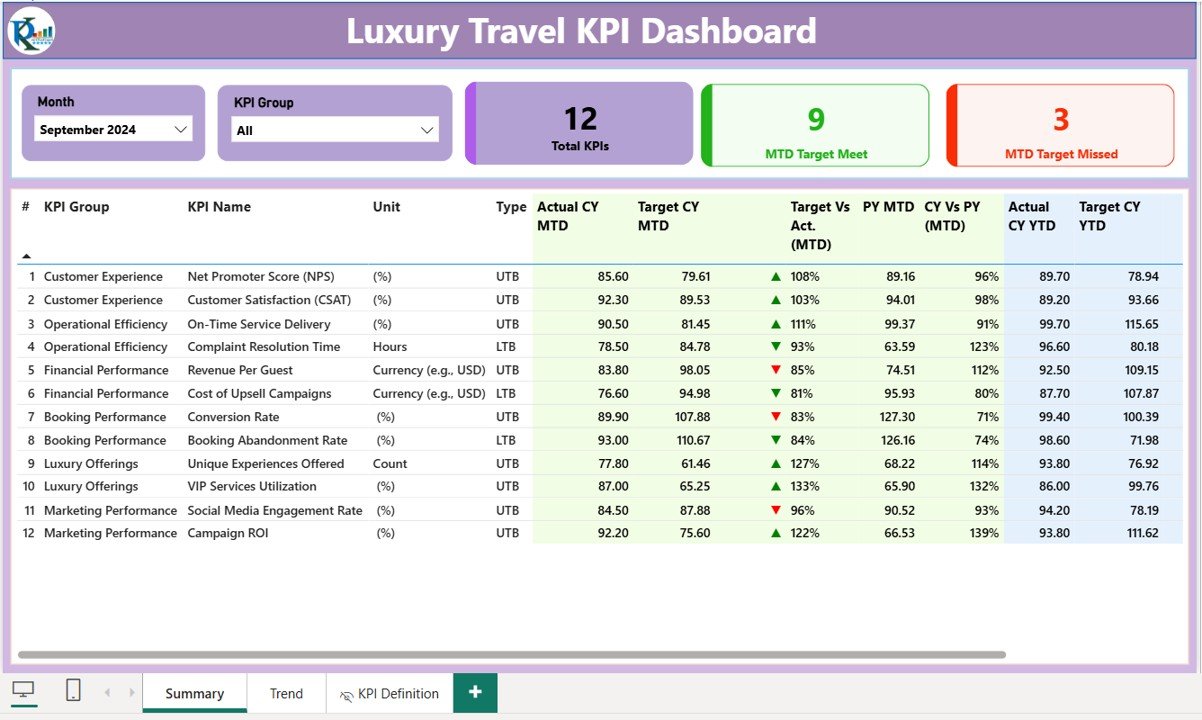
Track live business performance with:
-
Month & KPI Group slicers for quick filtering
-
KPI Cards for Total KPIs, Target Met, and Missed
-
Real-time data tables showing:
-
KPI Group, KPI Name, Unit, Type (UTB/LTB)
-
MTD and YTD Actuals vs Targets
-
Green/Red ▲▼ icons showing performance trends
-
% comparisons to Target and Previous Year
-
Drill-through enabled to view KPI definitions
-
This snapshot helps you make fast, informed decisions.
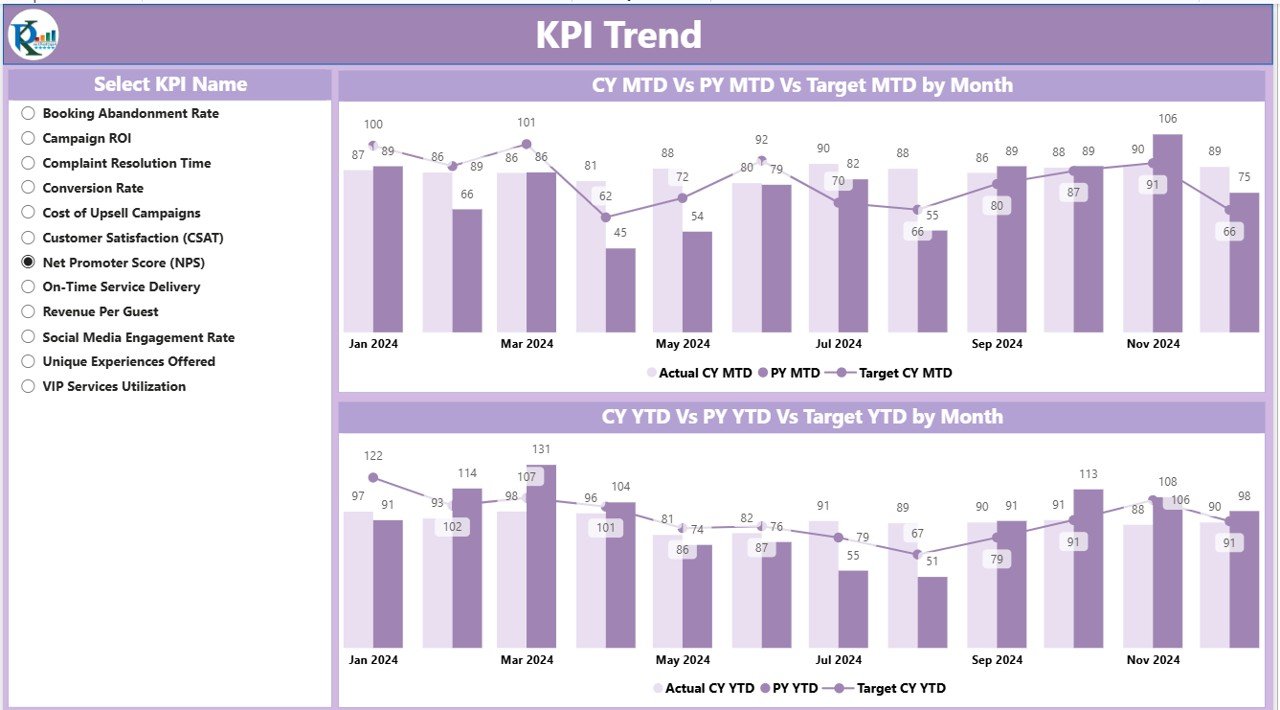
📈 KPI Trend Page – Uncover What the Numbers Say
Visualize growth or concerns using:
-
MTD Trend Chart: Compare Actuals, Targets, and Previous Year
-
YTD Trend Chart: Detect year-long patterns in performance
-
KPI Name slicer: Drill into specific KPIs and track progress over time
Perfect for monthly reviews and stakeholder meetings.
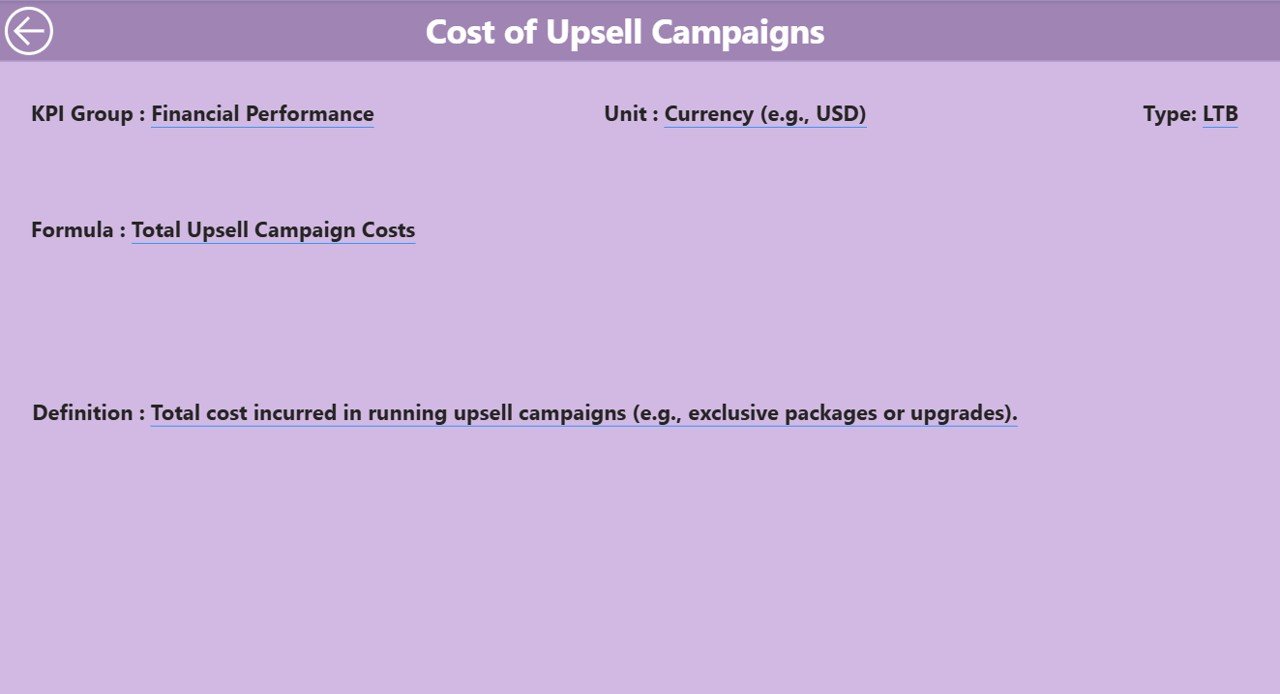
📘 KPI Definition Page – Understand the Why Behind the Numbers
Right-click on any KPI in the Summary to drill into:
-
KPI Formula
-
KPI Description
Click “Back” to return—simple, clean, and insightful for all team levels.
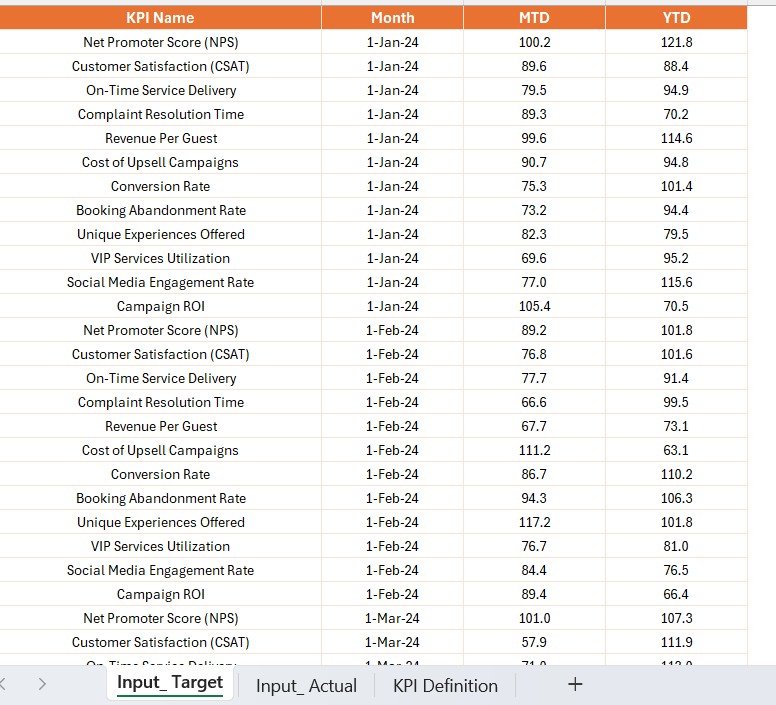
📥 Powered by Excel – Easy Data Management
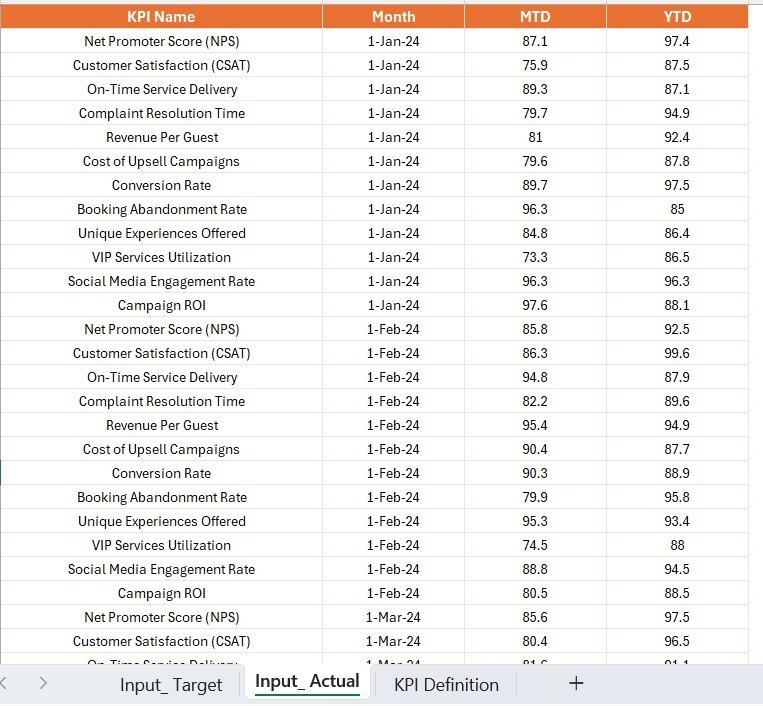
✅ Input Actual Sheet
-
KPI Name
-
First day of the month
-
Actual MTD and YTD performance
✅ Input Target Sheet
-
Month
-
KPI-specific MTD and YTD Targets
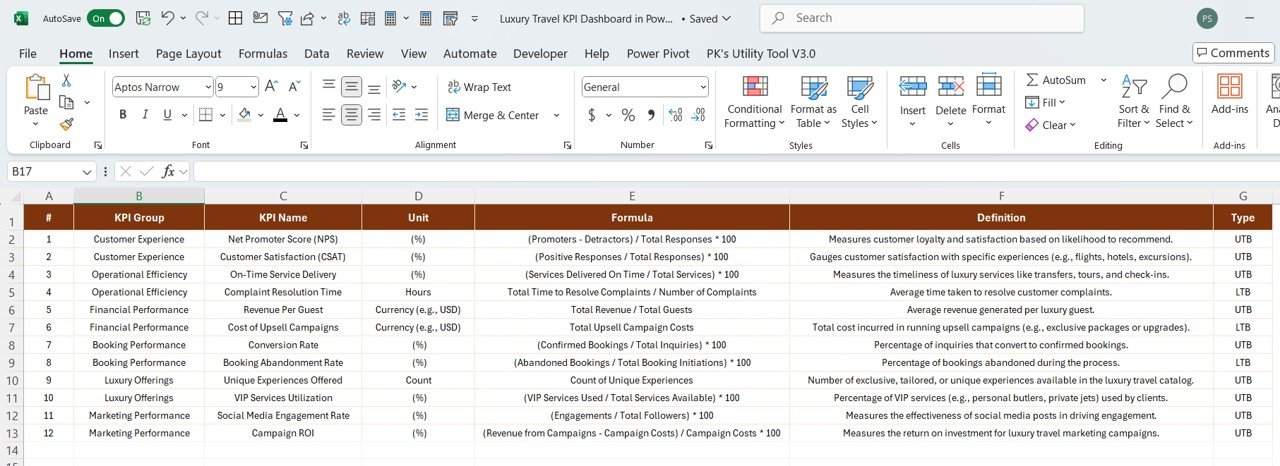
✅ KPI Definition Sheet
-
KPI Group, Name, Unit, Formula
-
Definition
-
Type: UTB (Upper the Better) or LTB (Lower the Better)
Just update your Excel sheet monthly, refresh Power BI, and you’re done.
🌟 Advantages of Using This Dashboard
📌 Instant Visibility – Live view of MTD & YTD performance
📈 Trend Detection – Track progress or identify slumps early
🔍 Client Experience KPIs – Focus on metrics that elevate luxury standards
✅ No Coding Required – Modify KPIs via Excel only
🧠 Strategic Alignment – Tie metrics directly to your luxury service goals
🕒 Time-Saving Setup – Quick onboarding for any team
🛠 Best Practices for Use
🔄 Update Excel Monthly – Stay current for accurate reporting
📉 Watch for Red Flags – Use icons to spot declining KPIs
📊 Use Drill-Through Wisely – Get full KPI definitions before acting
🗓️ Set Clear Review Cycles – Use weekly or monthly trend reviews
🎯 Align KPIs to Impact – Focus only on what drives experience and revenue
👥 Who Should Use This Dashboard?
✅ Operations Managers – Monitor performance across locations
✅ Sales & Marketing Teams – Align guest experience with revenue goals
✅ Travel Planners & Advisors – Track booking-to-satisfaction journey
✅ Strategy Teams – Align KPIs with long-term objectives
✅ Luxury Resort Directors & GMs – Visualize what’s working and what’s not
No matter your luxury travel niche, this dashboard adapts seamlessly to your workflows.
📘 Click here to read the Detailed blog post
🎥 Visit our YouTube channel to learn step-by-step video tutorials


Reviews
There are no reviews yet.