

The best agency dashboard template for most advertising and creative agencies in 2026 is the Creative Agencies Dashboard in Excel ($17.99). It tracks revenue, gross profit, projects, billable hours and client ratings across five slicer-driven pages, with no per-user subscription. Seven more ranked picks cover campaign KPIs, Power BI, Google Sheets and full agency web apps.
Last updated: October 2026
Key takeaways
- Best overall agency dashboard template: the Creative Agencies Dashboard in Excel at $17.99, with 5 KPI cards, 5 analysis pages and 20+ chart views.
- Best value: the Advertising KPI Dashboard in Google Sheets at $9.99 for teams that report ad performance from a shared Google Sheet.
- Agencies that need workflow, not just reporting, should look at the Advertising Agency Campaign Management System ($39.99): 32 modules, 7 roles and 31 reports.
- All eight picks are one-time purchases from $9.99 to $39.99, against agency software that is usually billed monthly per user.
- Every advertising pick tracks CTR, CPC and ROAS; every creative-agency pick tracks revenue, profit and delivery.
Agency dashboard templates compared
| Template | Format | Best For | Price |
|---|---|---|---|
| Creative Agencies Dashboard | Excel (Power BI twin) | Best overall: agency revenue, profit and delivery | $17.99 |
| Advertising Agency Campaign Management System | Web app (Google Apps Script) | Media plans, insertion orders, approvals and billing | $39.99 |
| Creative Agencies KPI Dashboard | Excel | Monthly KPI review against target and last year | $14.99 |
| Graphic Design Agency Management System | Web app (Google Apps Script) | Design studios: briefs, revisions, timesheets | $39.99 |
| Advertising KPI Dashboard | Excel | Multi-channel ad KPIs, online and offline | $14.99 |
| Digital Advertising KPI Dashboard | Excel | Google, Meta and Instagram campaign reporting | $14.99 |
| Advertising KPI Dashboard | Power BI | Interactive client reporting at scale | $11.99 |
| Advertising KPI Dashboard | Google Sheets | Best value: shared, browser-based ad reporting | $9.99 |
How we picked these agency dashboard templates
We searched the NextGenTemplates catalogue for every paid product built for advertising agencies, creative agencies, design studios, ad campaigns and brand work, then read each product’s page and sheet list. Each pick had to cover at least one of the two jobs an agency actually reports on: the business (revenue, margin, utilisation, delivery) or the client’s campaigns (spend, CTR, CPC, ROAS).
We excluded calendars and single-purpose trackers, because they record activity without measuring it, and we excluded duplicates where an Excel and a Power BI edition are the same report. Where both editions exist, we name the twin inside the pick so you can choose the format.
Why do agencies need a dashboard in the first place?
Agency margin leaks quietly. A retainer client asks for a fourth revision round, a designer logs six unbilled hours, a media line under-delivers and nobody notices until the invoice is disputed. Each event is small; together they are the difference between a 40% and a 15% gross margin.
The usual fix is agency management software, but tools in this category are typically billed per user per month, so a ten-person team pays for them every month whether the reports get opened or not. An agency dashboard template gives you the same view of revenue, utilisation and campaign performance from data you already export, for a one-time price. If you also run your own marketing, our guide to 15 marketing KPIs to track in 2026 covers the growth side of the business.
The 8 best agency dashboard templates for 2026
1. Creative Agencies Dashboard in Excel: best overall
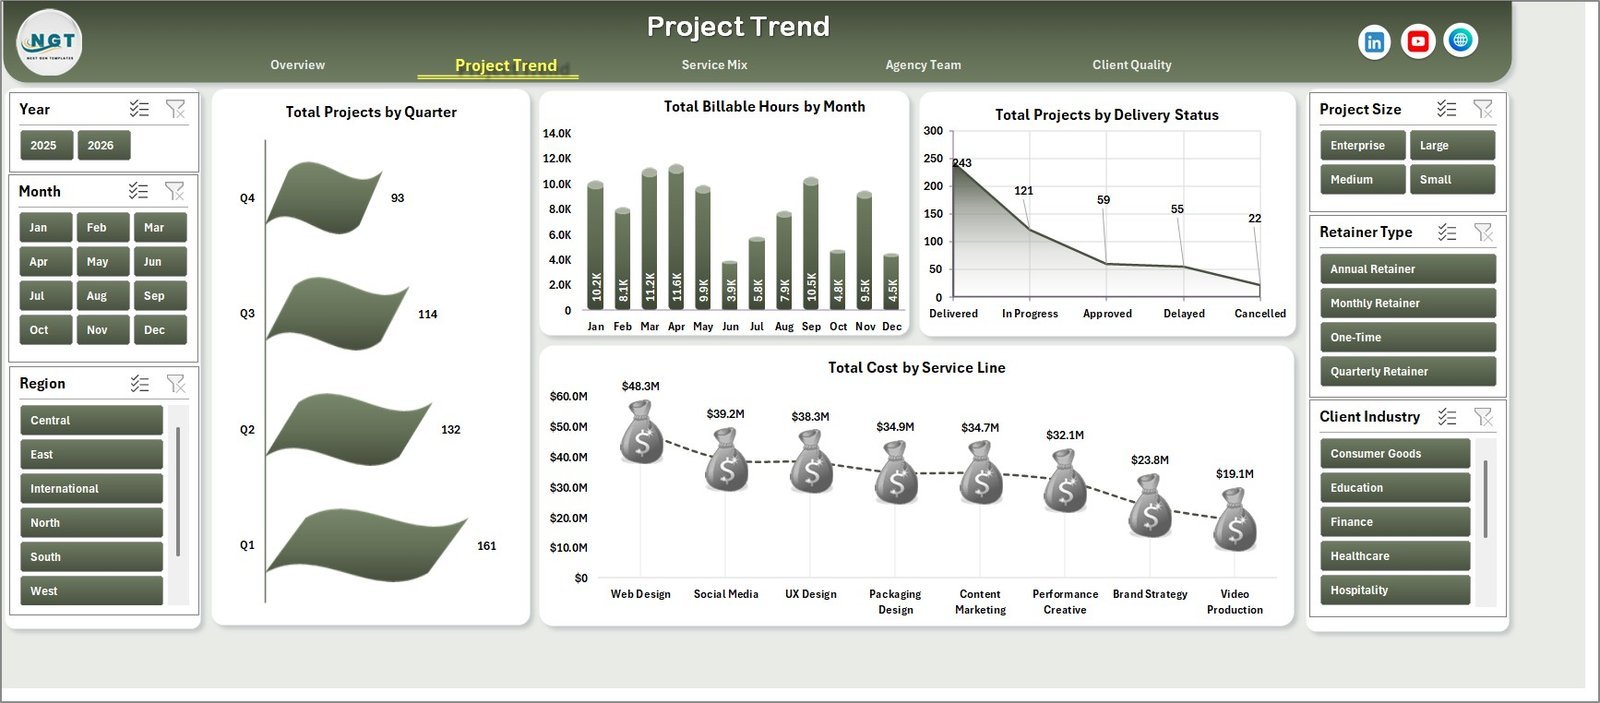
This is the most complete agency-business view in the list, which is why it ranks first. It is a 7-tab workbook with 5 executive KPI cards (Total Revenue, Gross Profit Value, Total Projects, Total Billable Hours and Avg. Client Rating), 5 analysis pages and a Data sheet you overwrite with your own records.
Who it is for: agency owners, account leads, operations managers and finance teams who want one Monday-morning report on how the agency itself is doing.
- Five pages: Overview, Project Trend, Service Mix, Agency Team and Client Quality.
- 20+ chart views covering revenue, cost, gross profit, billable hours, revisions, acquisition channels and delivery status.
- Slicers for year, month, service line, client industry, campaign type, region, retainer type and delivery status.
- A Support sheet of pivot tables that powers every chart, so no formulas need rebuilding.
Use it to see which service line earns the best gross profit per billable hour, whether monthly retainers or one-time projects carry more revisions, and which client industries rate you lowest. Prefer interactive reports? The Creative Agencies Dashboard in Power BI is the same model as a 5-page PBIX, also $17.99.
Price: $17.99, one-time. Get the Creative Agencies Dashboard in Excel
Best for: the agency that needs one honest picture of revenue, margin and delivery.
2. Advertising Agency Campaign Management System Web App: best full system
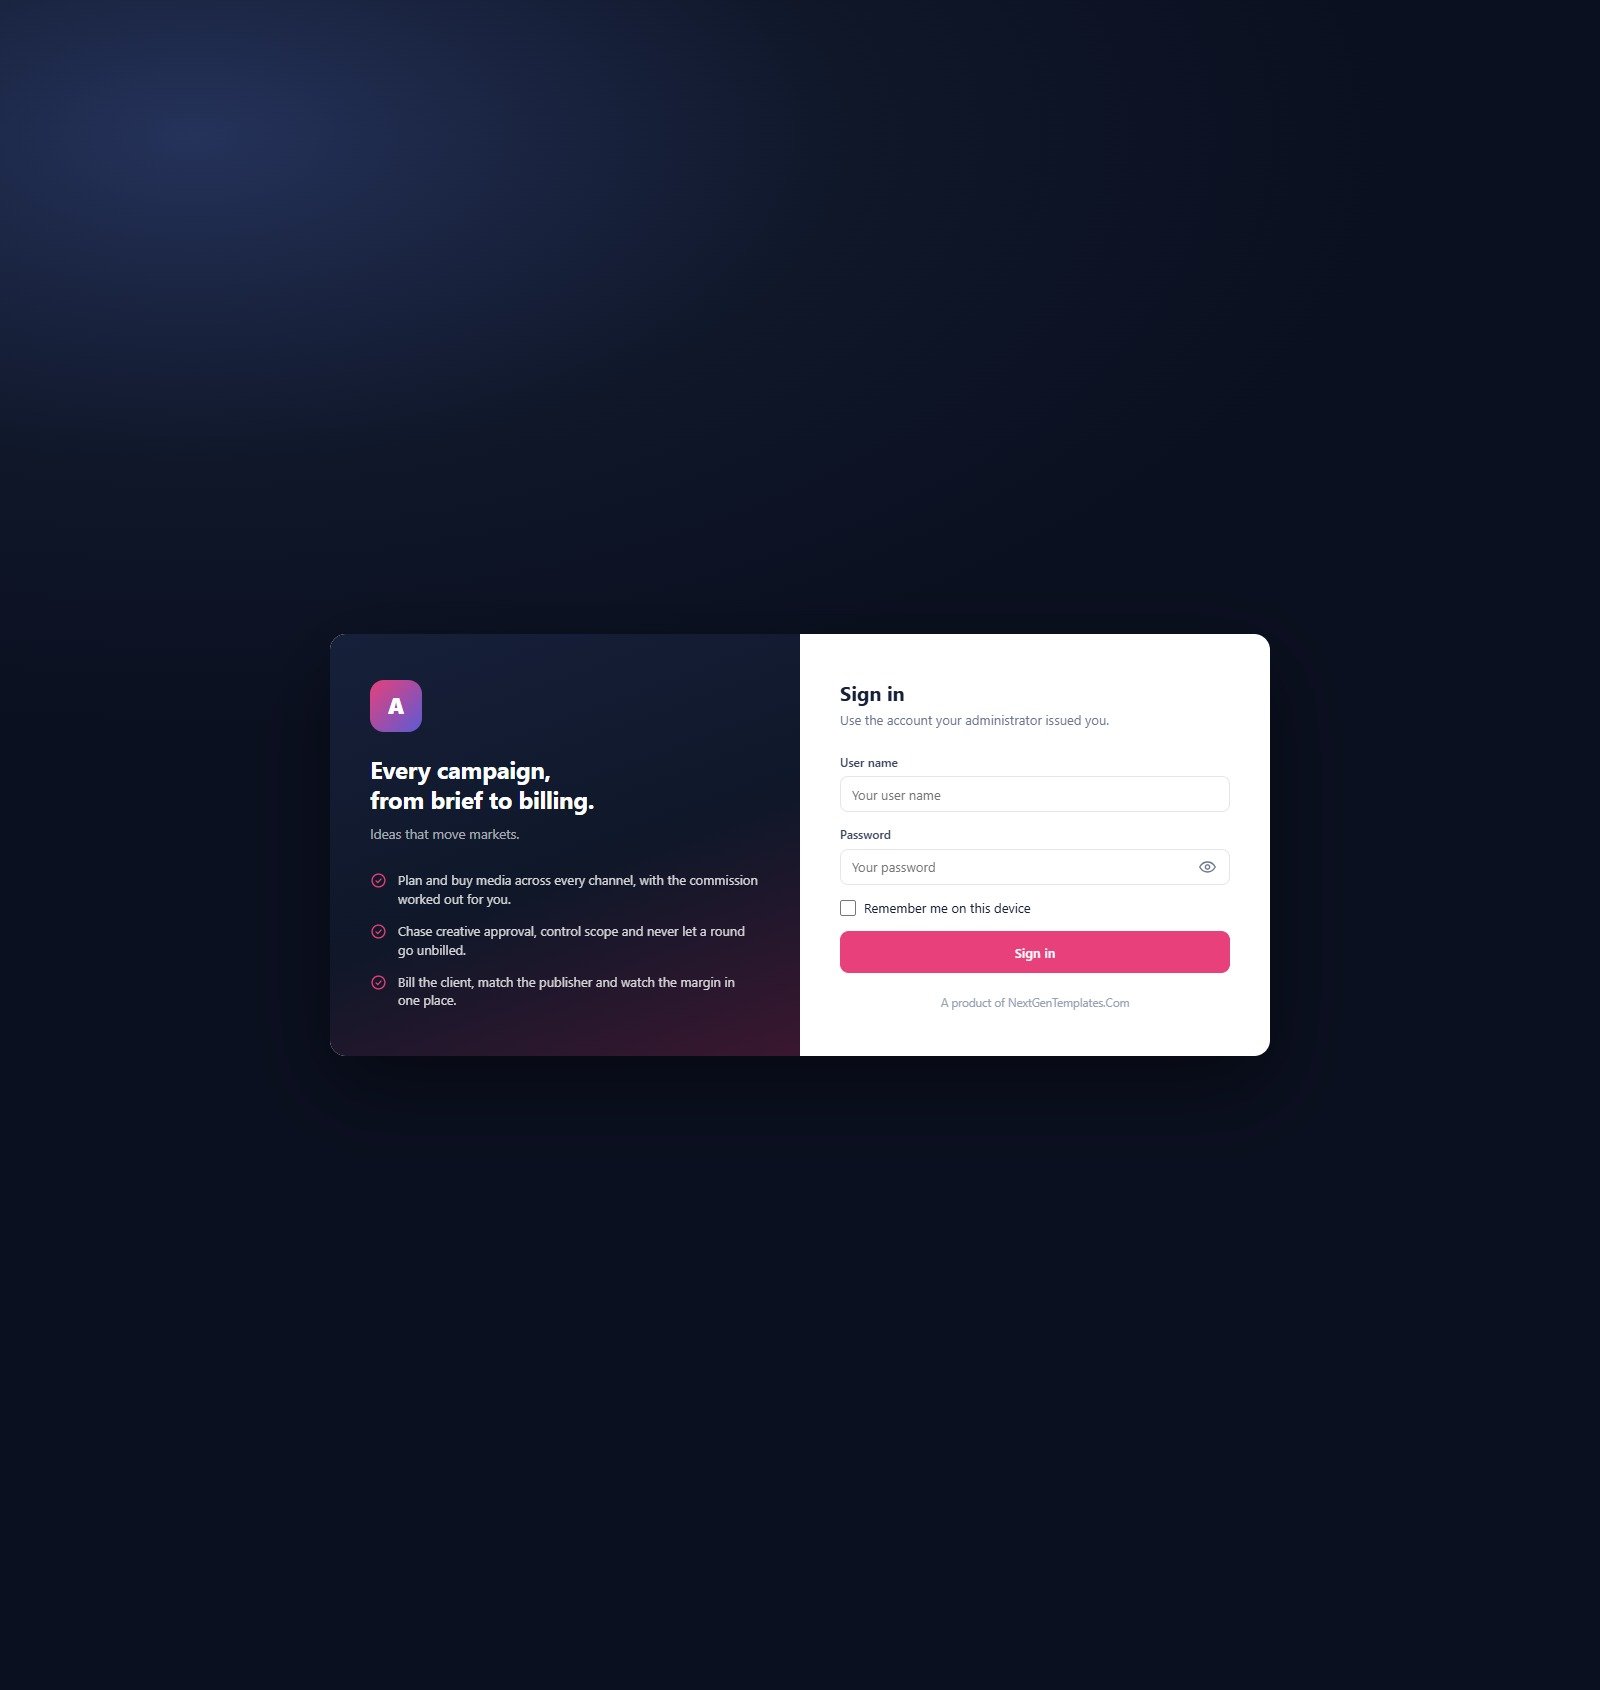
This is not just a report. It is a Google Apps Script application that runs the agency’s workflow on your own Google account: 32 modules, 7 role-based logins and 31 built-in reports. It ships with a seeded demo agency of 46 clients, 85 brands, 190 campaigns and about 1,500 media plan lines, so every screen is populated on first sign-in.
Who it is for: media and full-service advertising agencies whose plans, insertion orders, approvals and invoices currently live in five different places.
- Media plan lines with channel, vendor, placement, buy type, rate, commission and flight dates that convert into numbered insertion orders.
- Creative approvals logged by round, internal and client, with real turnaround times.
- Jobs & Tasks in Board, Table and Workload views across eight statuses.
- Seven roles with real separation: a Creative Lead has no money access, and an Account Manager cannot issue an insertion order or see cost rates.
The 31 reports include client profitability, campaign budget versus actual, pacing and delivery exceptions, retainer over-servicing and receivables ageing. There is a live demo on the product page.
Price: $39.99, one-time. See the Advertising Agency Campaign Management System
Best for: agencies ready to replace spreadsheets and email threads with one system.
3. Creative Agencies KPI Dashboard in Excel: best for monthly KPI reviews

Where pick #1 analyses raw project rows, this file works on monthly KPI totals. Choose a month from a dropdown and every KPI updates with month-to-date and year-to-date actuals, target and previous-year comparisons, and up/down arrows that flag under-performance.
Who it is for: agency leadership teams that run a monthly review and need agency KPIs against target, not just charts.
- Seven sheets: Summary, Dashboard, KPI Trend, Actual Numbers Input, Target, Previous Year Numbers and KPI Definition.
- Productivity, financial and delivery KPIs in one view.
- A KPI Definition sheet that documents each KPI’s unit and formula, which settles arguments about what “utilisation” means.
A practical use: set billable utilisation targets per month, then watch the KPI Trend chart for the quarter where it slips. Many agencies aim for roughly 70-80% billable utilisation on delivery staff; this sheet tells you whether you are anywhere near it.
Price: $14.99, one-time. Get the Creative Agencies KPI Dashboard
Best for: target-versus-actual agency KPIs in a monthly board pack.
Not sure which format fits? Start with the Creative Agencies Dashboard in Excel ($17.99) if you report on the agency itself, or the Advertising KPI Dashboard in Google Sheets ($9.99) if you report on clients’ ad campaigns. Both cost less than a single month of most per-seat agency software.
4. Graphic Design Agency Management System Web App: best for design studios
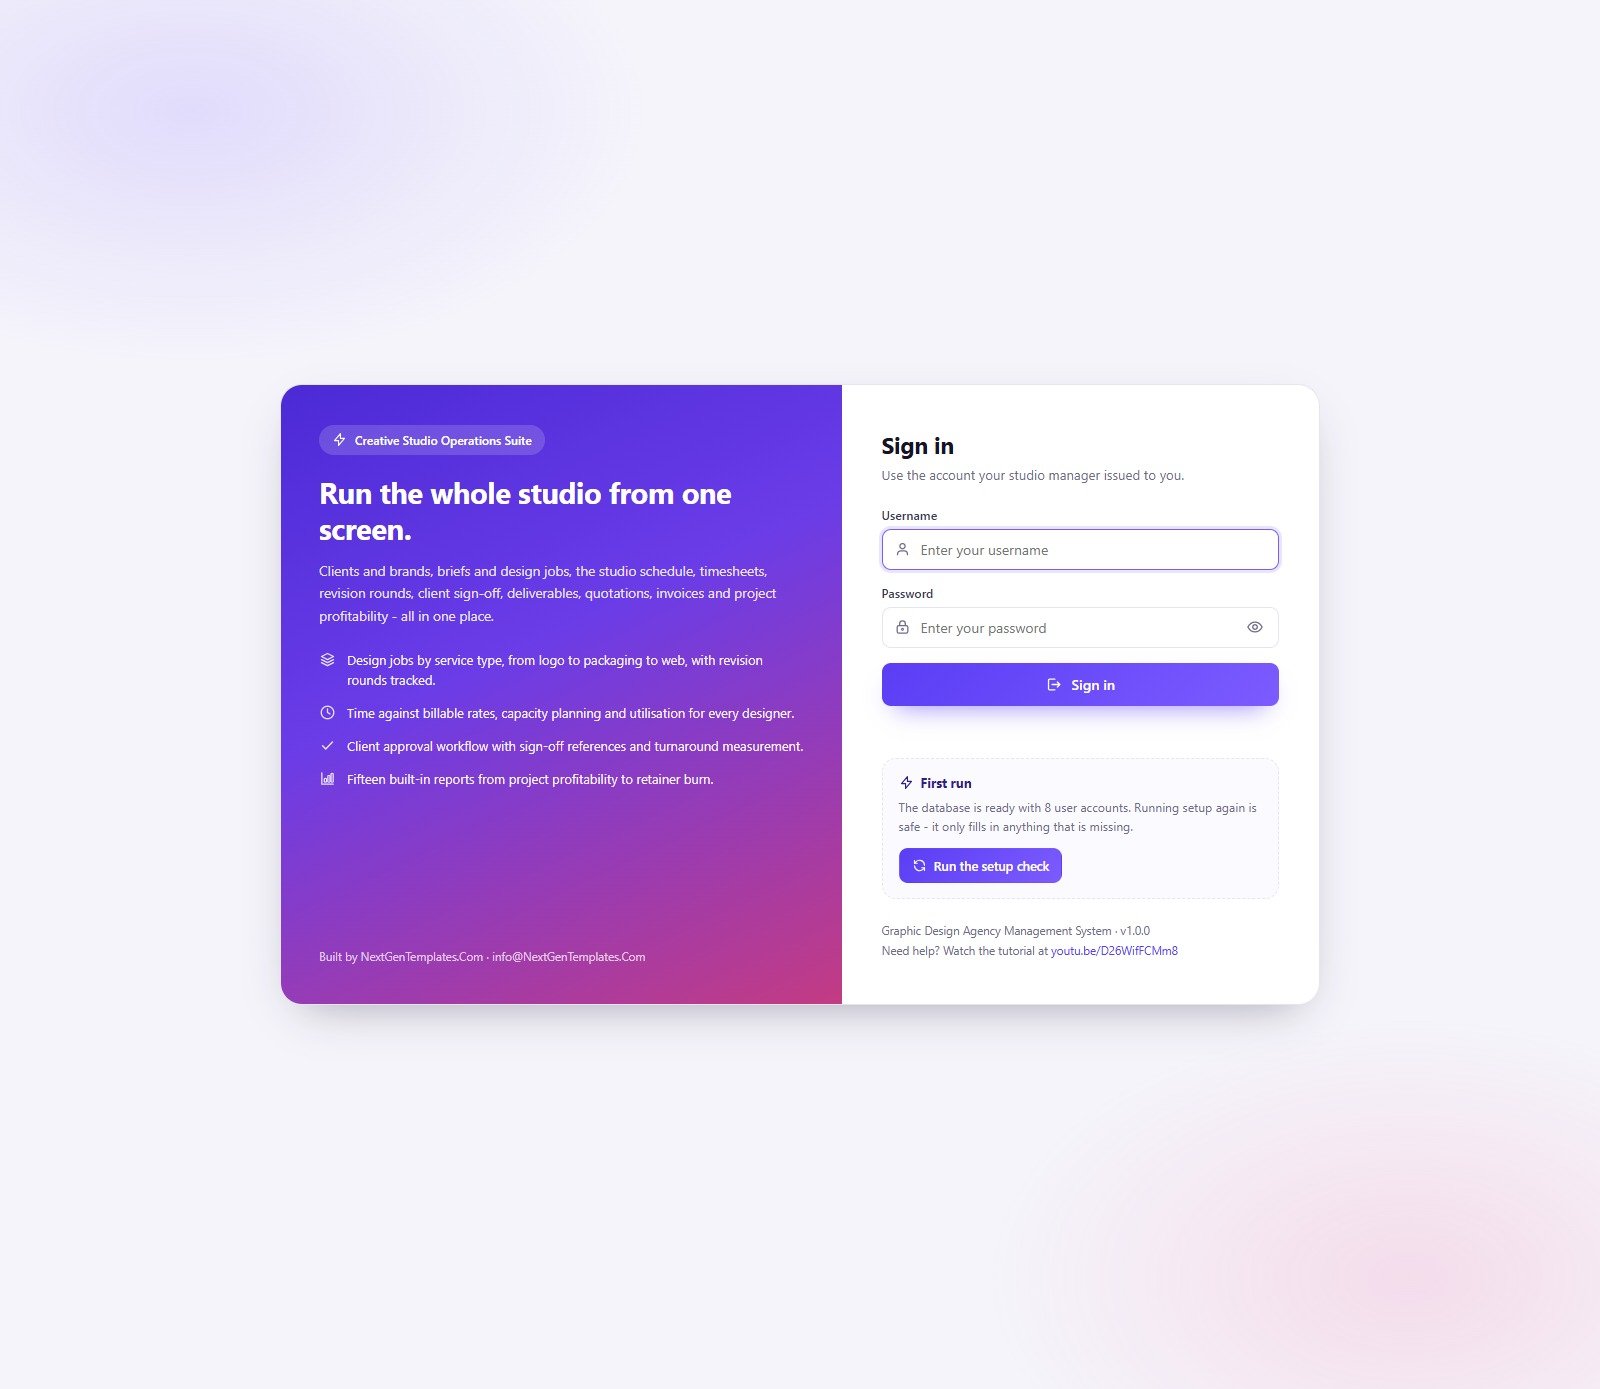
The studio-side sibling of pick #2. It is a Google Apps Script system with 27 modules, 31 database tables, 15 reports and 6 operational roles, built around how design work actually moves: brief, job, revision round, client approval, invoice.
Who it is for: branding, packaging and graphic design studios that lose margin to untracked revisions and outsourced assets.
- Projects, Creative Briefs, Design Jobs, Studio Schedule, Revision Rounds and Client Approvals.
- Retainers that record hours included, used and overage.
- Designer capacity, contracted hours, utilisation and billable value from timesheets.
- Quotations that progress to invoices, plus payments, expenses and project profitability.
The Home dashboard brings together revenue, gross margin, utilisation, outstanding receivables, jobs due and approvals waiting, which is the studio manager’s morning check in one screen. A live demo is linked from the product page.
Price: $39.99, one-time. See the Graphic Design Agency Management System
Best for: studios whose problem is revision rounds and approvals, not just reporting.
5. Advertising KPI Dashboard in Excel: best for multi-channel ad KPIs
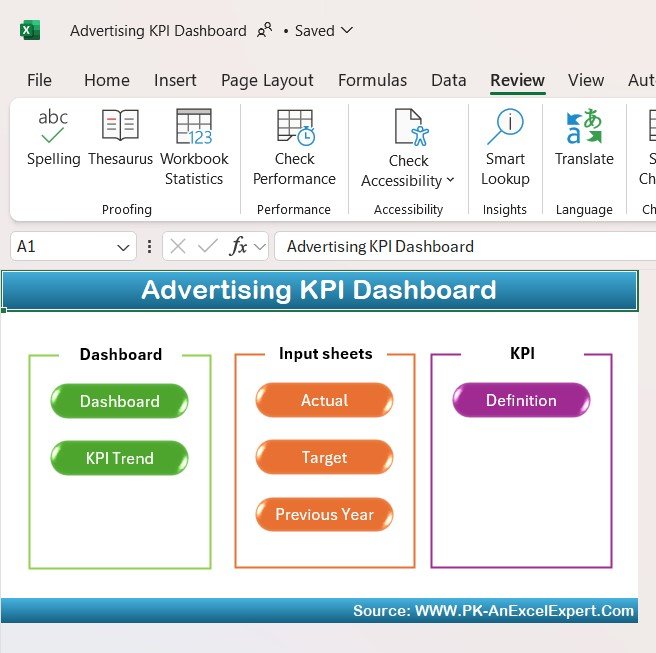
A client-reporting file for agencies that run more than digital. It tracks impressions, clicks, conversions, CTR, CPC and ROAS for digital, print and TV campaigns, with month-to-date and year-to-date views and targets for every KPI.
Who it is for: account managers who send a monthly performance report to each client.
- Core ad KPIs: impressions, clicks, CTR, CPC, conversions and ROAS.
- MTD and YTD analysis with goal-versus-actual comparison.
- Conditional formatting that flags high CPC, low CTR and unprofitable ads.
Worked example: a client spends $5,000 for 400,000 impressions, 6,000 clicks and 150 conversions. That is a 1.5% CTR, a $0.83 CPC and a $33.33 cost per conversion. Enter the monthly totals and the dashboard does that arithmetic every month for you.
Price: $14.99, one-time. Get the Advertising KPI Dashboard in Excel
Best for: agencies reporting a mix of online and offline media.
6. Digital Advertising KPI Dashboard in Excel: best for paid social and search
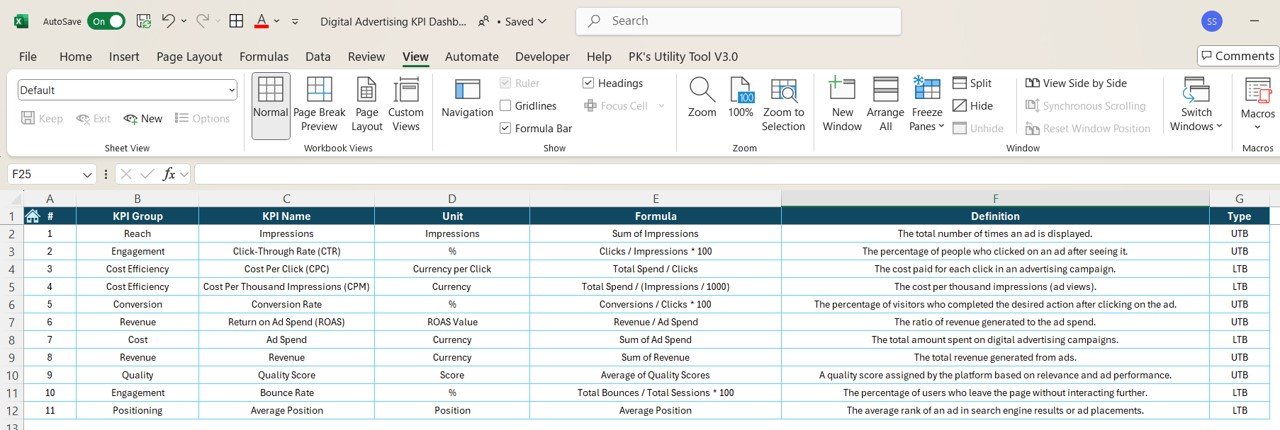
The digital-only counterpart of pick #5, built for campaigns across Google Ads, Facebook and Instagram. It adds cost per acquisition and revenue-versus-spend ROI tracking, and covers paid and organic performance.
Who it is for: performance-marketing agencies and in-house teams managing several ad platforms.
- CTR, CPC, CPA, conversion rate and ROI per campaign.
- Ad-spend tracking over time to catch budget pacing problems early.
- Paid and organic results side by side.
Use it to rank platforms by cost per acquisition each month and move budget to the cheapest channel that still converts. Our SEO KPIs guide covers the organic side in more depth.
Price: $14.99, one-time. Get the Digital Advertising KPI Dashboard
Best for: agencies whose clients are mostly on search and social.
7. Advertising KPI Dashboard in Power BI: best interactive client reporting
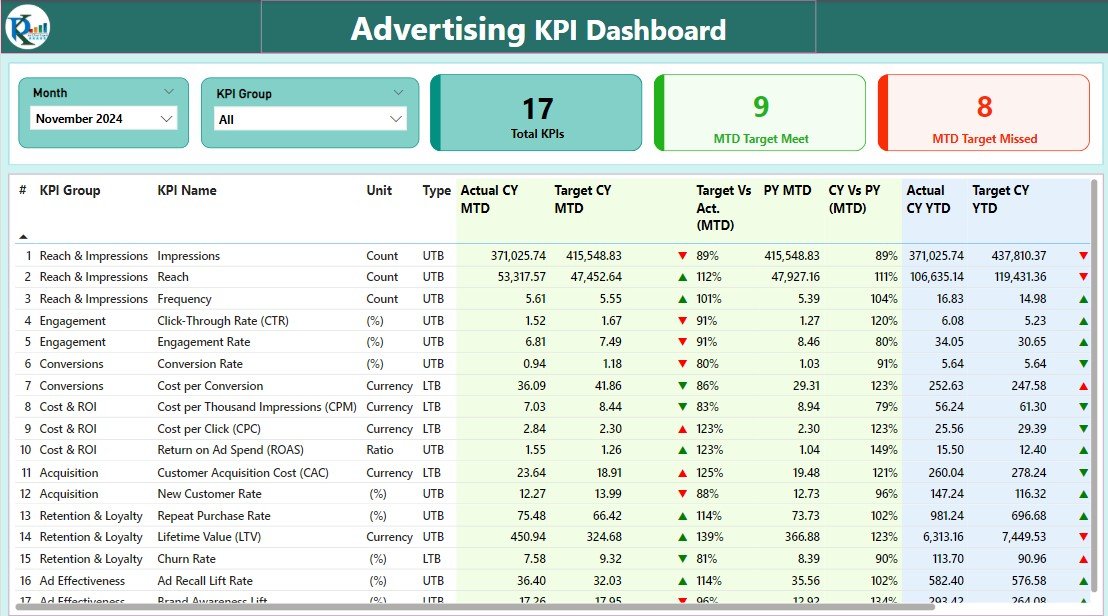
The Power BI version of the advertising KPI report, built for agencies with more data than a spreadsheet should hold. It centralises impressions, CTR, conversion rate and ROAS from sources such as Google Ads and Facebook Ads exports.
Who it is for: agencies with an analyst on staff, or larger accounts where clients expect an interactive report rather than a PDF.
- Ad performance tracking across platforms in one report.
- ROAS monitoring to show revenue generated per dollar of spend.
- CTR analysis to test which creatives resonate.
It opens in the free Power BI Desktop, so there is no licence cost to build the report. If you are weighing Power BI’s paid tiers, our Power BI Premium alternatives post compares the options.
Price: $11.99, one-time. Get the Advertising KPI Dashboard in Power BI
Best for: data-heavy accounts and interactive reporting.
8. Advertising KPI Dashboard in Google Sheets: best value

The cheapest way to give a whole team, and the client, the same live view. It tracks impressions, clicks, conversions, CTR, CPC and ROAS from any ad platform, with budget tracking against allocation and time-period comparisons.
Who it is for: small agencies and freelancers who already work in Google Workspace and share reports by link.
- Multi-channel KPIs in one sheet, with built-in trend charts.
- Ad spend tracked against budget to prevent overspending.
- Fully editable, so you can add the KPIs your clients care about.
Want monthly target and previous-year comparisons instead? The Digital Advertising KPI Dashboard in Google Sheets ($9.99) adds a month dropdown, MTD/YTD views and a KPI Trend tab. For teams standardising on Sheets, see our Google Sheets templates for teams.
Price: $9.99, one-time. Get the Advertising KPI Dashboard in Google Sheets
Best for: the lowest-cost shared client report.
Which agency KPIs should your dashboard track?
Whichever template you pick, these are the formulas behind the numbers. Agree them with your team once, then stop debating them in every review.
| KPI | Formula | What it tells you |
|---|---|---|
| Billable utilisation | Billable hours / available hours | Whether the team’s time is turning into revenue |
| Gross profit margin | (Revenue – direct cost) / revenue | Which clients and services actually make money |
| Revisions per job | Total revision rounds / jobs delivered | Brief quality and scope creep |
| On-time delivery rate | Jobs delivered on or before due date / jobs delivered | Operational reliability |
| CTR | Clicks / impressions | Whether the creative earns attention |
| CPC | Ad spend / clicks | The price of each visit |
| CPA | Ad spend / conversions | The price of each result |
| ROAS | Attributed revenue / ad spend | Return on the client’s media budget |
How to choose between them
- You report on the agency’s own revenue, margin and delivery: pick #1, the Creative Agencies Dashboard, or pick #3 if your review is target-driven.
- You report on clients’ ad campaigns: pick #5 for mixed media, #6 for digital only, #7 for Power BI, #8 for Google Sheets.
- Your problem is workflow, not reporting: pick #2 for media and advertising agencies, pick #4 for design studios.
- You also manage brand guidelines across channels: add the Brand Consistency KPI Dashboard in Excel ($14.99) to any of the above.
- You are on a tight budget: start with pick #8 at $9.99 and upgrade once the reporting habit sticks.
Running a different kind of agency? Our roundups of insurance agency templates and travel agency dashboard templates follow the same format, and the finance KPIs guide covers the numbers your accountant will ask for.
When a template is NOT the right answer
A template is the wrong buy in three situations. First, if you need live, automatic data from Google Ads, Meta and LinkedIn every hour, a dedicated reporting SaaS with API connectors will save more time than it costs. These templates work from exports you paste in.
Second, if you need full accounting, payroll or tax filing, keep your accounting package. The two web apps manage invoices, receipts and profitability, but they say plainly that they do not replace full accounting software.
Third, if more than about 25 people log time or edit the same file at once, an Excel workbook will become a bottleneck. Move to the Google Apps Script web apps, which support role-based logins, or to a dedicated agency platform. For everyone else, a one-time template is faster to set up and far cheaper to own.
Frequently asked questions
What is an agency dashboard?
An agency dashboard is a single report that shows an agency's revenue, gross profit, project load, billable hours and client quality, and for advertising work the campaign metrics such as CTR, CPC and ROAS. It replaces the weekly ritual of stitching numbers together from timesheets, invoices and ad platforms.
What should an agency dashboard template include?
At minimum: revenue and gross profit by client, billable hours against capacity, project status and delivery dates, and a client-quality signal such as rating or revision count. Advertising agencies should add spend, impressions, clicks, conversions, CPC, CPA and ROAS by campaign and channel.
Is an Excel agency dashboard good enough for a 20-person agency?
Yes, for reporting. A 20-person agency produces a few thousand timesheet and project rows a year, well within what Excel pivot tables handle. Where Excel struggles is multi-user data entry; if several people log work at once, use a Google Sheets or web-app system instead.
What KPIs should a creative agency track?
Track revenue, gross profit margin, billable utilisation (billable hours divided by available hours), average revisions per job, on-time delivery rate, client rating and revenue per client. The Creative Agencies KPI Dashboard in Excel adds monthly targets and previous-year figures for each one.
How do you calculate ROAS for a client report?
ROAS is revenue attributed to ads divided by ad spend. A campaign that spent $2,000 and produced $9,000 in tracked revenue has a ROAS of 4.5, often written 4.5x or 450%. Report it per campaign and per channel, because a blended number hides the losers.
Can I connect these dashboards to Google Ads or Meta Ads?
Not directly. These templates read data you paste or import from an export, which keeps them free of API keys and subscription connectors. Most agencies export a monthly CSV from each ad platform and paste it into the data or input sheet in a few minutes.
What is the difference between the dashboard and the KPI dashboard versions?
The dashboard versions analyse raw records, such as every project or campaign row, through charts and slicers. The KPI dashboard versions work on monthly totals and compare each KPI with its target and the previous year, month-to-date and year-to-date. Many agencies run one of each.
Do these templates require a subscription?
No. Every template in this list is a one-time purchase between $9.99 and $39.99. The Excel files need Microsoft Excel, the Power BI file needs the free Power BI Desktop, and the web apps run on your own Google account with no fee from NextGenTemplates.
Which agency dashboard template is best for a small creative studio?
A studio of two to ten people should start with the Creative Agencies Dashboard in Excel at $17.99. If the studio's real pain is briefs, revision rounds and approvals rather than reporting, the Graphic Design Agency Management System Web App at $39.99 is the better buy.
Get more agency dashboard templates
Ready to see where your agency’s margin goes? Start with our best overall pick, the Creative Agencies Dashboard in Excel ($17.99), or the best-value Advertising KPI Dashboard in Google Sheets ($9.99). Need the whole workflow? The Advertising Agency Campaign Management System ($39.99) is a one-time purchase with a live demo.
Browse the full NextGenTemplates shop for more dashboards, and subscribe to the NextGenTemplates YouTube channel for setup tutorials and walkthroughs of each template.