

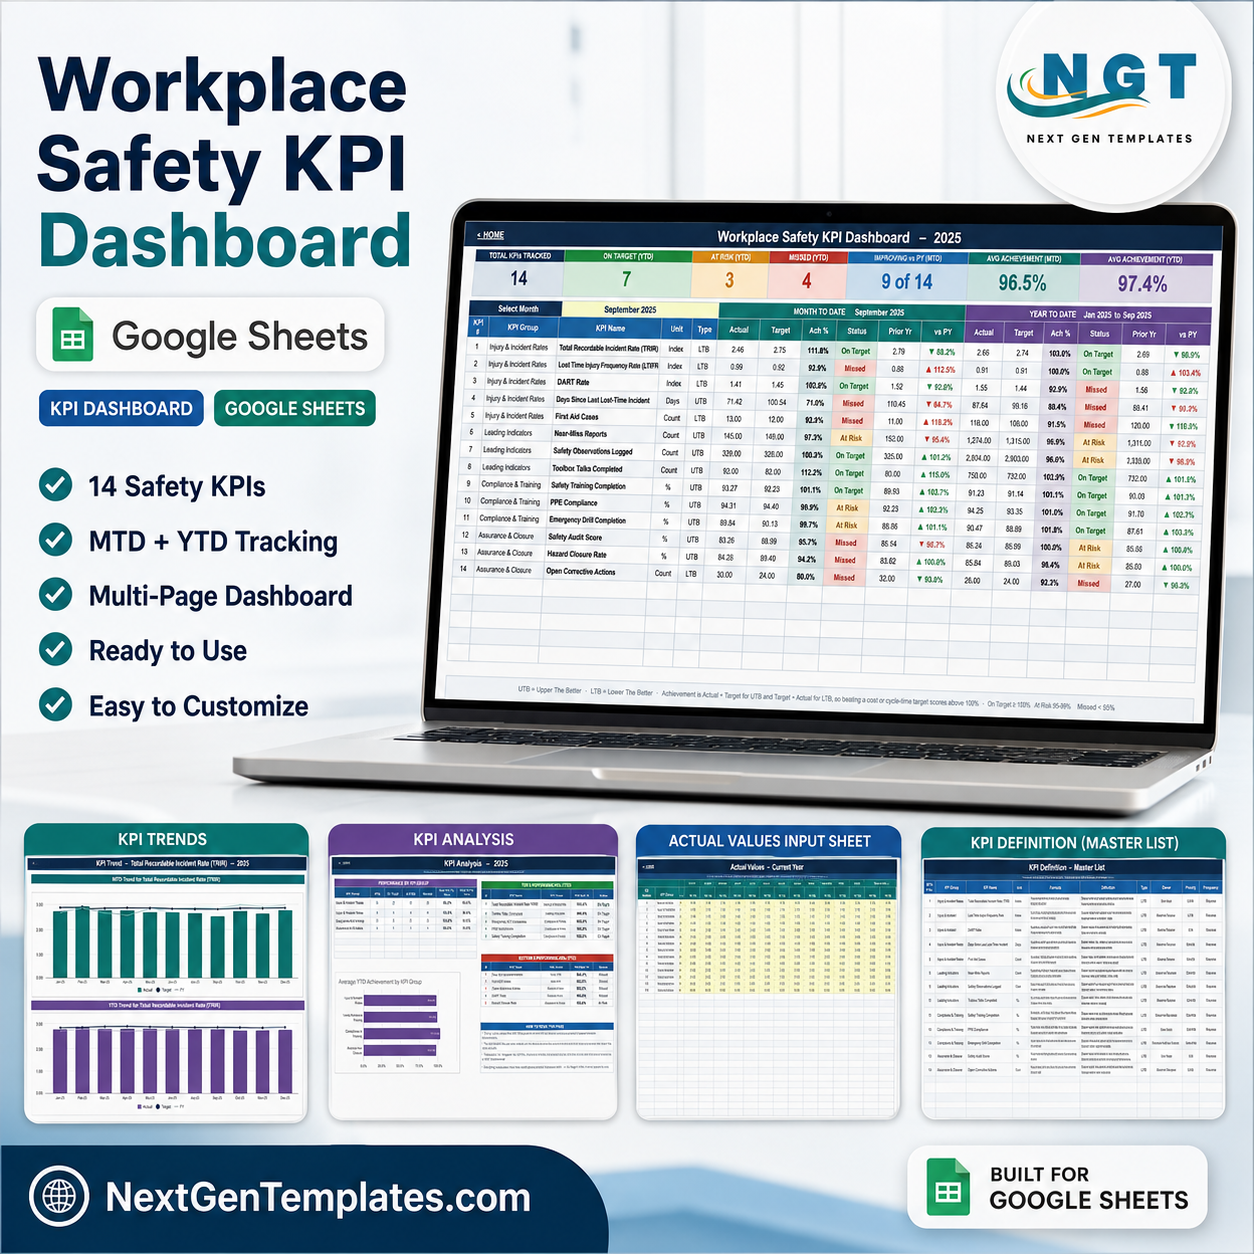
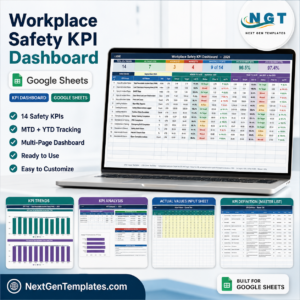
The Workplace Safety KPI Dashboard in Google Sheets turns the safety numbers you already collect every month into a single, colour-coded scorecard. It tracks 14 workplace safety KPIs across four groups – Injury & Incident Rates, Leading Indicators, Compliance & Training, and Assurance & Closure – and shows month-to-date and year-to-date performance side by side with Actual, Target, Achievement %, status and a prior-year comparison for every one of them. Ten sheets, twelve months of history, one month picker, and not a single add-on, script or macro to install. Built by NextGenTemplates, whose YouTube channels reach 300K+ subscribers. Instant download, one-time payment, no subscription – the copy you make is yours to keep and edit forever.
Which template is this? This is the KPI scorecard build – a month-picker table with traffic lights, a KPI Trend page and a KPI Analysis page. It is not the same product as our analytical Workplace Safety & Incident Management Dashboard in Google Sheets, which slices a record-level dataset with charts and filters. The two are complementary: this one answers “are we hitting our targets this month?”, that one answers “what is inside the data?”
Key Features of the Workplace Safety KPI Dashboard
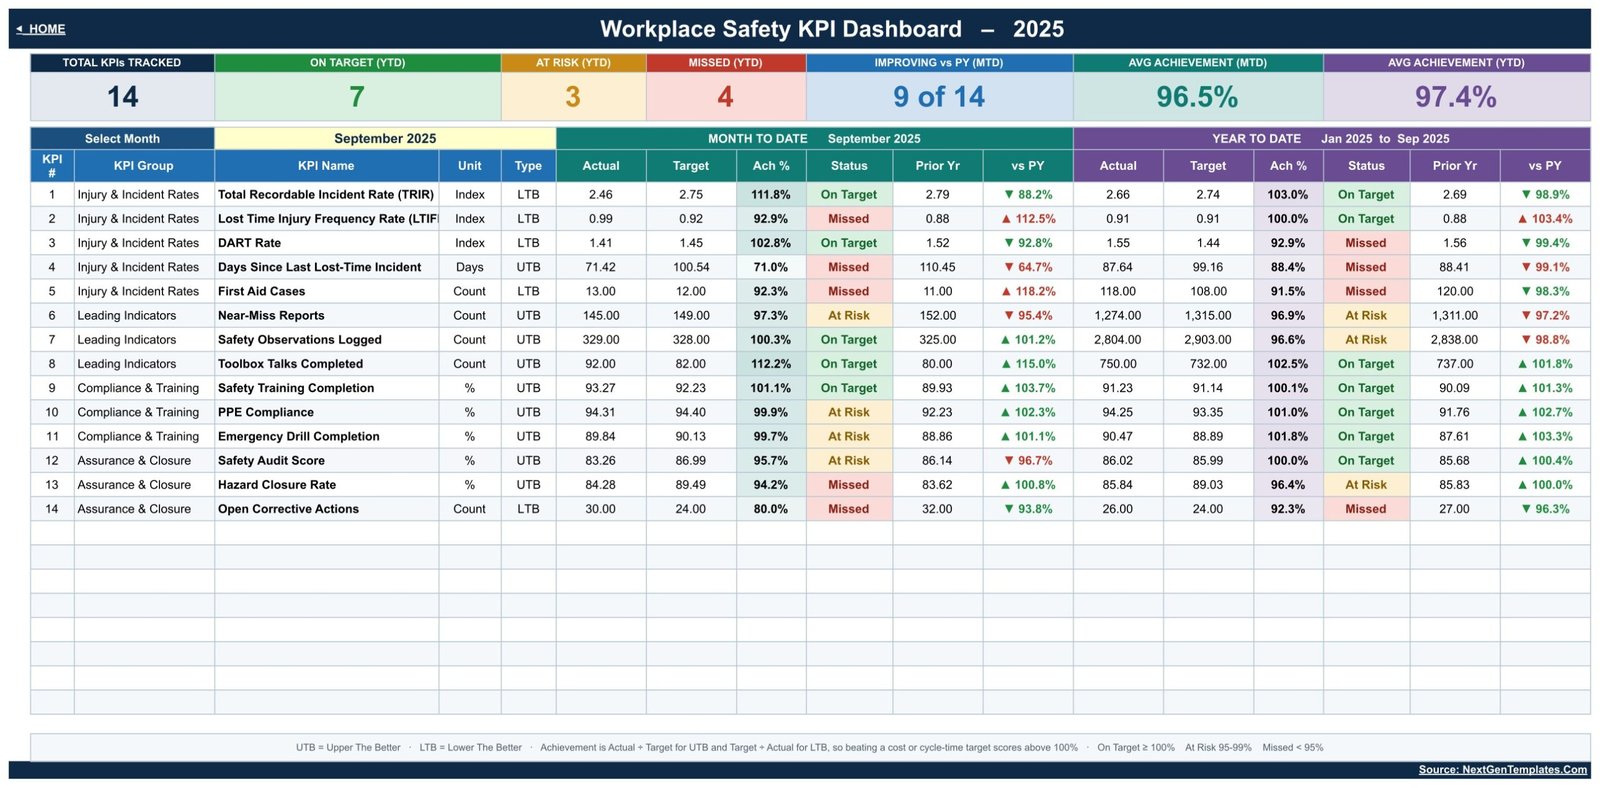
- 14 safety KPIs in four groups. Injury & Incident Rates (5), Leading Indicators (3), Compliance & Training (3), Assurance & Closure (3).
- A single month dropdown drives everything. Change the month on the KPI Dashboard sheet and the scorecard, the KPI Analysis page and the header dates all re-calculate. There is no refresh button and no query to run.
- MTD and YTD in the same row. Each KPI shows Actual, Target, Achievement %, status, Prior Year and a vs-PY arrow twice over – once for the selected month, once for the year to date.
- Upper-the-better / lower-the-better handling. Achievement is Actual ÷ Target for UTB KPIs and Target ÷ Actual for LTB KPIs, so a falling TRIR correctly scores above 100%.
- Editable traffic-light thresholds. The shipped bands are On Target at 100% and above, At Risk from 95% to 99%, and Missed below 95%. They live in ordinary Status formulas you can change.
- Six summary cards across the top: Total KPIs Tracked, On Target (YTD), At Risk (YTD), Missed (YTD), Improving vs PY (MTD), Avg Achievement (MTD) and Avg Achievement (YTD).
- Three plain input sheets – Actual, Target and Prior Year – with one yellow cell per KPI per month. Nothing else needs touching.
- A master KPI list. Add, rename or delete a KPI on the KPI Definition sheet and every other sheet picks it up automatically, including the group roll-up.
What’s Inside the Workplace Safety KPI Dashboard
1. Home
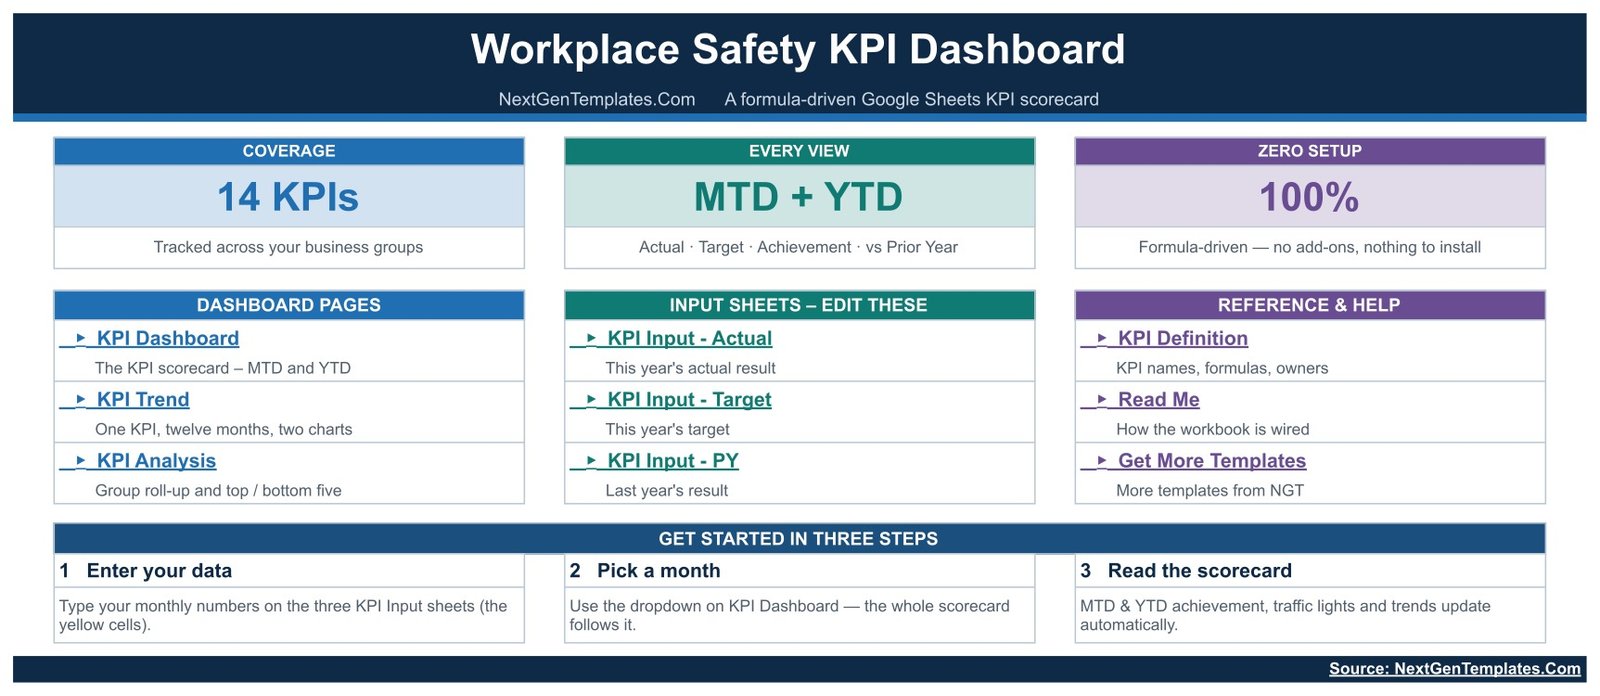
A navigation page with three coverage cards and one-click links to every sheet, grouped into Dashboard Pages, Input Sheets and Reference & Help, plus a three-step “get started” strip.
2. KPI Dashboard
The main scorecard. Month dropdown, six status cards, and one row per KPI with KPI Group, Unit, Type, and the full MTD and YTD blocks. In the sample month of September 2025 the demo numbers show 7 On Target, 3 At Risk and 4 Missed on a YTD basis, with average achievement of 96.5% MTD and 97.4% YTD.
3. KPI Trend
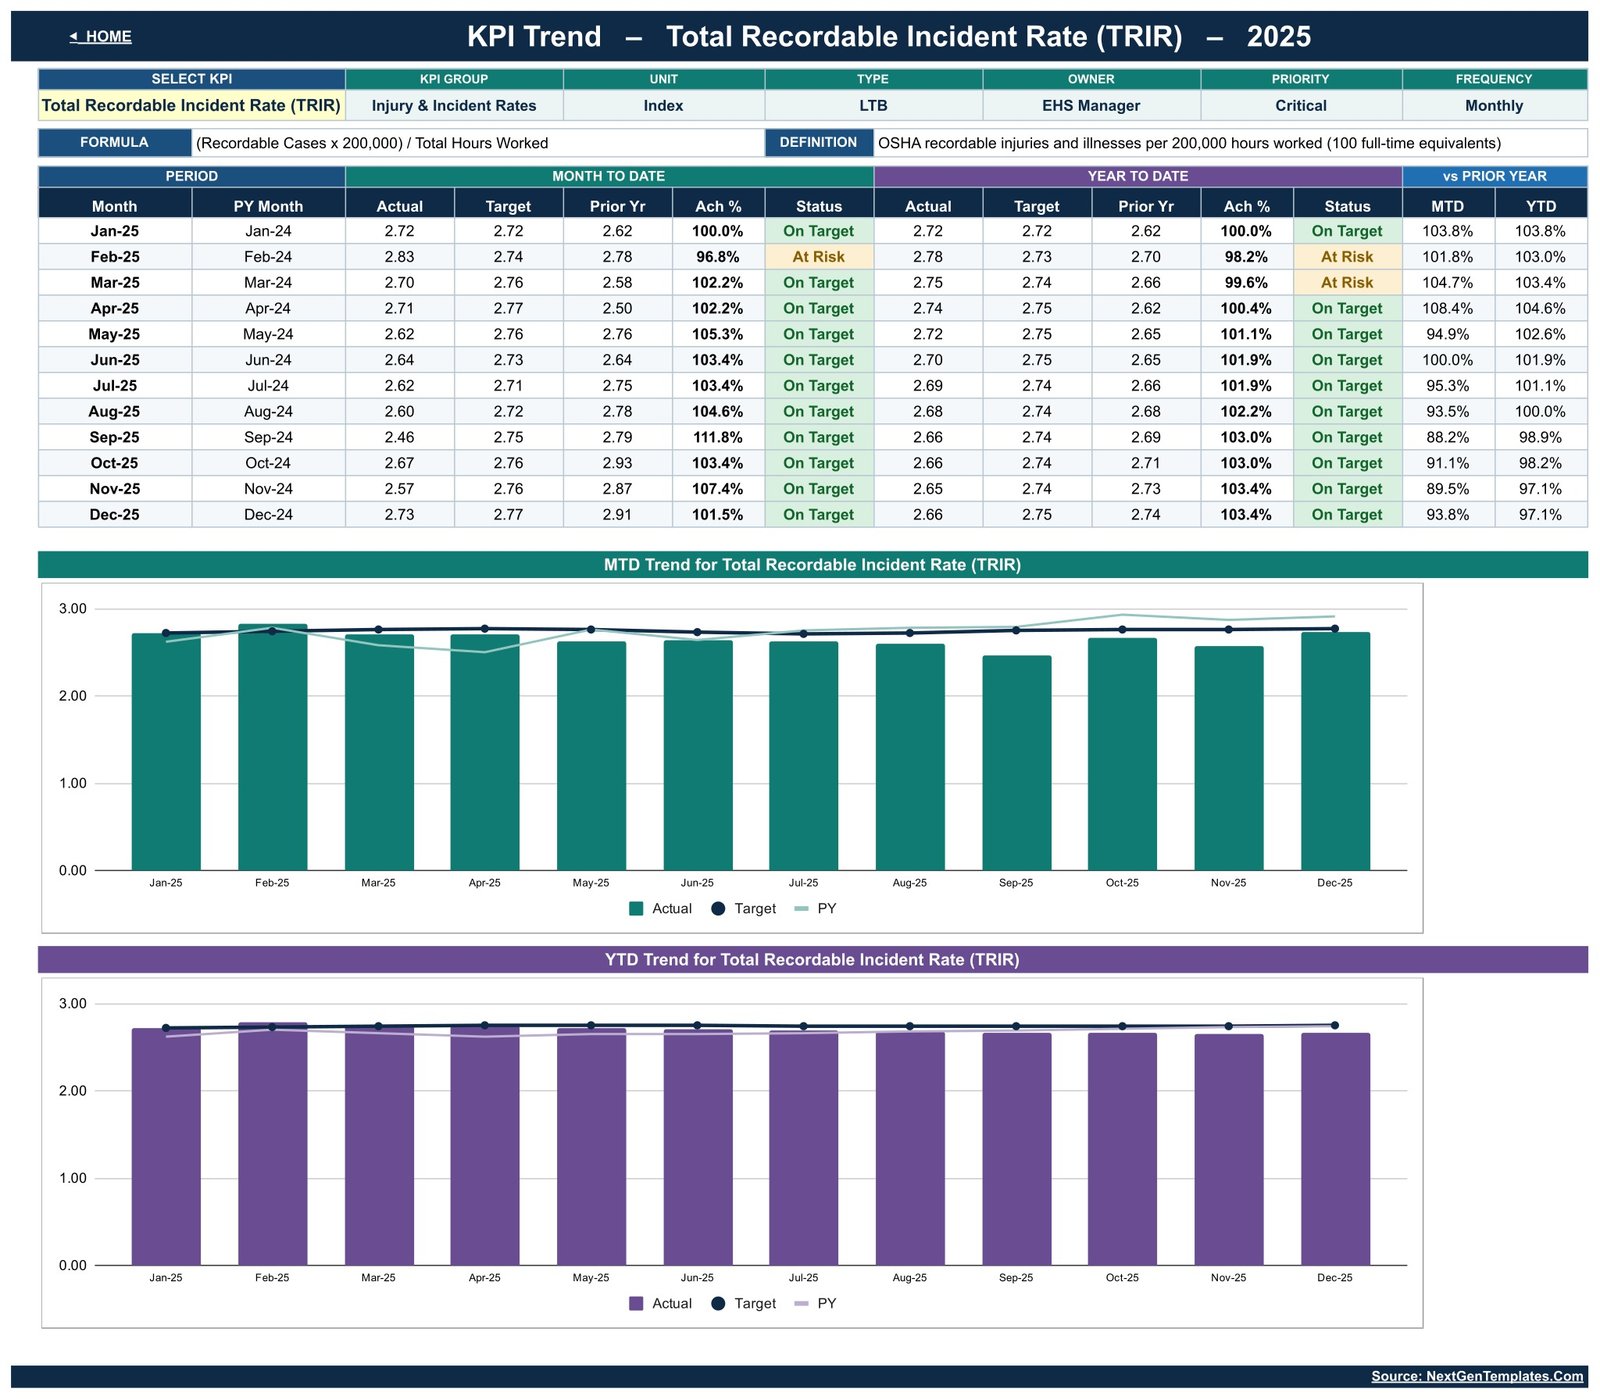
Pick any one of the 14 KPIs from a dropdown and get all twelve months at once: MTD Actual, Target, Prior Year, Achievement % and status, then the same again for YTD, plus vs-PY columns. Two charts underneath – an MTD trend and a YTD trend – each plotting Actual as columns against Target and Prior Year as lines. The KPI’s group, unit, type, owner, priority, frequency, formula and definition are pulled through into the header automatically.
4. KPI Analysis
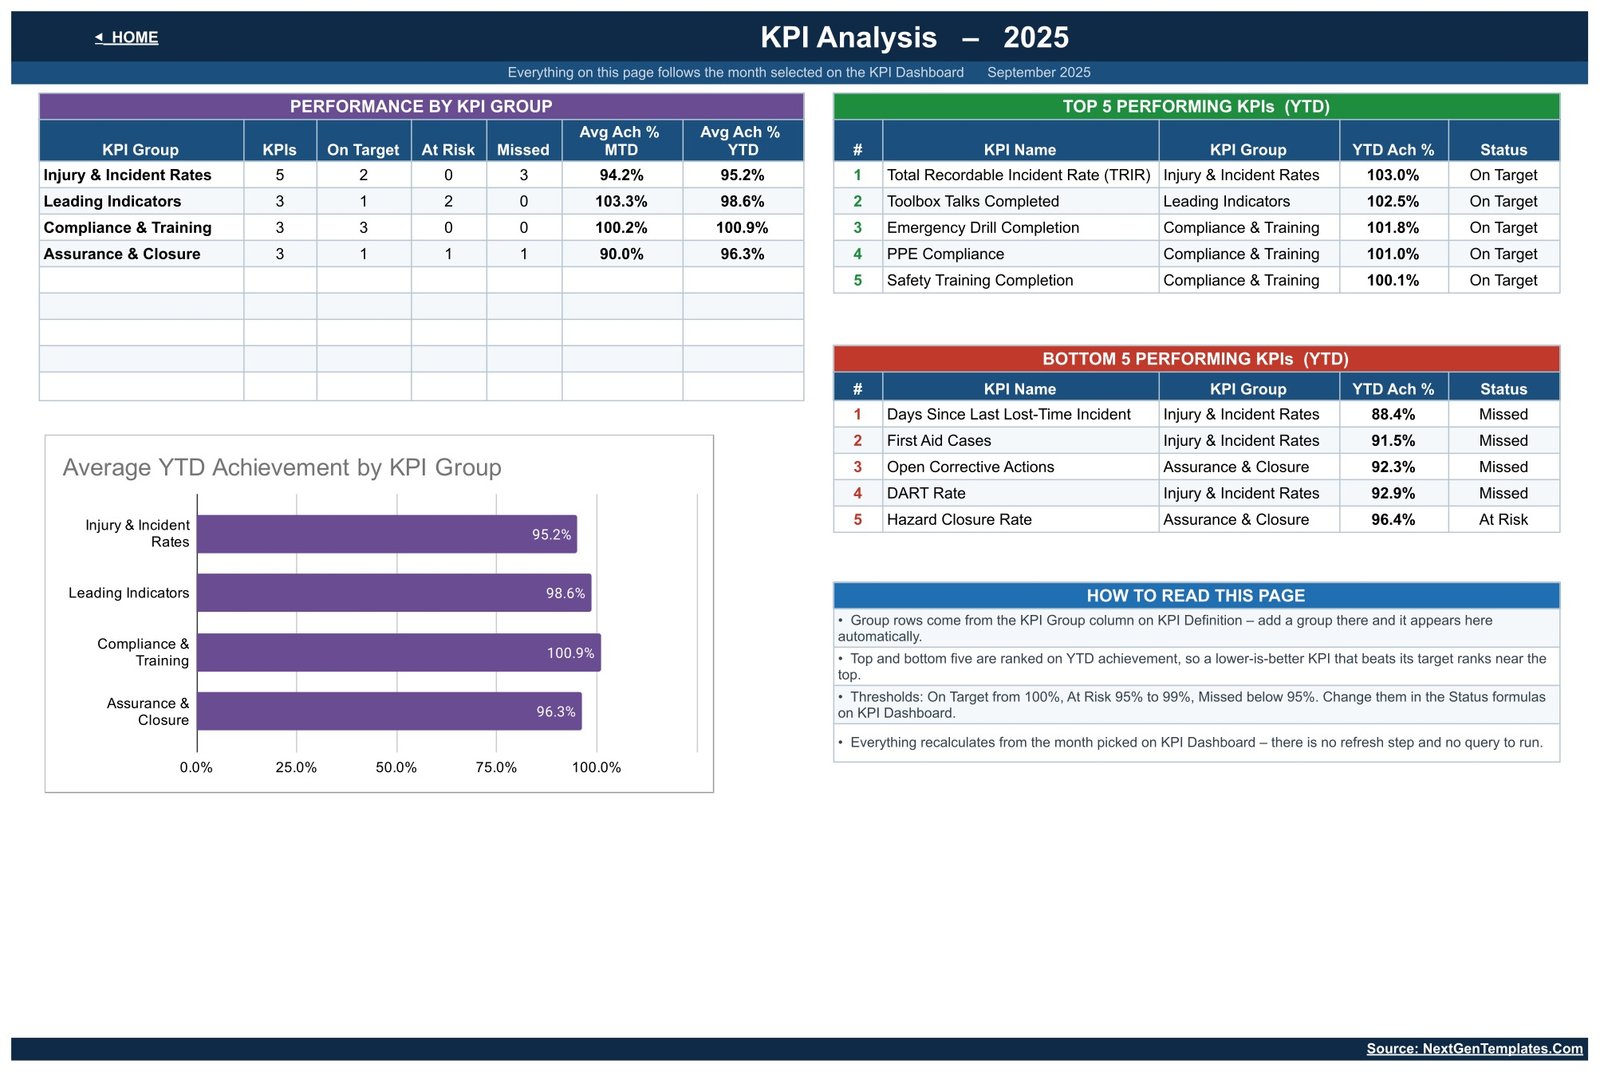
Performance by KPI Group (KPI count, On Target, At Risk, Missed, Avg Ach % MTD and YTD), an Average YTD Achievement by KPI Group bar chart, and automatic Top 5 and Bottom 5 KPI tables ranked on YTD achievement. A “How to read this page” panel explains the ranking and the thresholds.
5-7. KPI Input – Actual, Target and PY
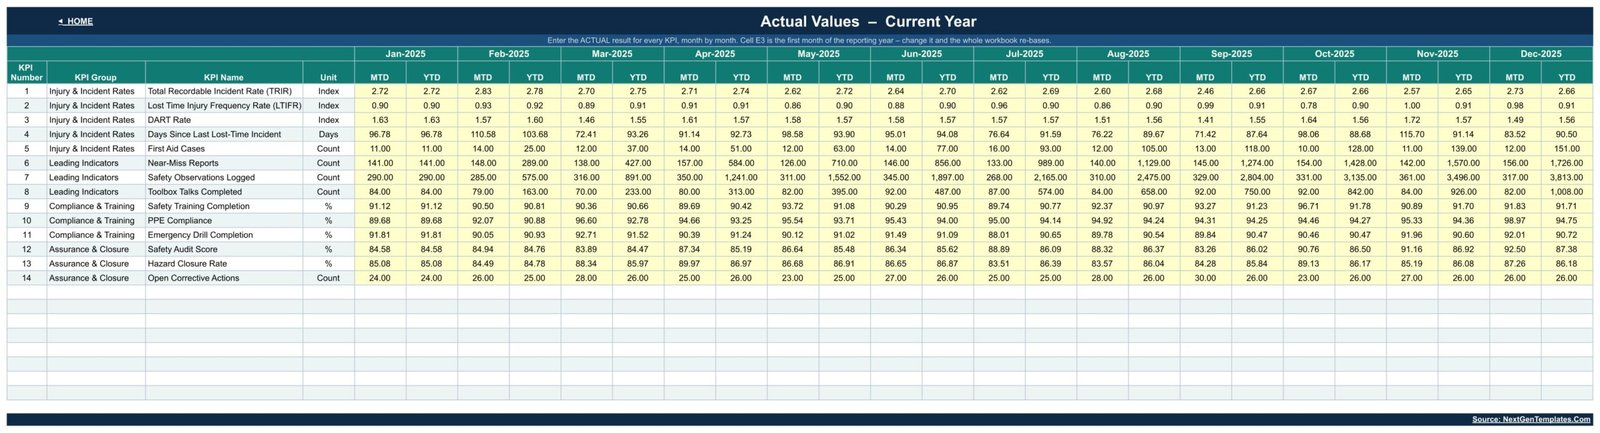
Three matching grids, twelve months across, one KPI per row. You type the MTD figure; the YTD column next to it is calculated for you as a running sum or a running average depending on the KPI. One cell (E3 on the Actual sheet) sets the first month of the reporting year and re-bases the whole workbook.
8. KPI Definition
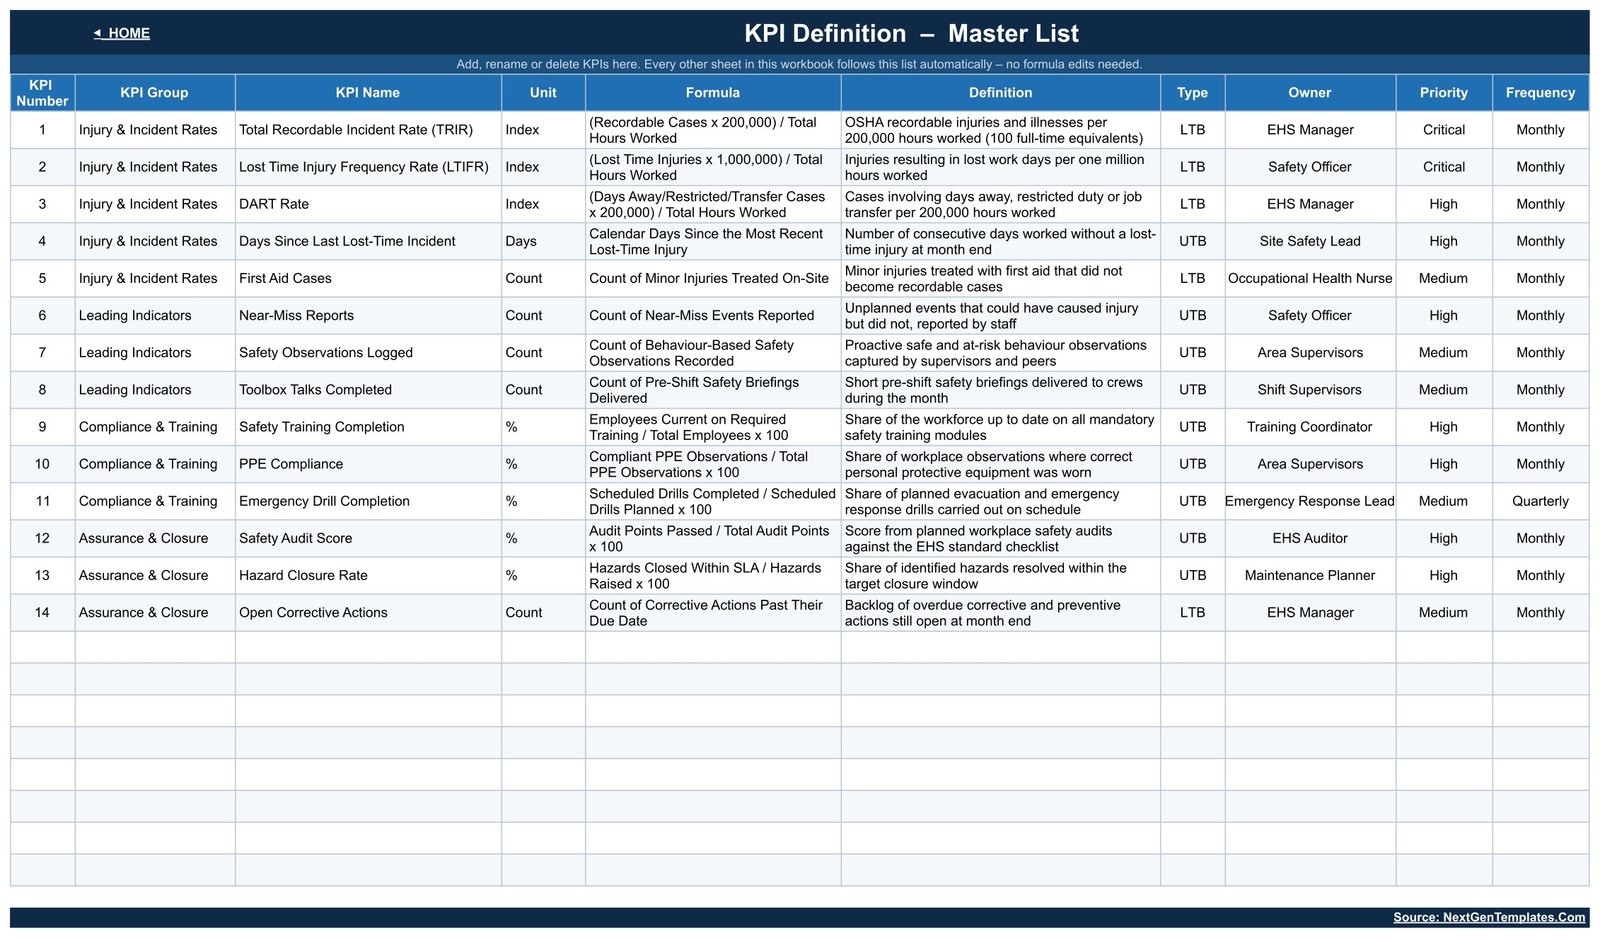
The master list: KPI Number, Group, Name, Unit, Formula, Definition, Type, Owner, Priority and Frequency for all 14 KPIs. This sheet is the source of truth – every other sheet reads from it.
9-10. Read Me and Get More Templates
How the workbook is wired, and links to the rest of the NextGenTemplates catalogue.
Google Sheets vs. Excel vs. Paid EHS Software – Where This Fits
| This template (Google Sheets) | Excel KPI template | Paid EHS software | |
|---|---|---|---|
| Cost | $8.99 one time | $12-$20 one time | Per-user subscription, varies by vendor |
| Platform | Any browser, Google Sheets | Desktop Excel | Vendor web app |
| Setup time | Make a copy, then type your numbers | Download and open | Implementation project |
| Real-time team collaboration | Yes, native | Only via OneDrive co-authoring | Yes |
| Mobile access | Yes, Google Sheets app | Limited | Usually a dedicated app |
| Customisable KPI list | Yes – edit one master sheet | Usually yes | Often fixed to the vendor’s model |
| Share with a link | Yes | No | Seat-based access |
| Year-1 cost at 5 users | $8.99 total | One file, shared manually | Recurring, scales with seats |
| Incident case management and workflow | No – monthly summary numbers only | No | Yes |
| Regulatory submission and compliance certification | No | No | Vendor dependent |
Be clear about the trade-off: this is a tracking and visualisation template that charts figures you type in. If you need case files, investigations, corrective-action workflow, evidence storage or regulatory submissions, you need dedicated EHS software – and this dashboard sits happily alongside it as the monthly management view.
Who This Template Is For – and Who It’s Not For
It’s for you if you are an EHS manager, safety officer, site safety lead, plant or operations manager, HR business partner or a small-business owner who already pulls monthly safety numbers together in a spreadsheet, and wants them presented as a scorecard your leadership team can read in thirty seconds. It suits organisations reporting 12 to 20 safety metrics per month across a handful of sites or departments.
It’s not for you if you need a live incident-reporting portal, near-miss submission forms, investigation records, employee-level medical data, automatic pulls from an ERP or maintenance system, or anything that produces a filing to a regulator. It is also not a substitute for professional safety advice – the KPI definitions and formulas shipped with it are conventional industry descriptions supplied as editable text, not legally authoritative statements, and you should confirm every definition against your own organisation’s reporting rules before you use it.
How to Use the Workplace Safety KPI Dashboard
- Make your copy. Open the PDF in your download, click the Google Sheets link, then choose File > Make a copy. The copy lands in your own Google Drive.
- Set your KPI list. On KPI Definition, edit the 14 shipped KPIs or replace them with your own. Set Unit, Type (UTB or LTB), Group, Owner, Priority and Frequency for each.
- Set the reporting year. On KPI Input – Actual, change cell E3 to the first month of your reporting year. Every sheet re-bases.
- Enter your numbers. Fill the yellow monthly cells on KPI Input – Actual, – Target and – PY. Leave future months blank.
- Pick a month. Use the dropdown on KPI Dashboard. The scorecard and the KPI Analysis page follow it instantly.
- Adjust the thresholds if you want. The On Target / At Risk / Missed bands are ordinary formulas in the Status columns – change 100% and 95% to whatever your management team uses.
- Review the trends. Use KPI Trend for a single KPI over twelve months, and KPI Analysis for the group roll-up and the top and bottom five.
Real-World Use Cases
Priya, EHS Manager at a 400-person manufacturing site. She reports to a monthly HSE committee. She keeps TRIR, LTIFR and DART on the Injury & Incident Rates group, and uses the Leading Indicators group – near-miss reports, safety observations and toolbox talks – to show the committee that reporting culture is improving even in a month when a recordable case occurred. She screenshots the KPI Analysis page straight into the meeting pack.
Daniel, Operations Manager at a 60-person warehouse business. He has no EHS system and no budget for one. He types eight numbers into the input sheets on the first working day of each month, changes the month dropdown, and shares the view-only link with the owner. The traffic lights are the entire conversation.
Aisha, HR Business Partner covering three depots. She only cares about Compliance & Training – training completion, PPE compliance and emergency drills. She deleted the other groups from the KPI Definition sheet, and the group roll-up, the charts and the top-five tables all reshaped themselves without her editing a single formula.
Frequently Asked Questions
Does this dashboard make my organisation compliant, or produce an OSHA, RIDDOR or ISO 45001 submission?
No – to all of it. This is a spreadsheet that charts numbers you type in. It performs no regulatory calculation, produces no statutory form, is not certified against any standard, and makes no compliance claim. The formula and definition text on the KPI Definition sheet is plain-language description that you can and should edit to match your own organisation’s rules. Confirm your reporting obligations with a qualified safety professional.
Is this an incident management system?
No. There are no case records, no investigation workflow, no corrective-action assignment and no evidence storage. The dashboard works entirely on monthly summary figures – one number per KPI per month.
Do I need add-ons, Apps Script or macros?
No. Every calculation is a native Google Sheets formula. There is nothing to install, authorise or enable, and nothing breaks if your organisation blocks add-ons.
Can I change the KPIs to my own?
Yes – that is the point of the KPI Definition sheet. Add rows, rename them, delete the ones you do not report. The scorecard, both trend charts, the group roll-up and the top/bottom-five tables all follow the master list.
What exactly do I download?
A PDF. It contains the link to the Google Sheets file – open it and use File > Make a copy to create your own editable copy in Google Drive. There is no .xlsx and no zip, because a Google Sheets template is delivered as a copy link.
Is the sample data real?
No. The 2025 figures shipped in the file are demonstration numbers generated to fill the charts. Clear them and enter your own.
Does it work on a phone?
Data entry and reading the scorecard work fine in the Google Sheets mobile app. The wide MTD/YTD table and the trend charts are much easier to read on a laptop.
About the Author
Built by PK – Microsoft Certified Professional with 15+ years of Excel, Google Sheets, and Power BI experience. Founder of NextGenTemplates, reaching 300K+ subscribers across YouTube channels. Every template is hand-built and tested before release.
Explore Related Templates
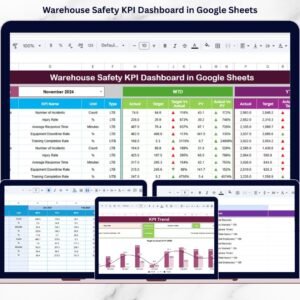
- Warehouse Safety KPI Dashboard in Google Sheets – the same scorecard shape, scoped to warehouse and racking operations.
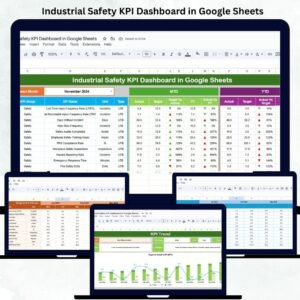
- Industrial Safety KPI Dashboard in Google Sheets – process-plant flavoured safety metrics.
- Mining Safety KPI Dashboard in Google Sheets – for mine-site EHS reporting.
- Workplace Safety & Incident Management Dashboard in Google Sheets – the analytical, record-level companion to this scorecard.
- Employee Benefits Utilization KPI Dashboard in Google Sheets and Leadership Development KPI Dashboard in Google Sheets – the same KPI scorecard engine for two other people-side topics.
- Browse the full Google Sheets KPI Dashboard category or the wider Google Sheets templates collection.
Read the full walkthrough on the blog: Workplace Safety KPI Dashboard in Google Sheets.
Get the Workplace Safety KPI Dashboard in Google Sheets now – instant download, one-time payment, no subscription. Make your copy, type in this month’s numbers, and hand your leadership team a scorecard instead of a spreadsheet.
Reminder: this template is a manual tracking and visualisation tool. It is not a compliance, incident-management or regulatory-reporting system and it does not provide safety advice.
Watch the step-by-step video Demo:
Last updated: August 2026.






























Reviews
There are no reviews yet.