

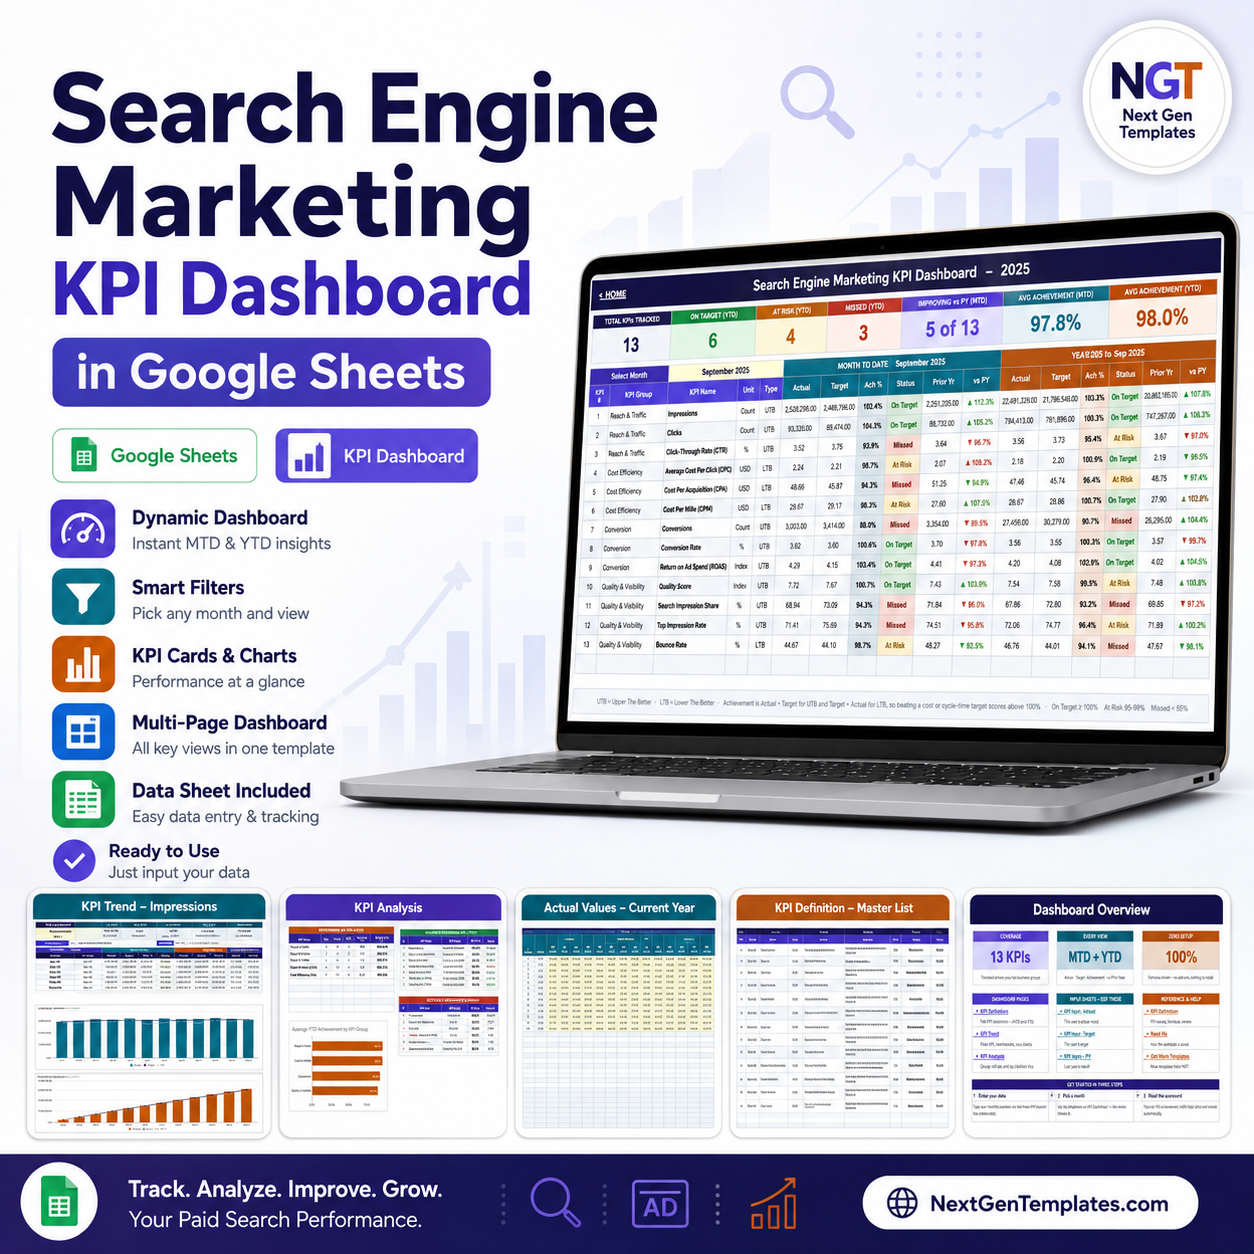
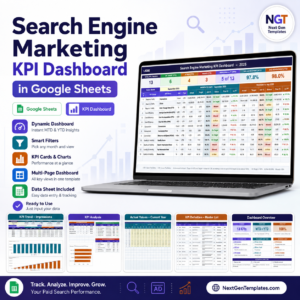
The Search Engine Marketing KPI Dashboard in Google Sheets is a monthly paid-search scorecard for teams that already have the numbers and just need somewhere disciplined to put them. It tracks 13 KPIs across 4 KPI groups, shows month-to-date and year-to-date side by side with Actual, Target, Achievement % and prior-year comparison, and colours every row On Target, At Risk or Missed. You type your own campaign, spend, click and conversion figures into three input sheets – nothing is imported from Google Ads, Microsoft Advertising or Google Analytics. One-time purchase, instant download, and the PDF inside carries a copy link so the file lands in your own Google Drive.
Key Features of the Search Engine Marketing KPI Dashboard in Google Sheets
- 13 KPIs in 4 groups. Reach & Traffic (Impressions, Clicks, CTR), Cost Efficiency (Average CPC, CPA, CPM), Conversion (Conversions, Conversion Rate, ROAS) and Quality & Visibility (Quality Score, Search Impression Share, Top Impression Rate, Bounce Rate).
- A single month picker. Pick a month on the KPI Dashboard sheet and the scorecard, the analysis page and every status light recalculate from it. There is no refresh button and no query to run.
- MTD and YTD in one row. Each KPI carries Actual, Target, Achievement %, status, prior-year value and a vs PY percentage for both the selected month and the year so far.
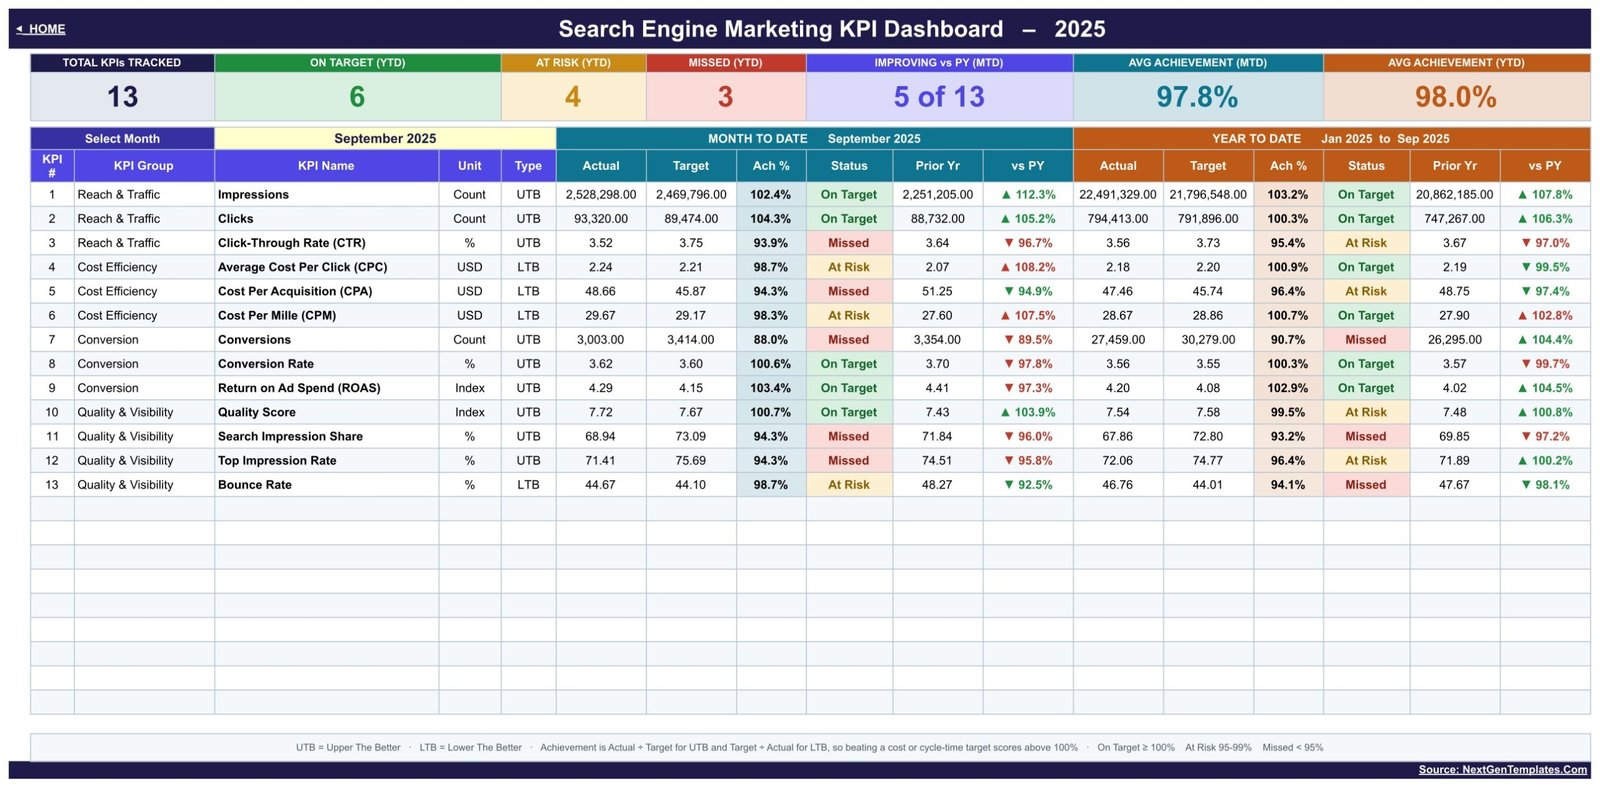
- Direction-aware scoring. Every KPI is marked UTB (upper the better) or LTB (lower the better). Achievement is Actual / Target for UTB and Target / Actual for LTB, so beating a CPC or CPA target scores above 100% instead of looking like a shortfall.
- Thresholds you own. The shipped bands are On Target from 100%, At Risk 95% to 99% and Missed below 95%. They live in ordinary Status formulas on the dashboard sheet and can be changed to whatever your team uses.
- Editable KPI list. Add, rename or remove a KPI on the KPI Definition sheet and the scorecard, the trend page and the group roll-up follow it – you do not rewrite formulas.
- Plain input sheets. Three yellow-cell grids – this year’s actual, this year’s target, last year’s actual – laid out 13 KPIs by 12 months.
- Google Sheets native. Formulas only. No add-ons to install, no Apps Script to authorise, and Drive sharing handles collaboration.
What’s Inside the Search Engine Marketing KPI Dashboard
Home
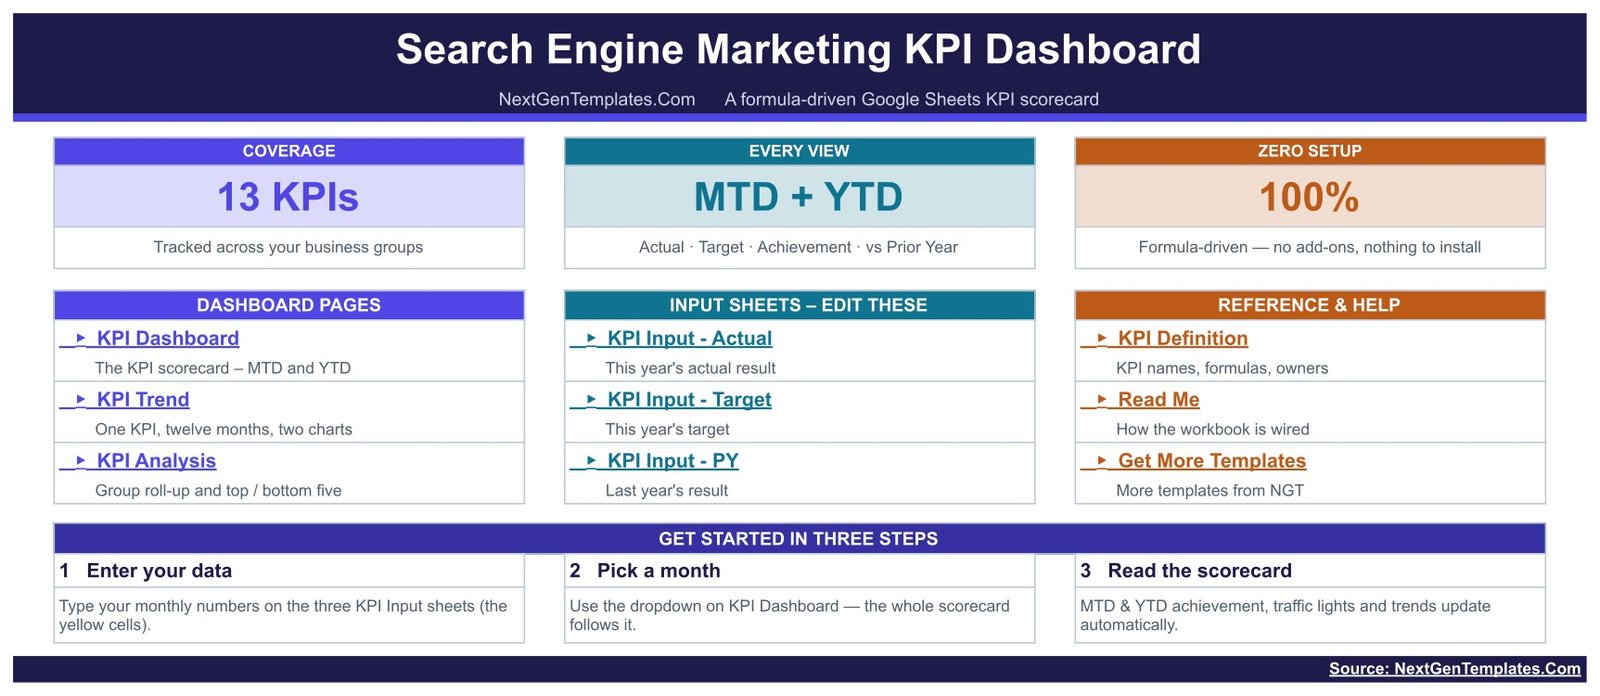
A navigation page that names every sheet in the workbook and explains the three-step routine: enter your data, pick a month, read the scorecard. Cards along the top confirm the scope – 13 KPIs, MTD + YTD, and a formula-driven build with nothing to install.
KPI Dashboard
The scorecard itself. Seven summary cards run across the top – total KPIs tracked, On Target, At Risk and Missed counts, how many are improving against prior year, and average achievement for MTD and YTD. Below them, all 13 KPIs sit in one table with the KPI group, unit and type on the left, the month-to-date block in the middle and the year-to-date block on the right.
KPI Trend
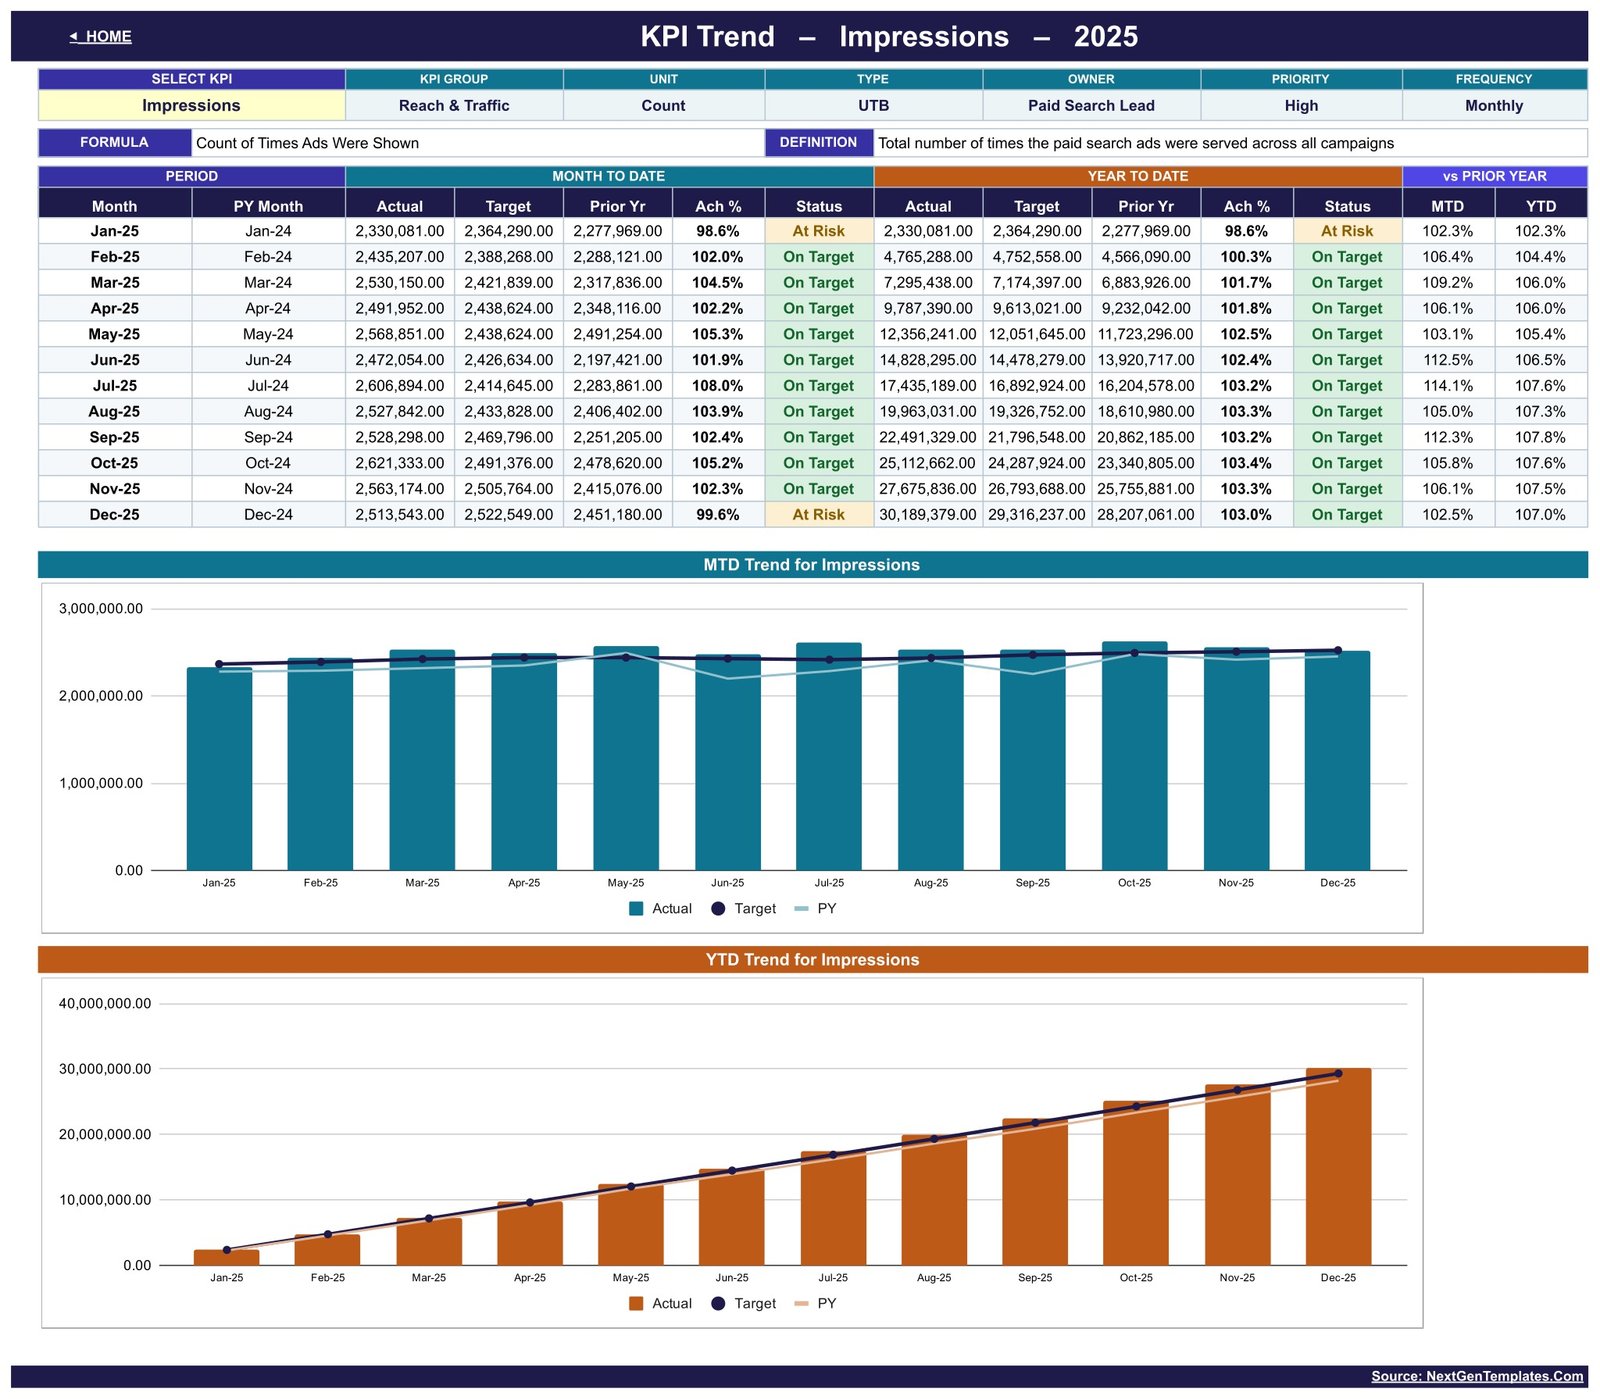
Choose one KPI from a dropdown and the page rebuilds around it: a twelve-row month table with Actual, Target, Prior Yr, Achievement % and status for both MTD and YTD, its owner, priority and frequency pulled from the definition sheet, then two charts – MTD Trend for Impressions and YTD Trend for Impressions in the sample, each plotting Actual against Target and prior year.
KPI Analysis
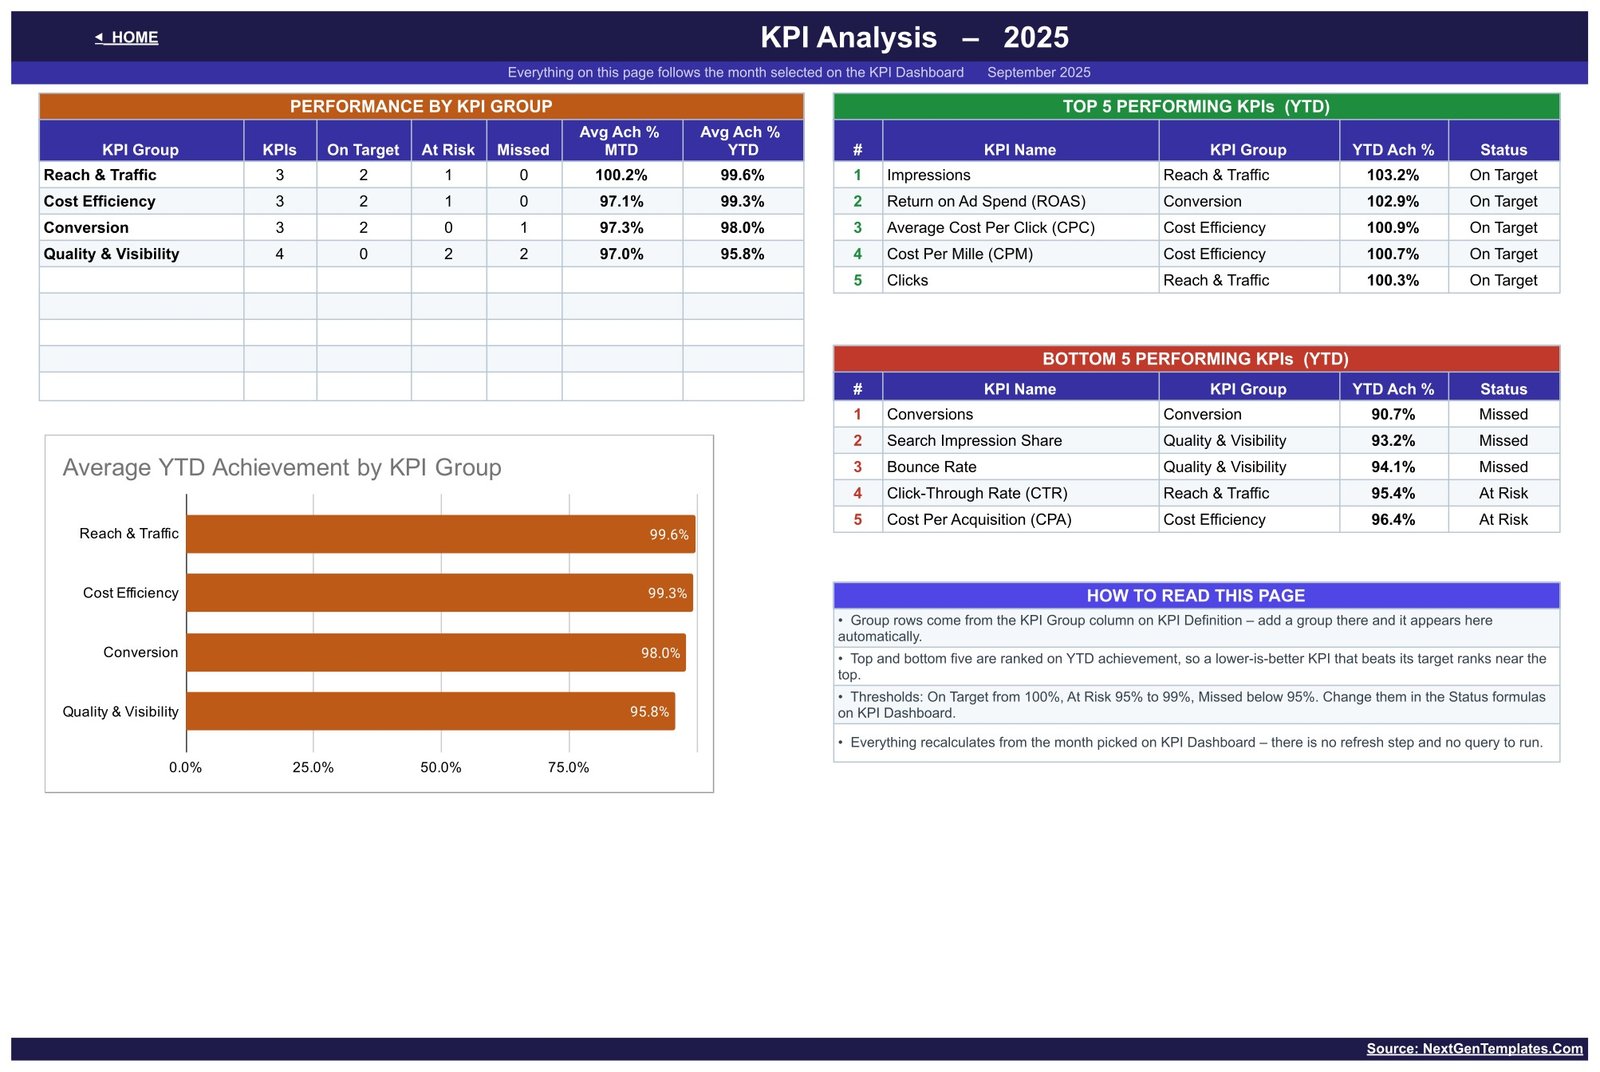
A roll-up of the same month. Performance by KPI Group counts how many KPIs in each group are On Target, At Risk or Missed and averages their MTD and YTD achievement; Average YTD Achievement by KPI Group charts the same figures. Two ranked tables list the top five and bottom five KPIs by year-to-date achievement, and a short How to Read This Page block explains the ranking and the thresholds.
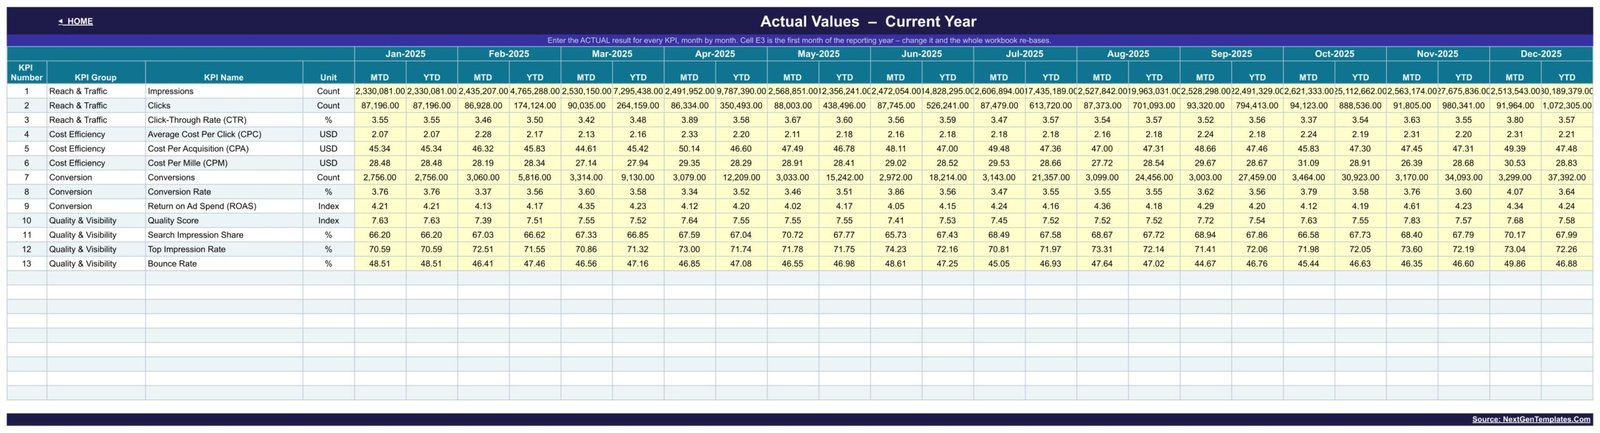
KPI Input – Actual, Target and PY
Three matching grids where all typing happens. Each holds 13 KPI rows against 12 months, with MTD and YTD columns per month, and the first month of the reporting year is set in one cell so the whole workbook re-bases when your financial year does not start in January.
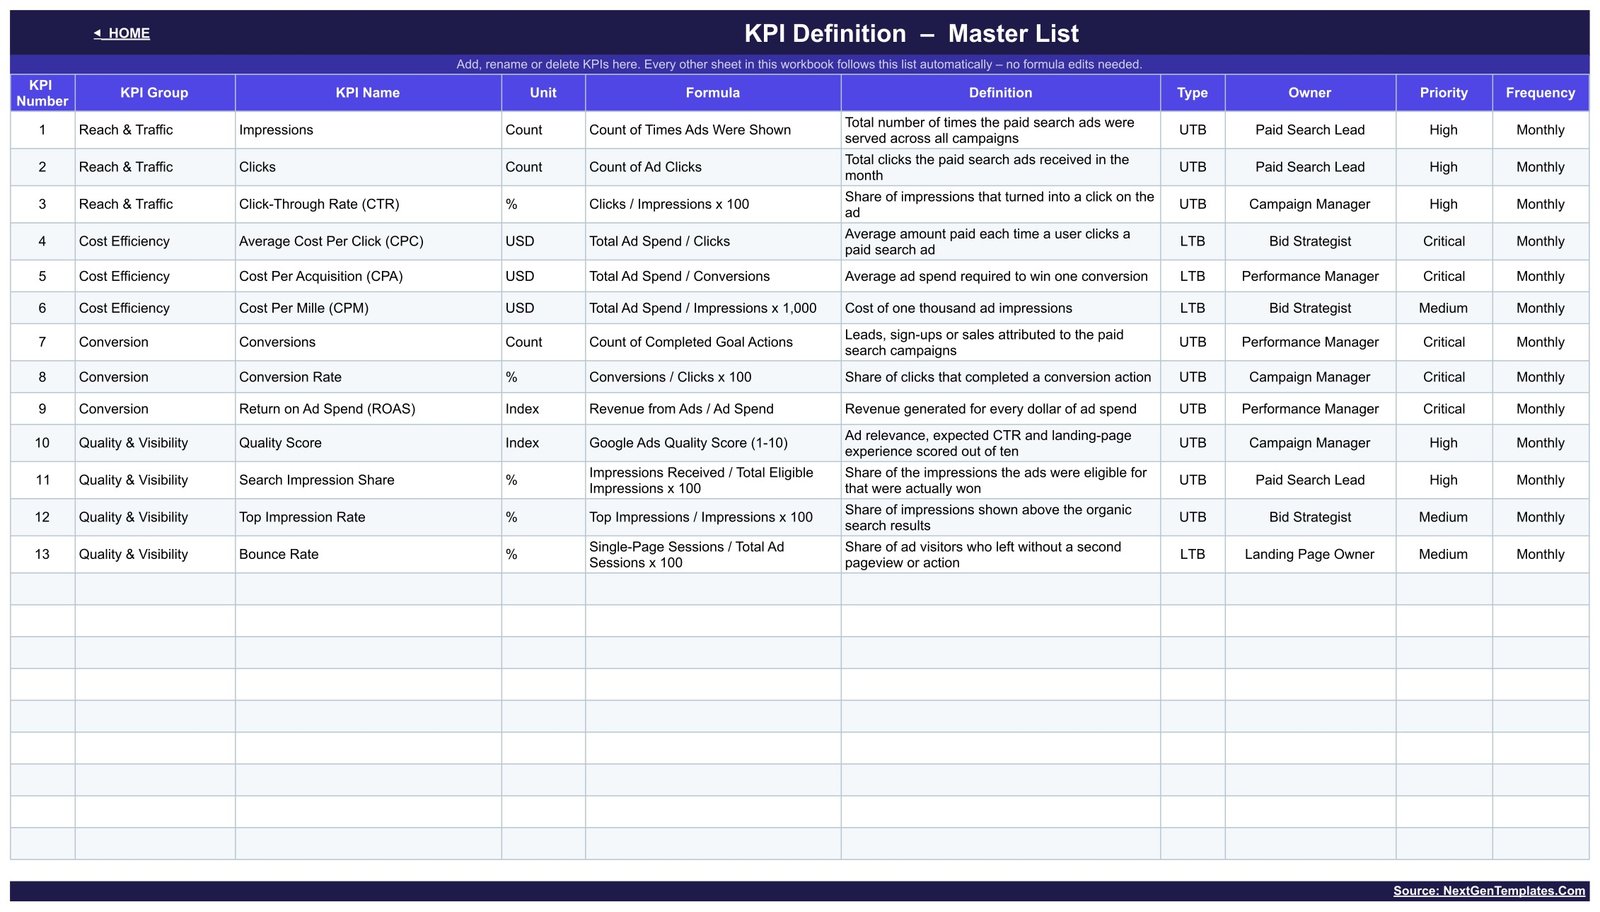
KPI Definition
The master list. Every KPI carries its group, unit, formula in words, a one-line definition, UTB or LTB type, an owner such as Paid Search Lead or Bid Strategist, a priority and a frequency. Edit this sheet and the rest of the workbook follows.
A Read Me sheet explaining how the workbook is wired and a Get More Templates sheet complete the file.
Google Sheets vs. Excel vs. Paid Marketing Reporting SaaS – Where This Fits
| This Google Sheets scorecard | Excel KPI scorecard | Paid reporting SaaS | |
|---|---|---|---|
| Cost | One payment of $9.99 | One payment, similar range | Typically a monthly subscription per user |
| Platform | Google Sheets in any browser | Microsoft Excel desktop | Vendor web app |
| Setup time | Copy the file and type your numbers | Download and open | Account setup and connector authorisation |
| Real-time team collaboration | Yes, native Google Sheets | Only via OneDrive co-authoring | Yes |
| Mobile access | Google Sheets mobile app | Excel mobile app | Vendor app |
| Customisable KPIs | Edit the KPI Definition sheet | Edit the setup sheet | Limited to supported metrics |
| Share with a link | Yes, Drive sharing | File send or cloud link | Yes |
| Year-1 cost at 5 users | $9.99 once | Similar one-off | Recurring, and it keeps recurring |
| Pulls data from ad platforms | No – you enter the numbers | No | Usually yes, via connectors |
| Owns your file | You do, in your own Drive | You do | Vendor hosts it |
This is a manual-entry scorecard. If you need automated connectors, buy a reporting platform. If you want a stable monthly review sheet you fully control, this is the cheaper and simpler answer.
Who This Template Is For – and Who It’s Not For
A good fit for: in-house paid-search managers who report monthly to a marketing lead; small agencies producing a per-client KPI page; freelancers who pull numbers out of a platform’s reporting UI once a month; and finance or leadership readers who want a single tidy page instead of a raw export.
Not for you if: you need automatic data import or a live sync with an ad platform; you want click-level or keyword-level detail rather than monthly KPI totals; you need multi-touch attribution modelling; or you are looking for benchmark CPC, CTR or ROAS figures to compare yourself against – this file contains none, and every target in it is a placeholder you replace.
How to Use the Search Engine Marketing KPI Dashboard
- Open the PDF in your download and click the copy link to put your own copy in Google Drive.
- Open KPI Definition and edit the 13 KPI rows – rename them, change owners, add your own, or delete what you do not report. Set each one UTB or LTB.
- Set the first month of your reporting year in the header cell on the KPI Input – Actual sheet.
- Type this year’s monthly results into KPI Input – Actual, your own targets into KPI Input – Target, and last year’s results into KPI Input – PY. Clear the demo figures as you go.
- Go to KPI Dashboard and choose a month from the dropdown. The scorecard, the summary cards and the analysis page all follow that one selection.
- Use KPI Trend to look at a single KPI across twelve months, and KPI Analysis for the group roll-up and the top and bottom five.
- Share the file from Drive with whoever attends the monthly review.
Real-World Use Cases
Priya, in-house paid search manager. On the first working day of each month she exports her campaign totals, types them into the three input sheets, picks the month and screenshots the scorecard for the marketing stand-up. The At Risk lights tell her which two KPIs to talk about, and the vs PY column answers the inevitable “is that better than last year?”.
Daniel, two-person search agency. He keeps one copy of the file per client. Because the KPI list is editable, an e-commerce client gets ROAS and CPA near the top while a lead-generation client gets Conversions and Cost Per Acquisition, and both still read the same way.
Ravi, marketing operations analyst. He owns the targets. Rather than arguing over a spreadsheet of raw exports, he sets each KPI’s target once a quarter on the Target sheet and lets the Achievement % and traffic lights carry the conversation.
Frequently Asked Questions
Does this connect to Google Ads, Microsoft Advertising or Google Analytics?
No. There is no API connection, no connector, no add-on and no automatic import or refresh. You enter every number yourself on the three KPI Input sheets. That is a deliberate design choice – it keeps the file working forever without authorisations breaking.
Are the numbers in the screenshots real?
No. Every figure shown – impressions, clicks, CPC, ROAS, the status lights, the top and bottom five – is demo data included so the workbook looks alive before you fill it. Delete it and type your own.
Are the targets industry benchmarks?
No. Every target is a placeholder value in an editable cell. This template makes no claim about what a good CPC, CTR, CPA or ROAS looks like in your market, and it does not guarantee any advertising outcome.
Can I change which KPIs are tracked?
Yes. The KPI Definition sheet is the master list. Rename, add or delete rows there and the dashboard, trend and analysis pages pick the change up automatically. Set the UTB / LTB type so the scoring stays correct.
The Quality Score row mentions a 1-10 score. Where does that come from?
You type it in from whatever reporting you already use. The KPI Definition sheet describes the metric in words; the workbook itself does not read it from anywhere.
How is this different from the analytical Google Sheets dashboards you sell?
This is a KPI scorecard – a month picker, a fixed KPI list, targets, traffic lights and trend pages. The analytical dashboards, such as the Advertising Dashboard in Google Sheets, work the other way: you paste a transaction-level table and slice it. Different tools – plenty of teams keep one of each.
Do I need Excel or any paid software?
No. A free Google account and a browser are enough. Nothing to install and no macros.
About the Author
Built by PK – Microsoft Certified Professional with 15+ years of Excel, Google Sheets, and Power BI experience. Founder of NextGenTemplates, reaching 300K+ subscribers across YouTube channels. Every template is hand-built and tested before release.
Explore Related Templates
- PPC Campaign KPI Dashboard in Google Sheets – the paid-campaign companion scorecard.
- Keyword Performance KPI Dashboard in Google Sheets – keyword-level reporting.
- Organic Search KPI Dashboard in Google Sheets – the organic half of the picture.
- SEO Content Performance KPI Dashboard in Google Sheets – content and ranking KPIs.
- Web Development KPI Dashboard in Google Sheets – the landing-page side.
- Browse the full Google Sheets KPI Dashboard category or the wider Google Sheets Dashboard category.
Get the Search Engine Marketing KPI Dashboard in Google Sheets today – one payment, instant download, and a copy link that puts the file in your own Drive in seconds. A full walkthrough is on the blog: Search Engine Marketing KPI Dashboard in Google Sheets.
Watch the step-by-step video Demo:
Last updated: 17 August 2026.































Reviews
There are no reviews yet.