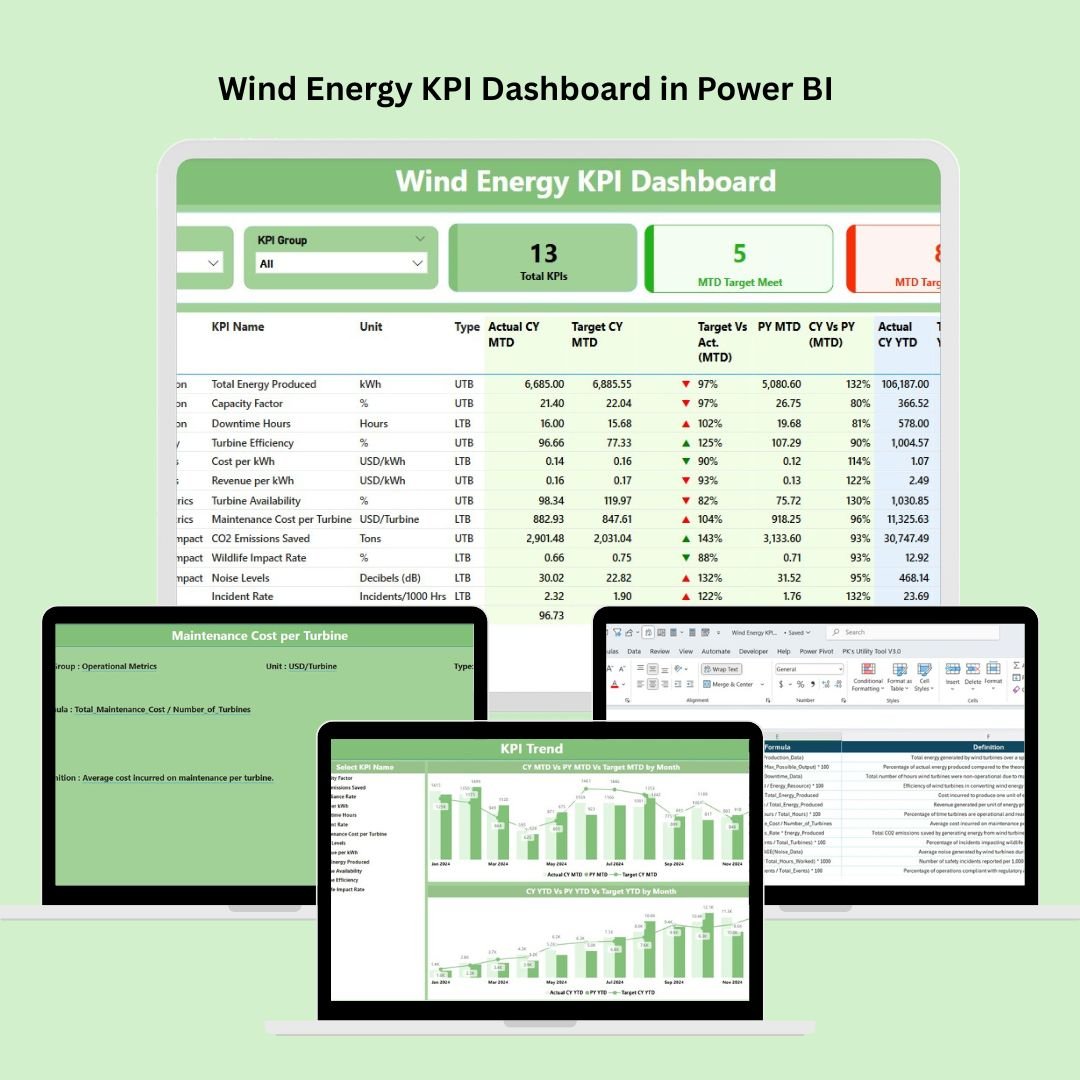

As the global focus shifts toward sustainable energy, effective performance tracking is more critical than ever. That’s where the Wind Energy KPI Dashboard in Power BI becomes your ultimate tool for decision-making. Built with powerful visuals, intelligent drill-throughs, and Excel-based data input, this dashboard helps energy professionals monitor key metrics, spot inefficiencies, and stay aligned with energy goals.
Whether you’re managing turbine performance, operational costs, or energy output, this interactive Power BI solution gives you clarity, accuracy, and control—all in one place.
✨ Key Features of the Wind Energy KPI Dashboard
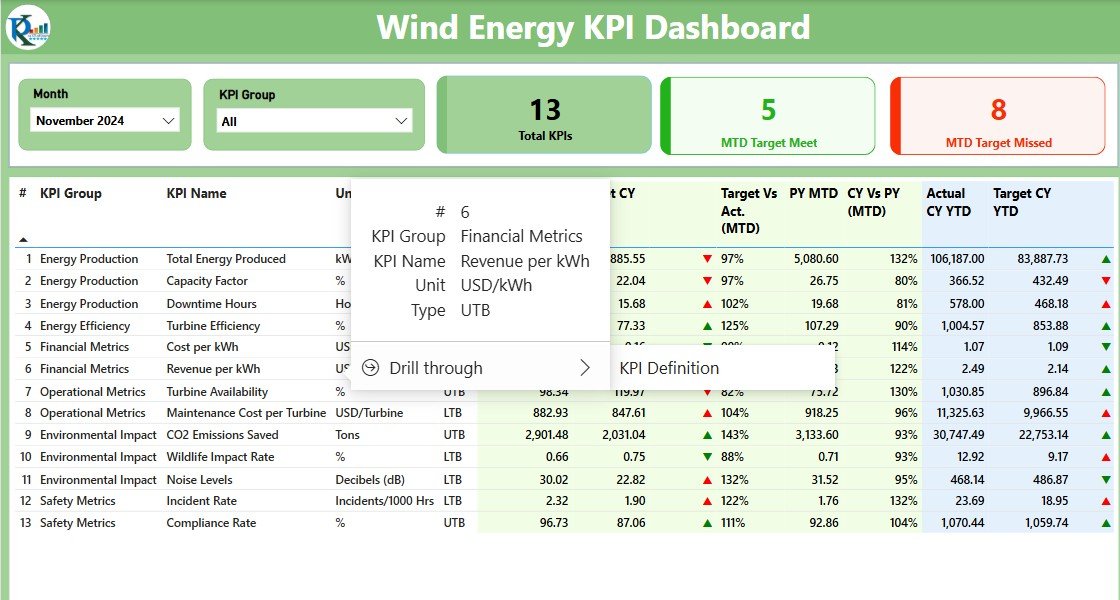
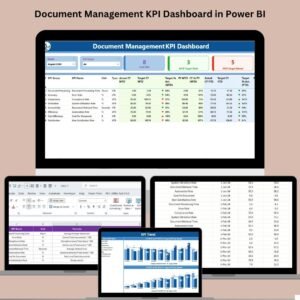
📊 Summary Dashboard Page
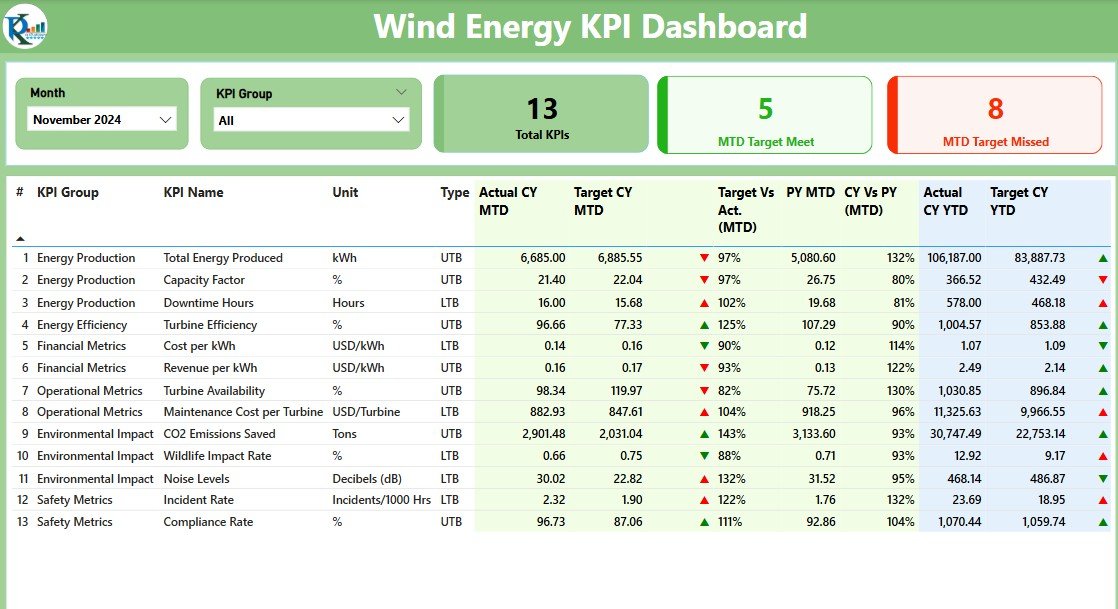
Track essential wind energy KPIs with dynamic cards and slicers:
-
Month & KPI Group Slicers – Filter results instantly
-
KPI Cards – Total KPIs, MTD Target Met, MTD Target Missed
-
Main Table – Displays all MTD and YTD metrics with icons, percentages, and year-on-year comparison
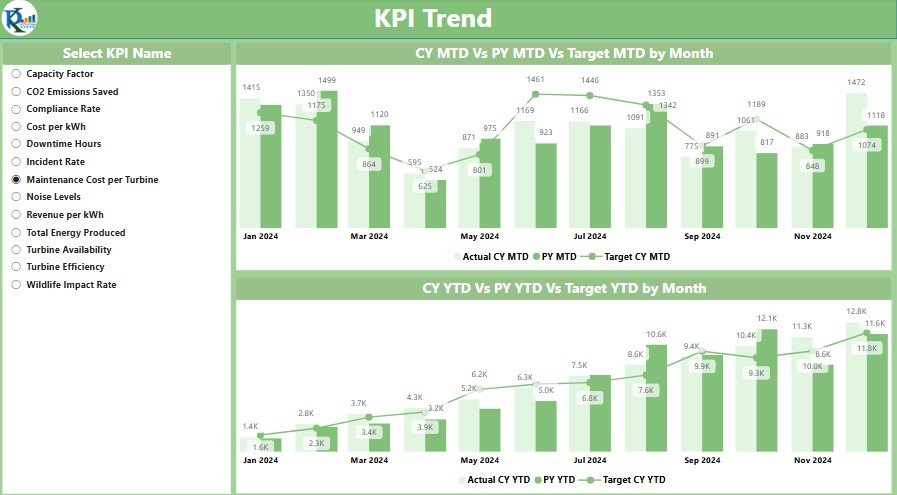
⚡ KPI Trend Page
Zoom in on specific KPIs with interactive trend charts:
-
Combo charts for Actual vs Target vs PY
-
KPI selector slicer for focused analysis
-
MTD and YTD trend views
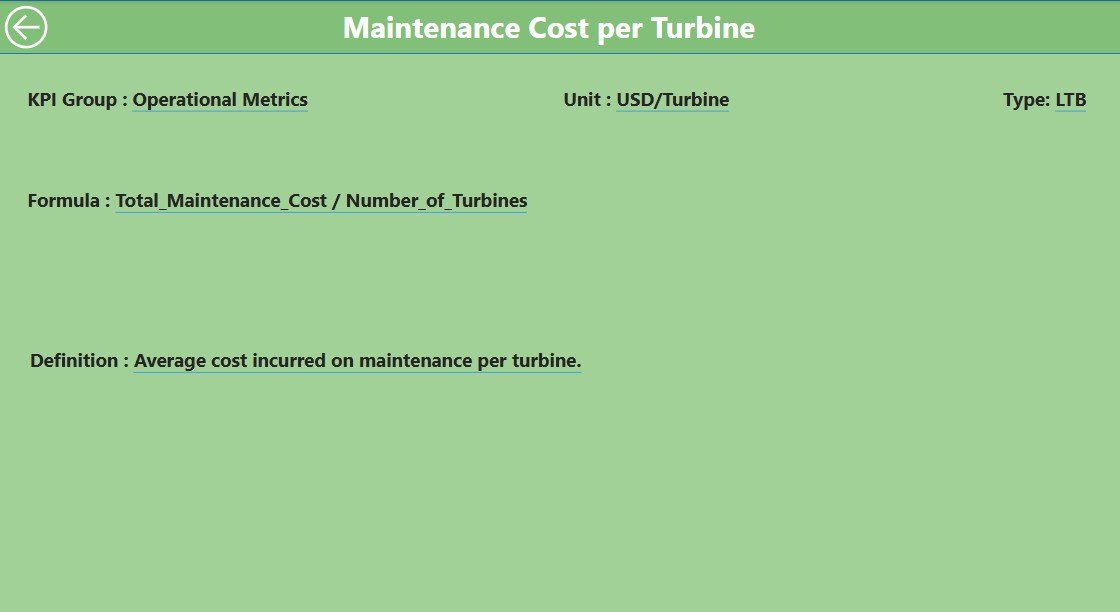
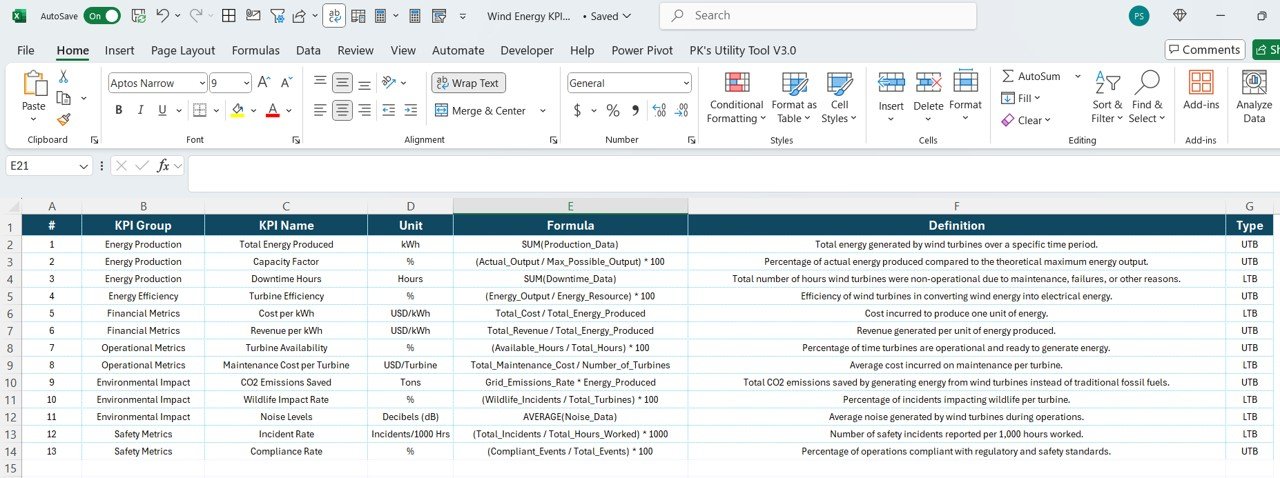
📘 KPI Definition Page (Drill-through enabled)
Get detailed information for every KPI:
-
Definition, formula, type (UTB or LTB), and unit
-
Automatically accessible via right-click drill-through from Summary Page
-
Includes back button for quick navigation
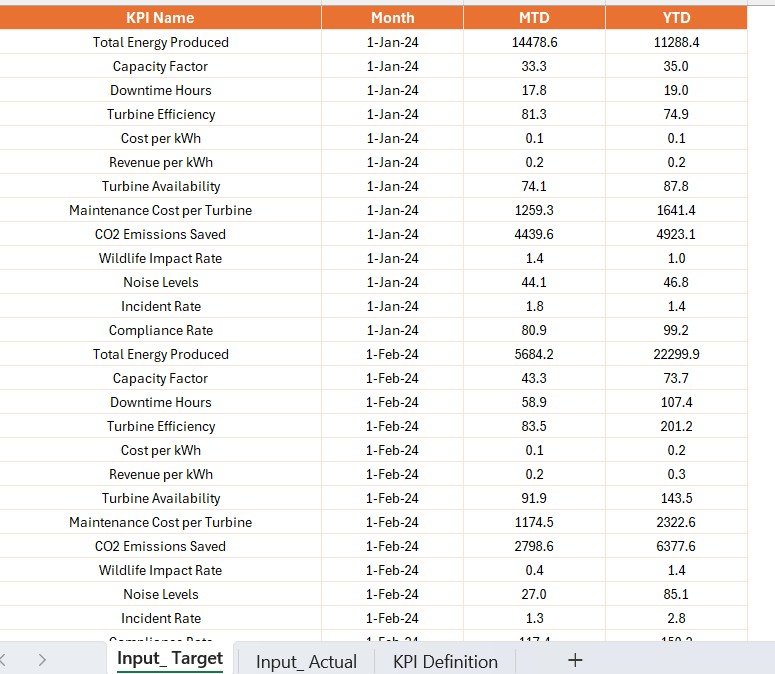
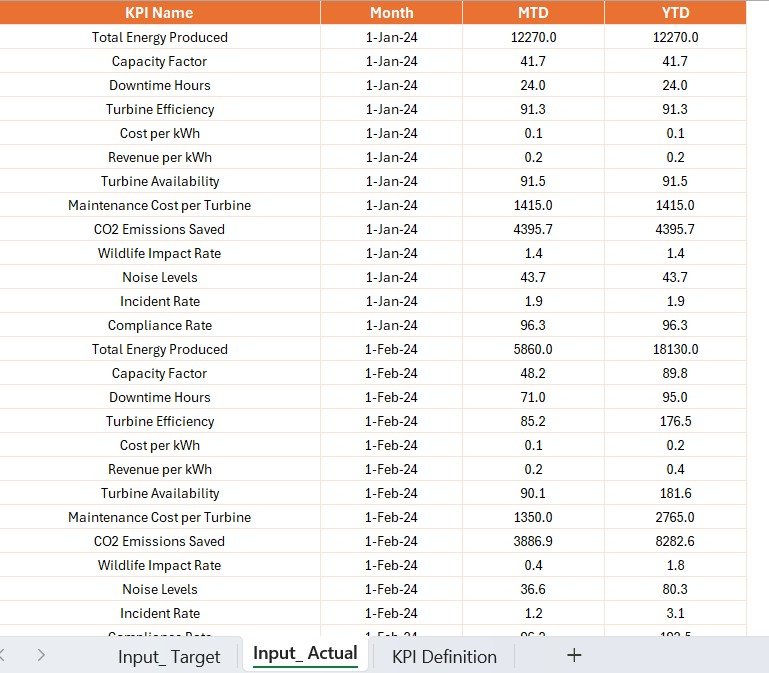
🧾 Excel-Based Data Model
Power BI connects with a structured Excel file:
-
Input Actual Sheet – MTD/YTD values
-
Input Target Sheet – Monthly targets
-
KPI Definition Sheet – Name, formula, unit, and more
📂 What’s Included in the Dashboard Package?
✔️ 3 Power BI Pages – Summary, KPI Trend, KPI Definition
✔️ Excel Template – Preformatted sheets for actuals, targets, and KPI definitions
✔️ Drill-Through Functionality – Explore KPI definitions directly from visuals
✔️ Slicers & Filters – Month, KPI group, and KPI-specific selections
✔️ Conditional Formatting – Red/Green arrows to show performance instantly
👥 Who Can Use This Dashboard?
🌬️ Energy Analysts – Monitor daily, monthly, and annual output
📈 Project Managers – Track targets and ensure KPIs are met
⚙️ Operations Teams – Identify and troubleshoot underperforming turbines
🌱 Sustainability Officers – Align reporting with environmental benchmarks
🧠 Executives – Get high-level summaries and deep-dive capabilities in one tool


Reviews
There are no reviews yet.