

In today’s fast-paced digital landscape, tracking and optimizing your advertising efforts is no longer optional—it’s a necessity. That’s why we created the Media Buying KPI Dashboard in Power BI—a ready-to-use, fully interactive dashboard built to empower marketers and media buyers with real-time insights and data-driven decisions. 🚀📈
With just a few clicks, you can monitor all your essential KPIs like Cost Per Acquisition (CPA), Click-Through Rate (CTR), ROI, and more—all in one place. Whether you’re running Facebook Ads, Google Ads, or programmatic campaigns, this dashboard helps you make smarter media buying decisions, faster.
🔑 Key Features of the Media Buying KPI Dashboard in Power BI
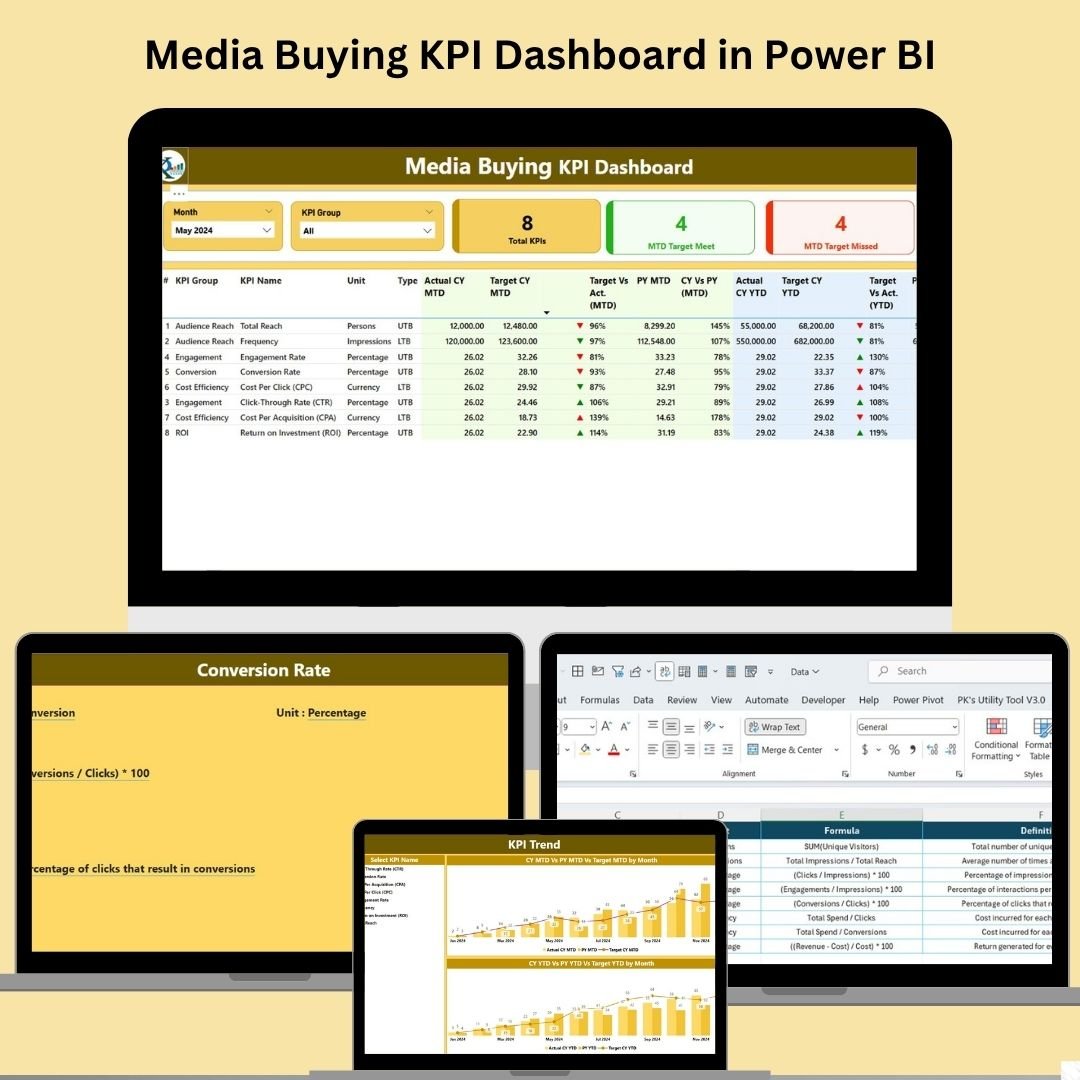
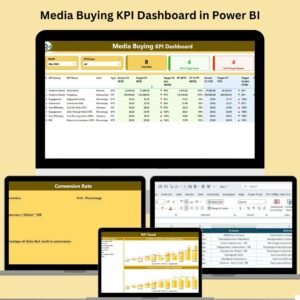
🎯 Summary Page Overview
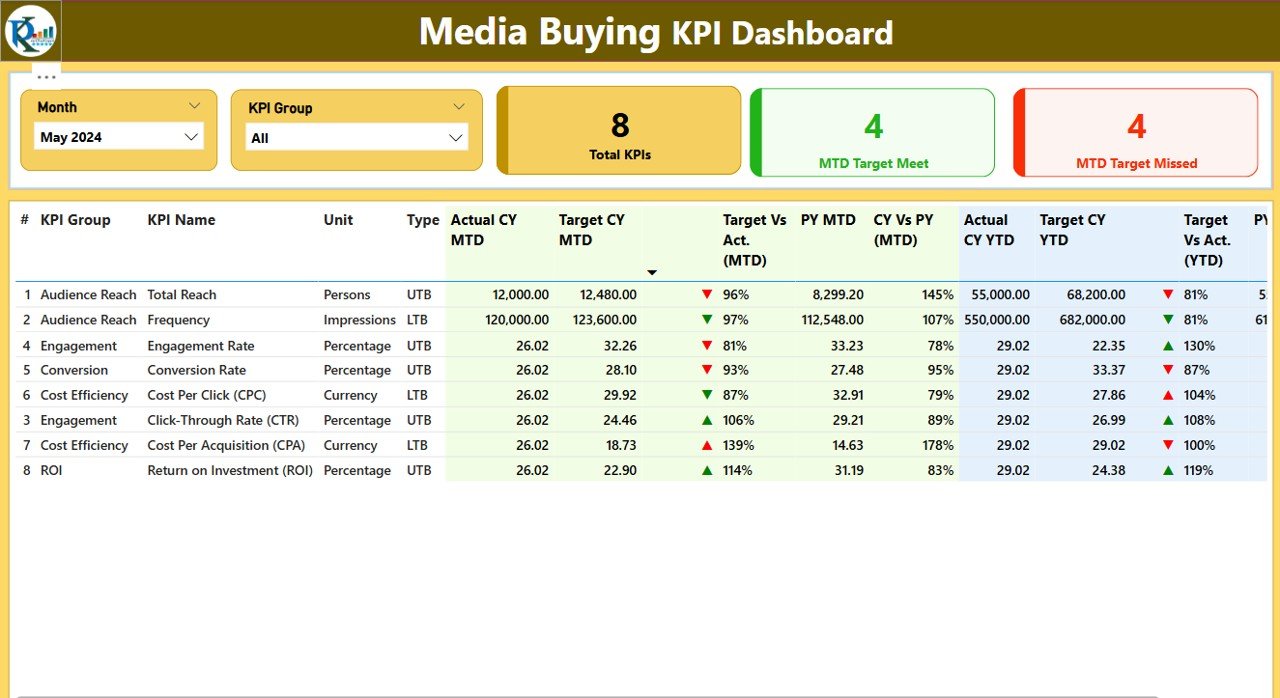
Month & KPI Group Slicers to filter data by campaign period or category
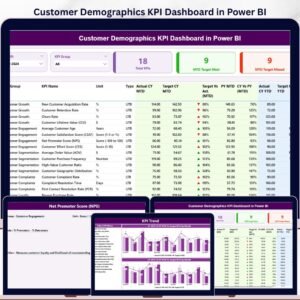
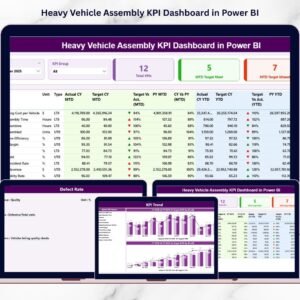
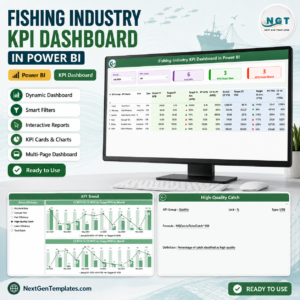
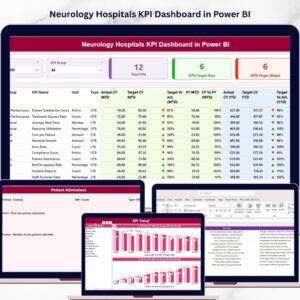
KPI Cards to instantly see total KPIs, MTD Target Met, and Missed Counts
Detailed KPI Table with actuals, targets, performance indicators, and trend comparisons
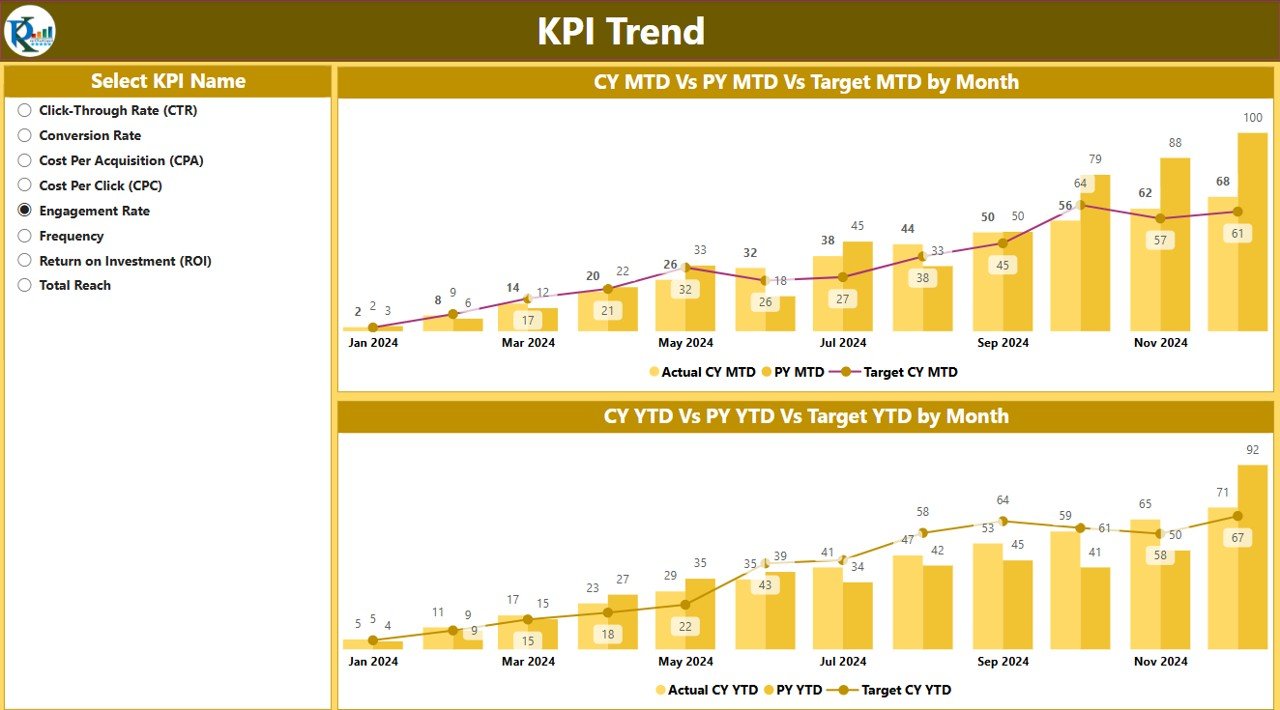
📊 KPI Trend Page
Two powerful combo charts showing MTD/YTD performance vs. targets
Select any KPI using the KPI Slicer and track results visually over time
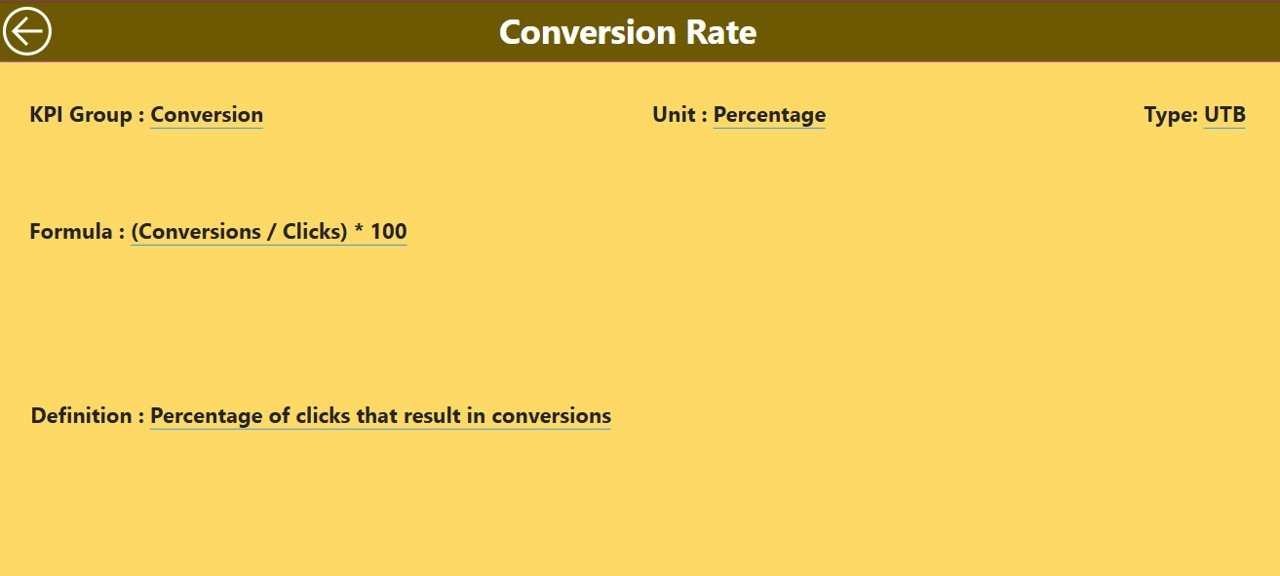
📖 KPI Definition Page
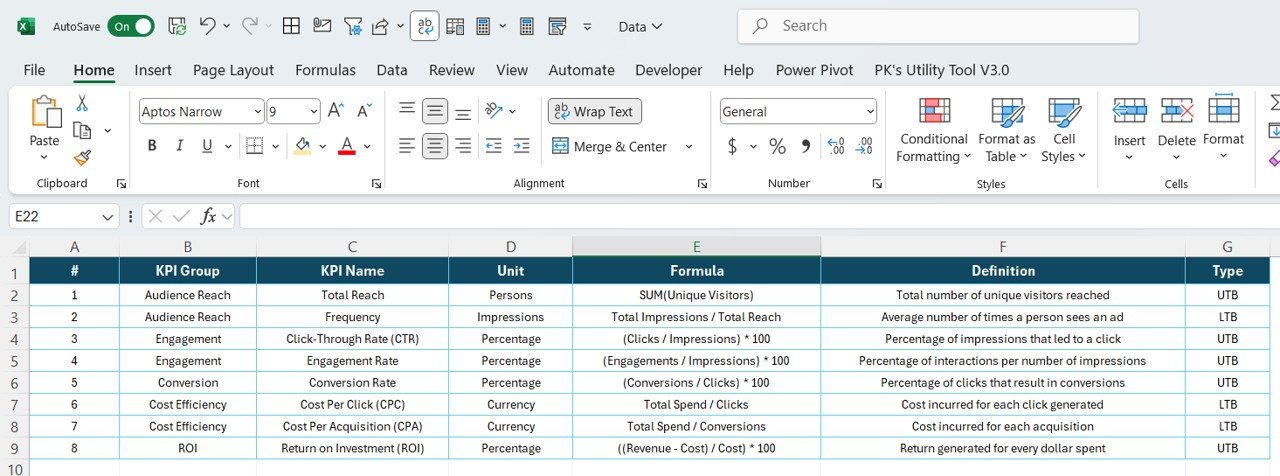
Drill-through enabled definitions of each KPI
Shows formula, meaning, and business impact
Back button for smooth navigation
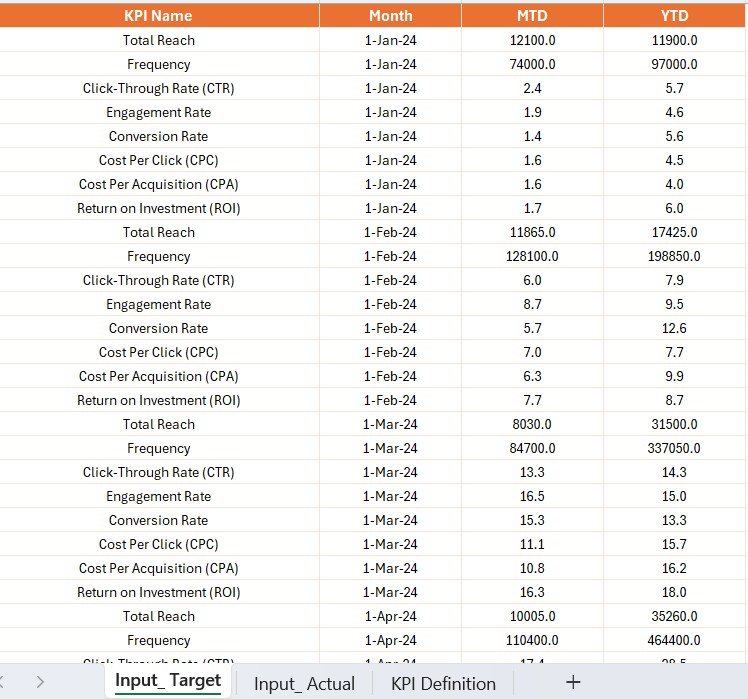
📂 Excel Data Integration
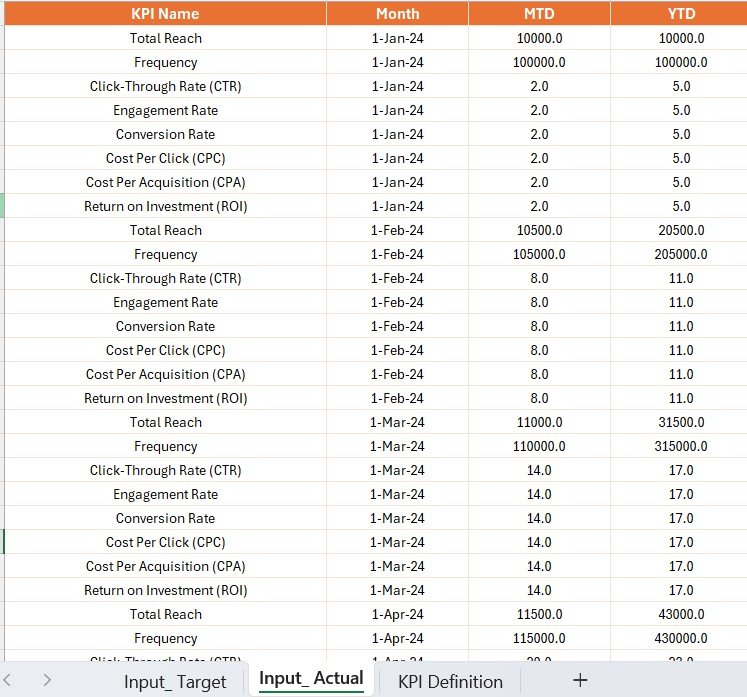
Pulls data directly from Excel worksheets
Input_Actual– for actualsInput_Target– for monthly targetsKPI_Definition– for metadata and formulas
Makes data management super easy and refreshes seamless
💡 Visual Alerts with Icons
Green and Red indicators instantly show whether KPIs are on track or underperforming
Compare CY MTD vs. PY MTD in seconds
🛠️ Customizable & Scalable
Tailor the dashboard to your business: Add or remove KPIs, change slicers, or update visualizations
Ideal for agencies, freelancers, or in-house teams
📦 What’s Inside the Product
Power BI File (.pbix) with fully built dashboard
Excel Data File with 3 sheets: Actuals, Targets, Definitions
Pre-Connected Visuals & Slicers – no setup needed
Drill-Through & Back Navigation for ease of use
Dynamic Charts for MTD, YTD, and trend analysis
🧠 How to Use the Product
💾 Open the Power BI Dashboard file
📥 Load or update your Excel source data
🧮 Use slicers to filter by Month or KPI Group
📊 Review key metrics and performance visuals
🔍 Drill through to explore KPI formulas and meanings
💡 Make smarter, faster campaign decisions
👥 Who Can Benefit from This Dashboard?
📢 Digital Marketers & Media Buyers – track ROI, CTR, CPA in real-time
📈 Performance Marketing Teams – monitor trends and improve cost efficiency
💼 Ad Agencies – impress clients with data-backed media insights
📊 Business Analysts – visualize campaign performance with clarity
🧠 Marketing Consultants – back strategies with solid metrics
🧰 In-house Marketing Teams – optimize media spend without needing to build reports from scratch
🔗 Click here to read the Detailed blog post
🎥 Visit our YouTube channel to learn step-by-step video tutorials















Reviews
There are no reviews yet.