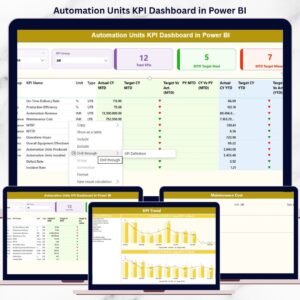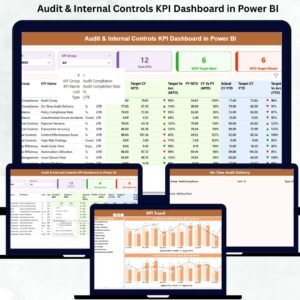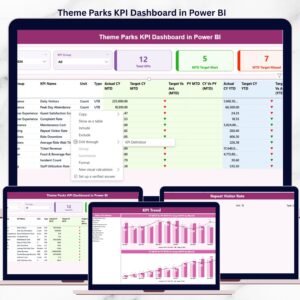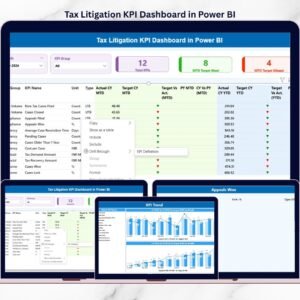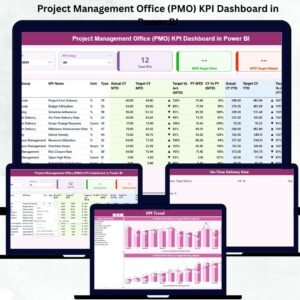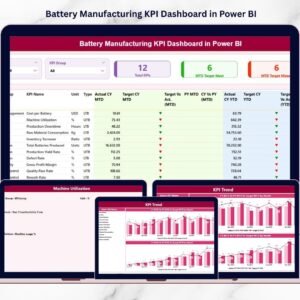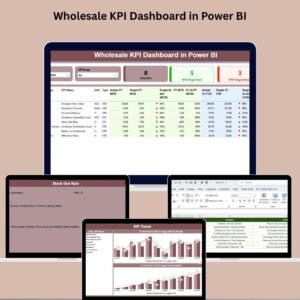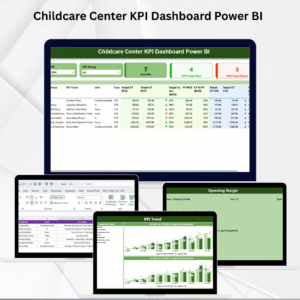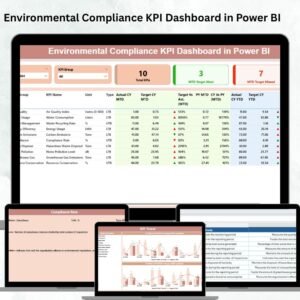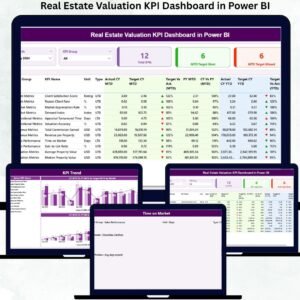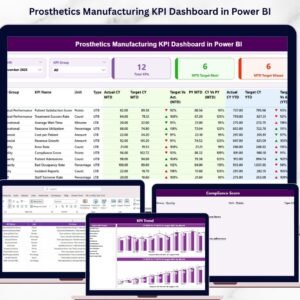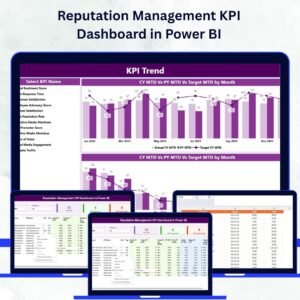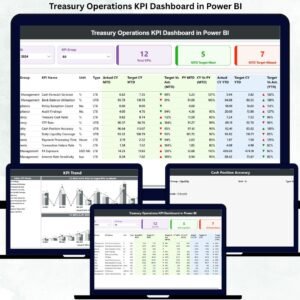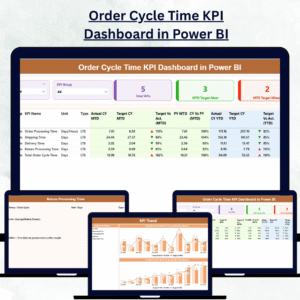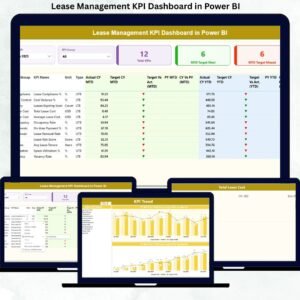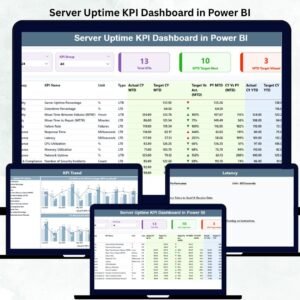
🥋 Key Features of Martial Arts Studio KPI Dashboard in Power BI
📊 All-in-One Performance Dashboard
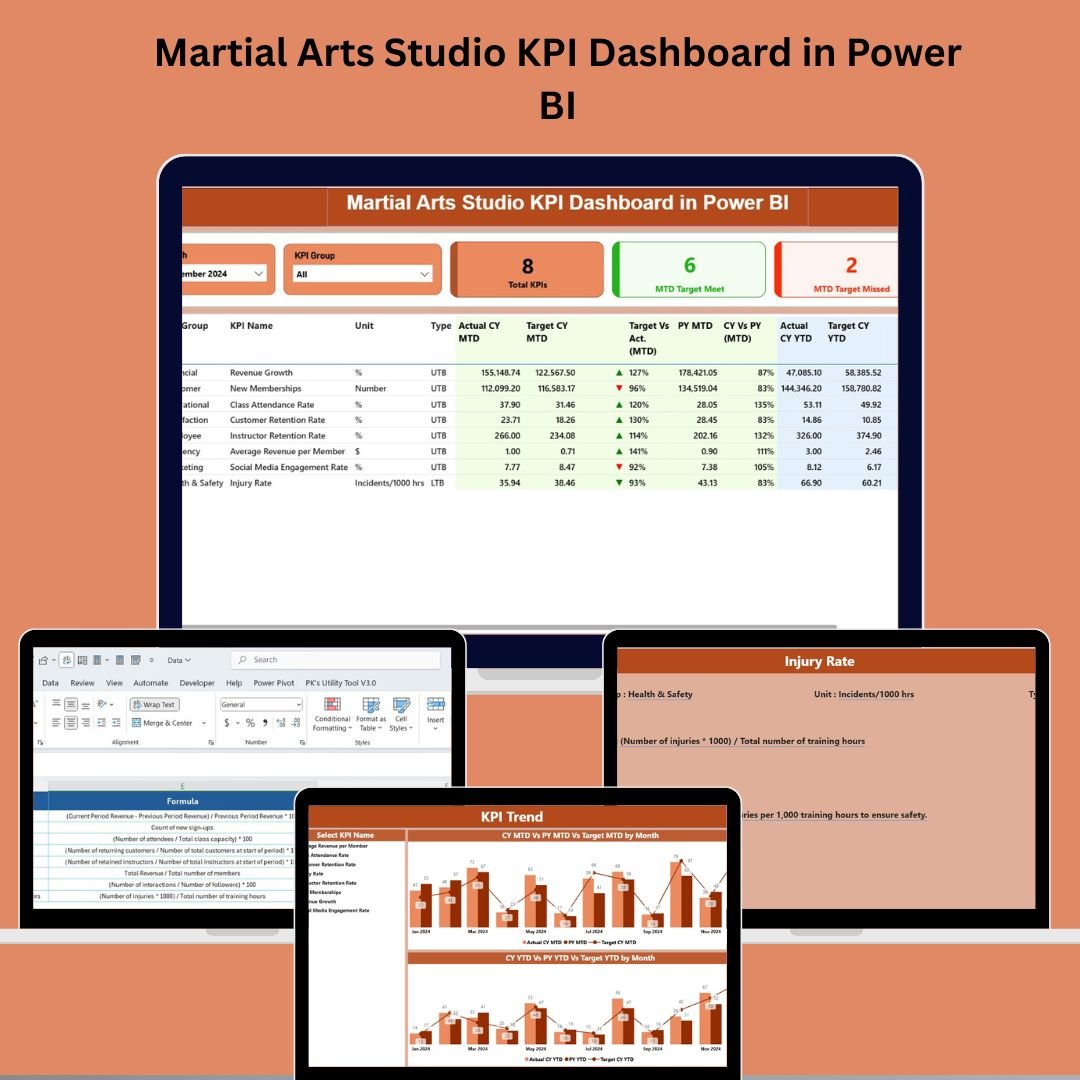
Track class attendance, student enrollments, instructor metrics, and financial KPIs—all from one interactive, visual dashboard powered by Power BI.
⏱️ Real-Time Monitoring with MTD & YTD Insights
Get a clear picture of Month-to-Date (MTD) and Year-to-Date (YTD) performance metrics. Know instantly whether your studio is meeting its targets.
🧠 Smart KPI Cards & Target Indicators
Visual cues show if your KPIs are on track—green for met, red for missed, with % variance and CY vs PY comparisons at a glance.
📈 Trend Analysis for KPI Growth
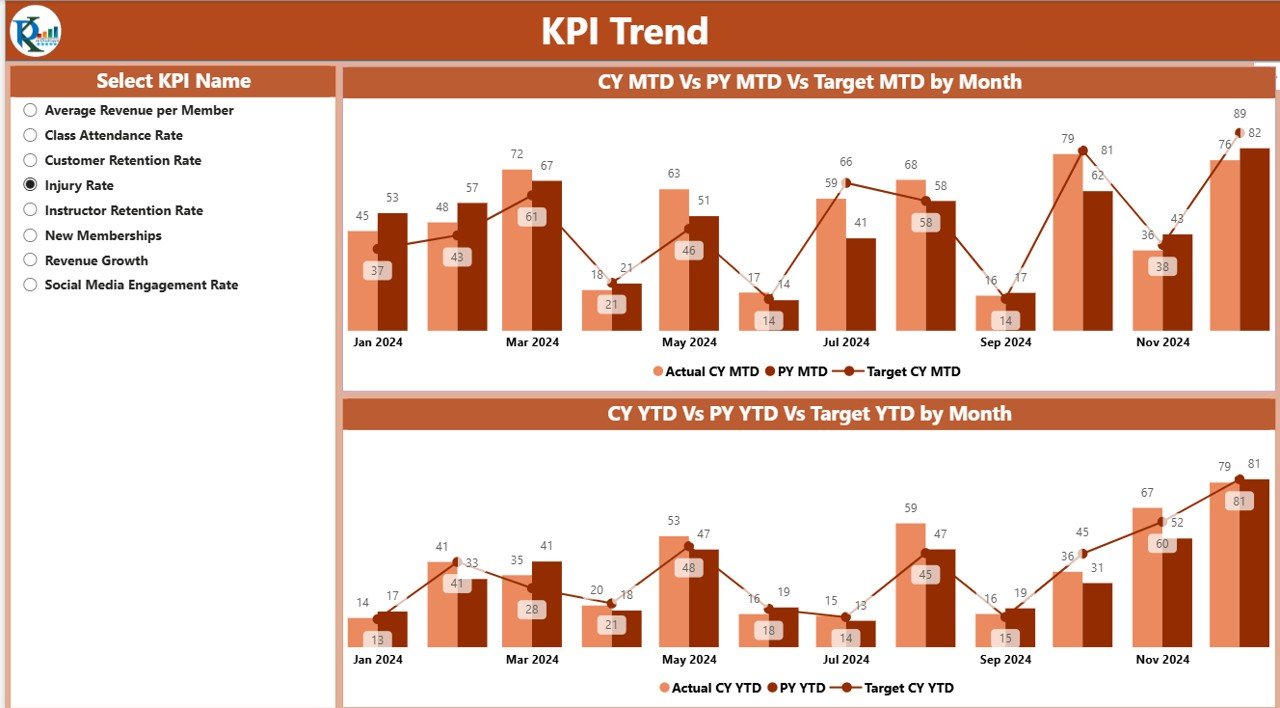
Use combo charts to visualize MTD and YTD progress over time. Identify seasonal trends and analyze campaign impact on enrollments or revenue.
🔍 Drill-Through KPI Definitions
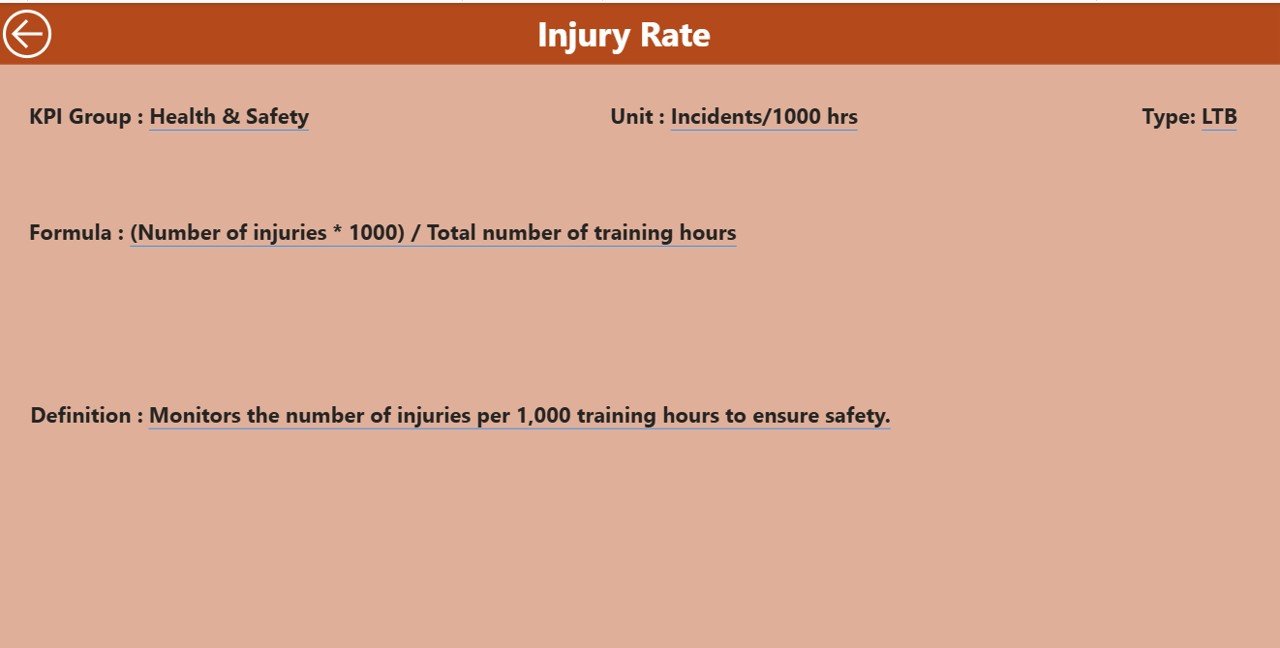
Click to explore detailed KPI formulas, units, and classification (LTB/UTB). Understand each metric before taking action.
📥 Excel-Powered & Easy to Update
Maintain your performance data through three simple Excel sheets: Actual, Target, and KPI Definition. No technical setup needed.
📎 Slicers for Dynamic Filtering
Filter KPIs by Month and KPI Group to focus on Finance, Operations, Training, or HR—all without leaving the dashboard.
🚀 No Coding Needed
This Power BI solution is fully plug-and-play. Just connect your data, refresh, and you’re ready to analyze.
📂 What’s Inside the Martial Arts Studio KPI Dashboard
✅ Power BI File (.pbix) – Prebuilt dashboard file linked to Excel data
✅ 3 Powerful Pages:
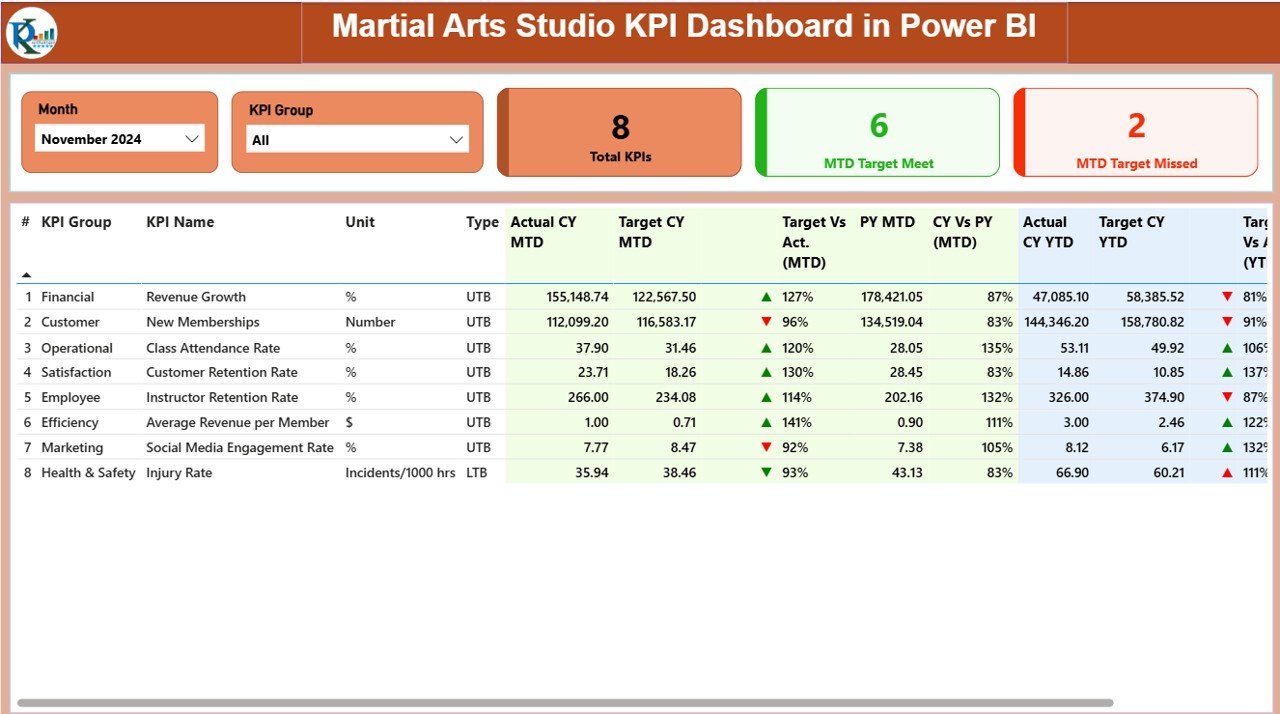
Summary Page – High-level view of MTD/YTD performance and KPI status
KPI Trend Page – Analyze Actual vs Target vs Previous Year using combo charts
KPI Definition Page – Drill-through view for definitions, formulas, and classifications
✅ Excel Data Source (3 Tabs):
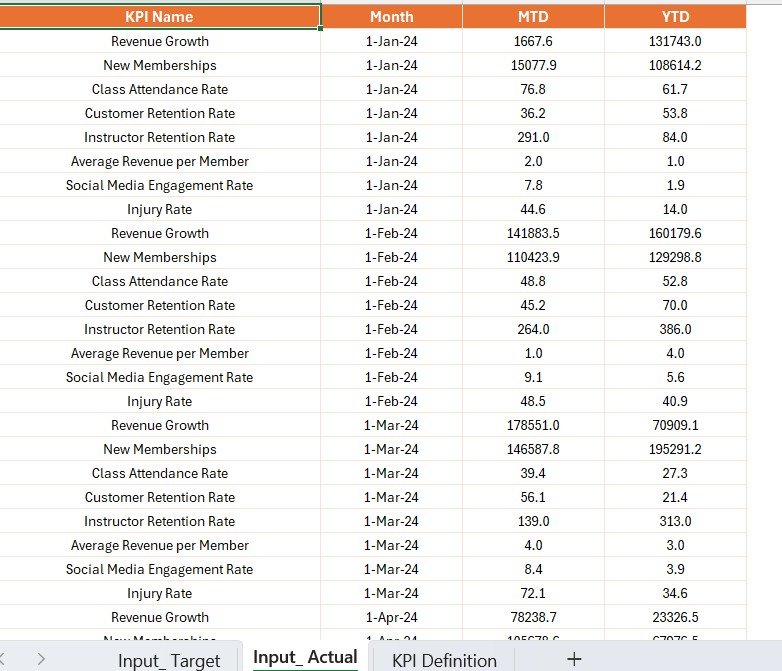
Input_Actual Sheet – Record MTD and YTD actual values
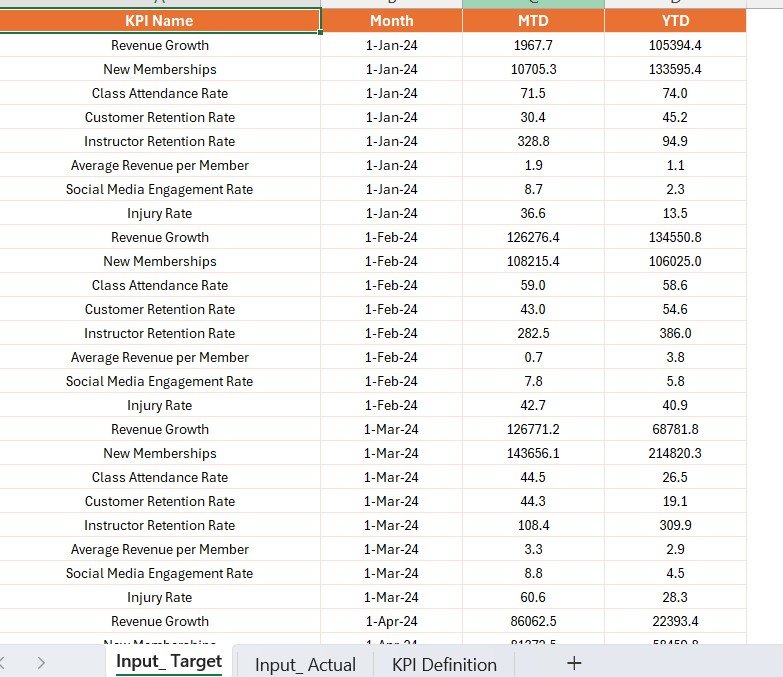
Input_Target Sheet – Record targets in the same format
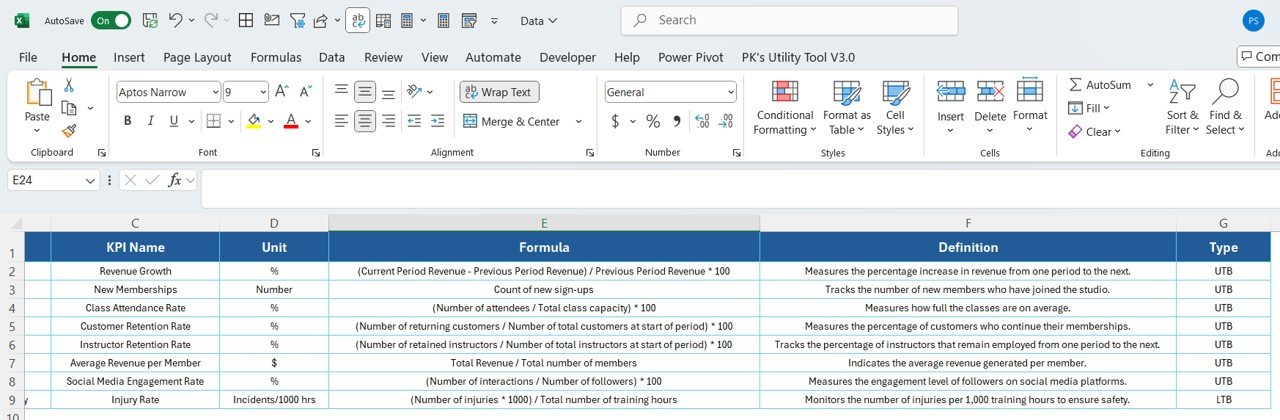
KPI Definition Sheet – Store formulas, types (LTB/UTB), units, and descriptions
✅ Interactive Elements:
Slicers for Month and KPI Group
Target achievement indicators (✔ or ✘)
CY vs PY comparison metrics
Navigation buttons for seamless page jumps
⚙️ How to Use the Martial Arts Studio KPI Dashboard
🧾 Step 1: Prepare Your Excel File
Define your KPIs, enter actual and target numbers, and complete the KPI Definition sheet.
📂 Step 2: Open Power BI Desktop
Load the .pbix file and connect it to your Excel file. Hit Refresh to populate visuals.
🧭 Step 3: Navigate Between Pages
Use the page navigator or slicers to switch between views and KPI groups (Finance, Training, Operations, etc.).
📈 Step 4: Review KPIs and Trends
Use the Summary and Trend pages to understand current vs target performance. Use icons and variance % to spot underperformance.
🔍 Step 5: Drill Down for Clarity
Click any KPI to jump to the Definition page, where you’ll see its formula, type, and explanation.
📤 Step 6: Export Reports
Need to present to stakeholders? Export the dashboard visuals or pages as PDFs.
👥 Who Can Benefit from This Dashboard
🥋 Studio Owners – Understand every angle of your business—from finance to operations
📋 Operations Managers – Track instructor hours, class schedules, and resource allocation
📈 Lead Instructors – Monitor training efficiency and student engagement
🏢 Franchise Chains – Scale reporting across branches with minimal effort
💼 Finance & Marketing Teams – Use data to optimize campaigns and budgets
Whether you’re running a local dojo or managing a franchise network, this dashboard empowers you to take data-driven decisions.