


🌬️ Key Features of Wind Energy KPI Dashboard in Google Sheets 🌬️
The Wind Energy KPI Dashboard in Google Sheets is a powerful, customizable tool designed to help you monitor and analyze key performance indicators (KPIs) related to wind energy generation. Whether you’re managing a small wind turbine or a large wind farm, this dashboard allows you to track essential metrics such as energy production, operational efficiency, maintenance costs, and ROI. It consolidates data in an intuitive, visually appealing format that provides real-time insights for stakeholders in the wind energy sector.
This ready-to-use template is built on Google Sheets, offering flexibility, real-time data updates, and collaboration features, making it a cost-effective solution for wind energy management.
📝 What’s Inside the Wind Energy KPI Dashboard 📝
The Wind Energy KPI Dashboard includes several key sheets to track critical data and performance metrics:
-
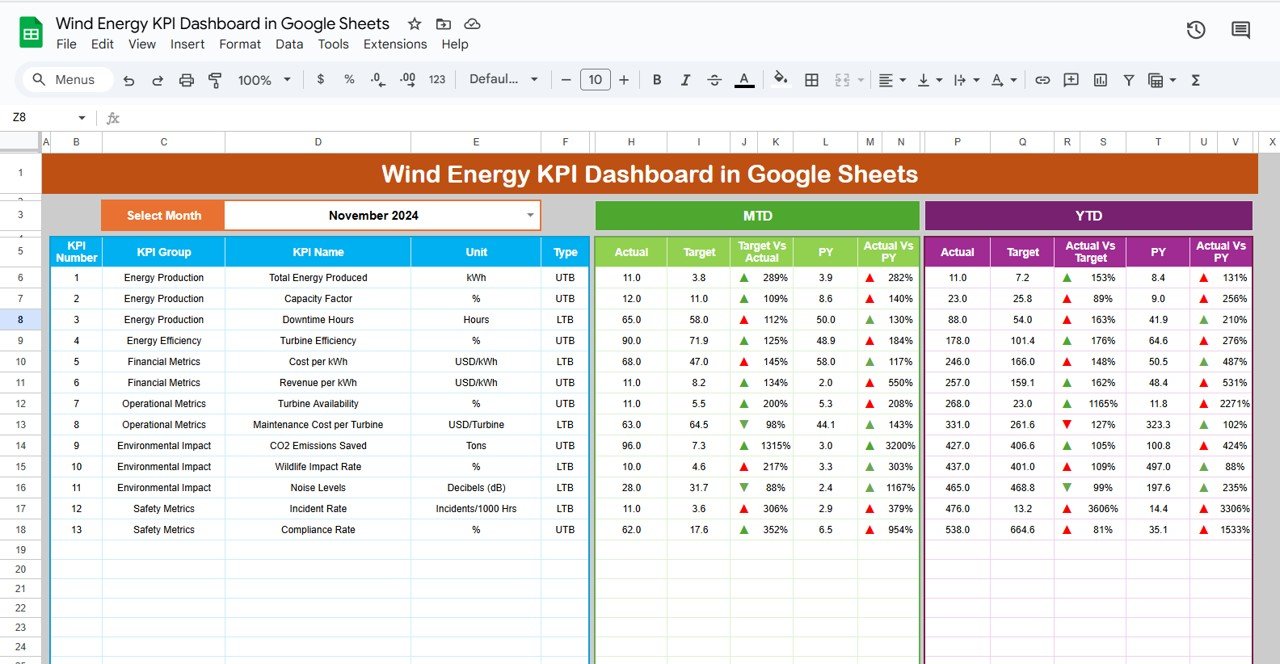
Dashboard Sheet Tab
-
Key Metrics Cards: Get an instant overview of your performance with cards displaying:
-
Energy Generated (kWh): Total energy produced by your wind system.
-
Efficiency: Measures the overall efficiency of the wind energy system.
-
Maintenance Costs ($): Tracks the costs associated with maintenance.
-
ROI ($): Shows the return on investment for your wind energy assets.
-
Capacity Factor (%): Measures the actual energy produced vs. the maximum potential energy.
-
-
Dynamic Charts: Visualize performance over time with various charts:
-
Energy Generation by Month: Track energy production trends.
-
Operational Efficiency Over Time: Monitor improvements or declines in system efficiency.
-
Cost vs. Energy Generation: Compare maintenance costs with energy generation.
-
Performance by Wind Turbine: Analyze performance by individual turbines.
-
-
-
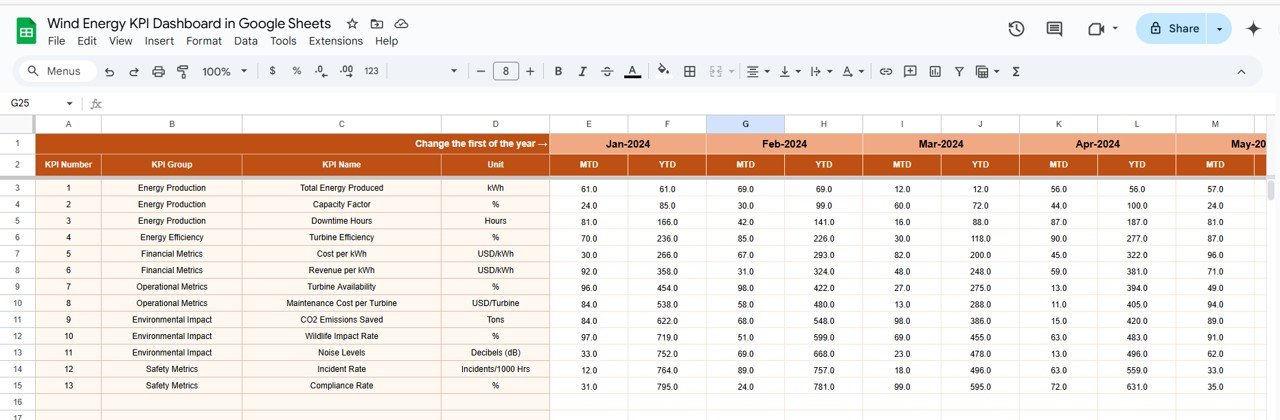
KPI Trend Sheet Tab
-
Trend Analysis: Track the performance of individual KPIs over time and make data-driven decisions.
-
KPI Group, Unit, Type: Understand how each KPI is grouped (e.g., energy, cost, maintenance), the unit of measurement (e.g., kWh, dollars), and whether it’s “Lower the Better” (LTB) or “Upper the Better” (UTB).
-
-
Actual Numbers Sheet Tab
-
Data Entry: Enter actual values for MTD (Month-to-Date) and YTD (Year-to-Date) performance.
-
Automatic Data Update: The dashboard refreshes automatically with updated values for real-time monitoring.
-
-
Target Sheet Tab
-
Set Targets: Enter target values for each KPI (monthly and YTD) to measure actual performance against goals.
-
-
Previous Year Number Sheet Tab
-
Historical Comparison: Enter data for the previous year to compare performance and identify areas for improvement.
-
-
KPI Definition Sheet Tab
-
Detailed Definitions: Learn about each KPI with clear definitions, formulas, and how they relate to wind energy management.
-
⚙️ How to Use the Wind Energy KPI Dashboard ⚙️
-
Input Data: Enter actual performance metrics into the Actual Numbers Sheet to track MTD and YTD performance.
-
Set Targets: Define target values in the Target Sheet to compare against actual performance.
-
Visualize Data: Use the Dashboard Sheet to view KPIs, trends, and charts for real-time analysis.
-
Monitor Trends: Regularly update data to track long-term performance and identify areas for improvement using the KPI Trend Sheet.
🌍 Who Can Benefit from This Wind Energy KPI Dashboard 🌍
-
Wind Farm Operators: Track energy production, system efficiency, and maintenance costs across multiple turbines.
-
Energy Analysts: Use the dashboard to analyze performance trends and generate insights for long-term planning.
-
Project Managers: Monitor operational efficiency, costs, and ROI to optimize project outcomes.
-
Sustainability Officers: Ensure that wind energy systems are performing sustainably by tracking key metrics like energy generation and environmental impact.
-
Investors and Stakeholders: Assess the profitability and performance of wind energy investments to make informed decisions.
🌟 Benefits of Using the Wind Energy KPI Dashboard 🌟
-
Real-Time Monitoring: Keep track of your wind energy system’s performance in real-time, allowing you to make quick adjustments and optimizations.
-
Easy-to-Understand Visuals: The dashboard includes charts and conditional formatting, providing a clear visual representation of performance.
-
Efficiency Optimization: Identify areas where energy production or operational costs can be improved to boost overall efficiency.
-
Financial Tracking: Monitor financial performance metrics such as maintenance costs and ROI to ensure that your wind energy systems are cost-effective.
-
Customizable: Tailor the dashboard to meet your specific needs, whether you’re managing a small turbine or a large wind farm.


Reviews
There are no reviews yet.