
Travel agencies operate in a fast-paced and highly competitive environment. On a daily basis, they manage bookings, customers, destinations, agents, revenue targets, and service quality. However, when performance data is tracked using manual reports or disconnected Excel sheets, visibility drops, insights arrive late, and decision-making becomes reactive instead of strategic.
That is exactly where the Travel Agencies KPI Dashboard in Excel becomes a powerful and business-critical solution.
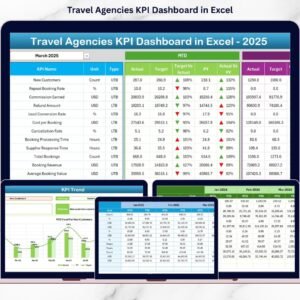
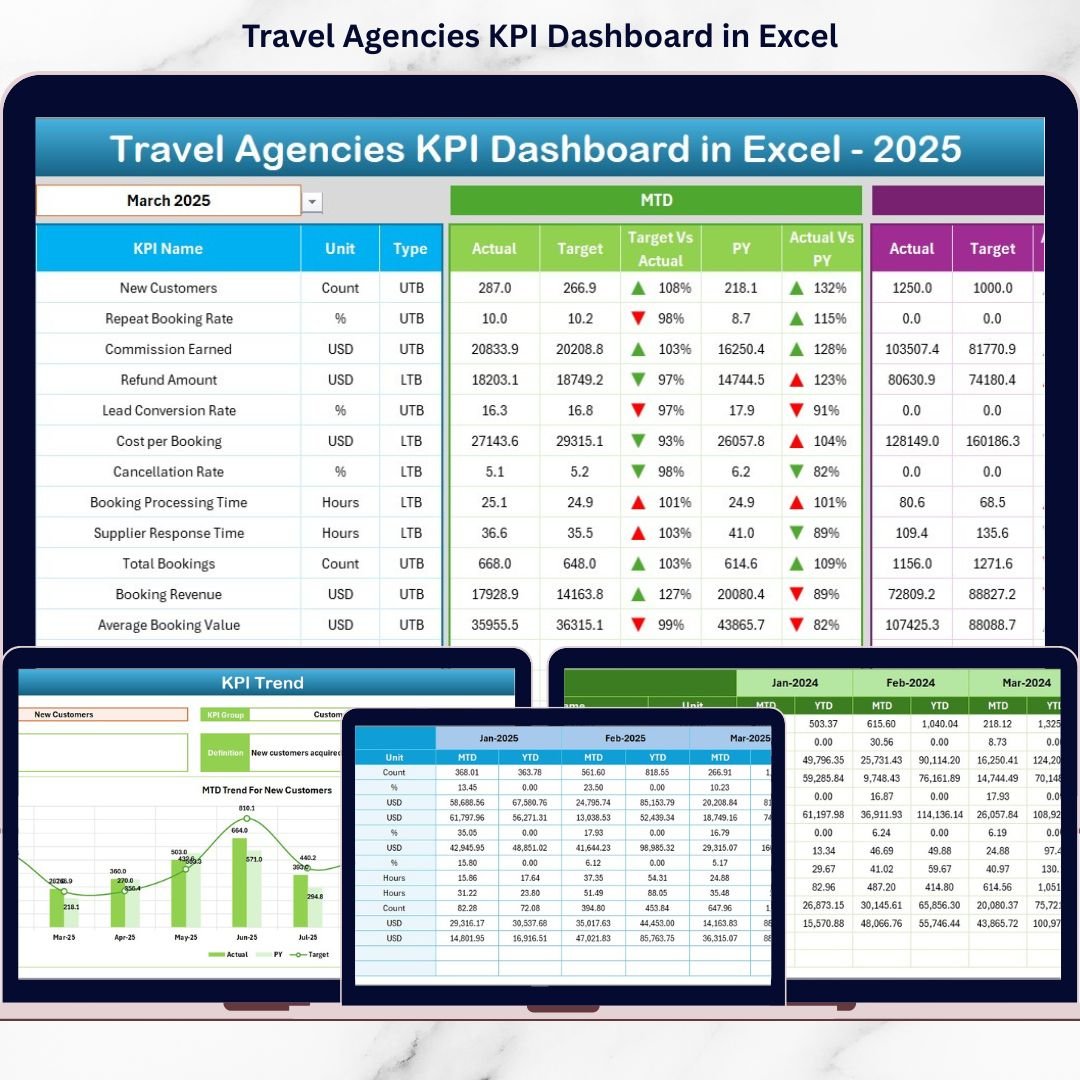
This ready-to-use Excel dashboard is designed specifically to help travel agencies track, analyze, and monitor key performance indicators (KPIs) in one centralized place. Instead of reviewing multiple reports, managers get a single interactive dashboard that shows MTD (Month-to-Date) and YTD (Year-to-Date) performance with clear visual indicators. As a result, travel agencies gain clarity, control, and confidence in their business decisions.
✅ Key Features of Travel Agencies KPI Dashboard in Excel
📊 Interactive KPI Dashboard
Monitor all critical travel agency KPIs on one professional dashboard.
📅 Month Selection Control
Select the reporting month from a dropdown and automatically refresh all numbers.
🎯 MTD & YTD Performance Analysis
Track short-term and long-term performance side by side.
📈 Target vs Actual Comparison
Instantly identify whether KPIs are meeting targets or falling short.
📉 Previous Year (PY) Comparison
Analyze growth and decline using PY vs Actual variance.
🚦 Conditional Formatting with Arrows
Up and down arrows visually highlight positive or negative performance.
📊 KPI Trend Analysis Sheet
Analyze KPI performance trends over time using charts.
📂 Structured Input & Definition Sheets
Ensure clean data entry and consistent KPI understanding.
📦 What’s Inside the Travel Agencies KPI Dashboard in Excel
🏠 Home Sheet
Acts as the navigation hub with six clickable buttons that allow users to jump instantly to different sections of the dashboard. This improves usability and saves time.
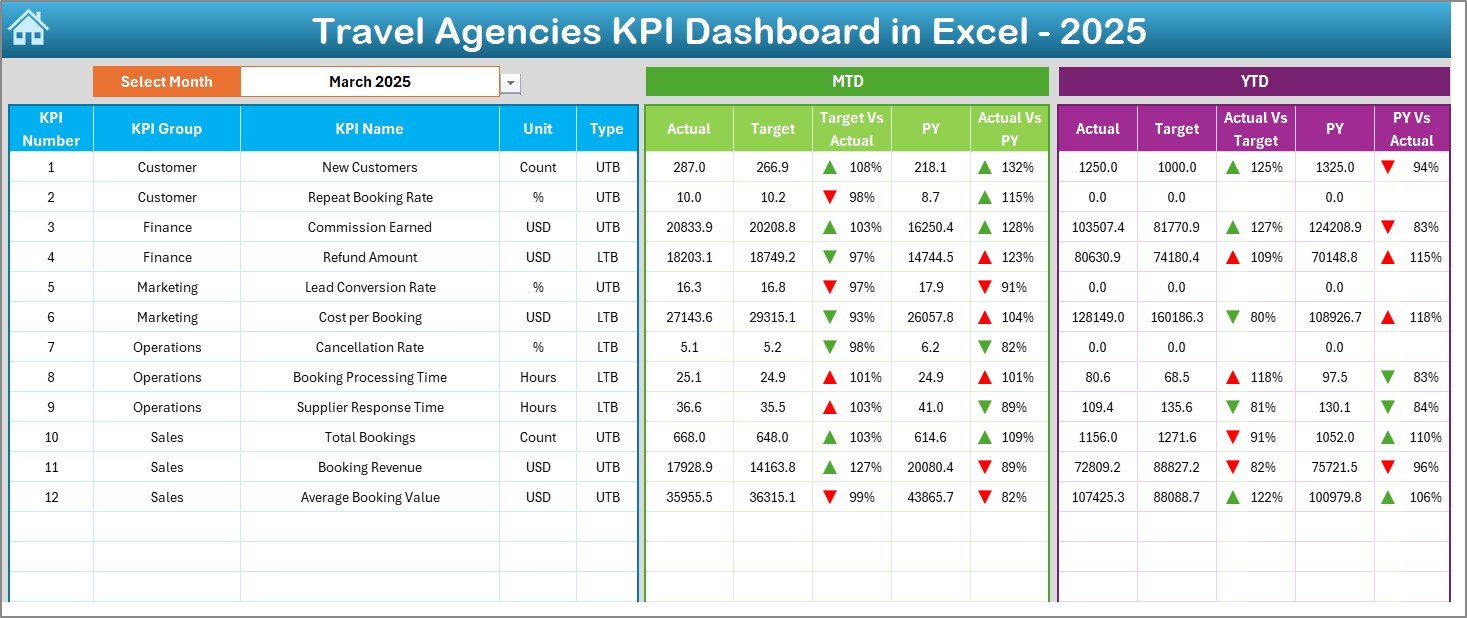
📊 Dashboard Sheet
This is the main reporting page.
Key highlights:
Month selection in cell D3
MTD Actual, Target, and PY values
YTD Actual, Target, and PY values
Target vs Actual and PY vs Actual variance
Conditional formatting with up/down arrows
Managers can instantly see which KPIs are performing well and which require attention.
📈 KPI Trend Sheet
This sheet focuses on individual KPI analysis.
How it works:
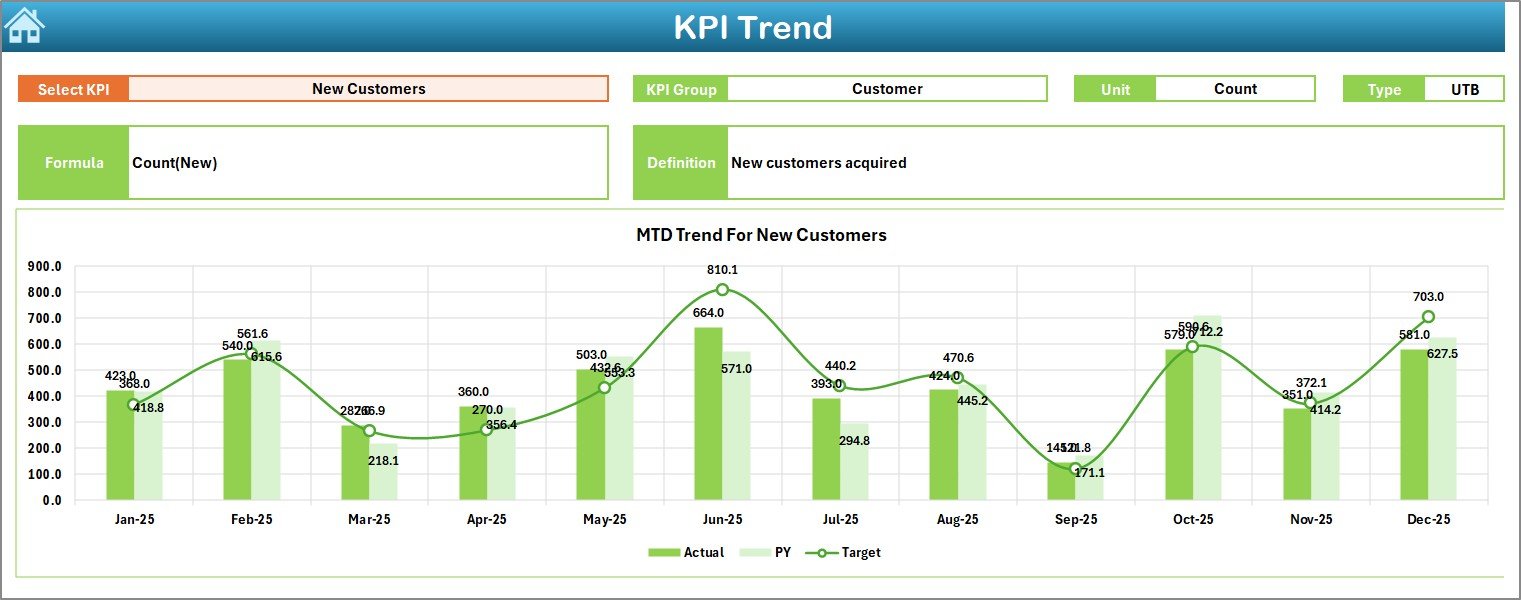
Select the KPI name from the dropdown in cell C3
KPI details and charts update automatically
Displays:
KPI Group
Unit
KPI Type (UTB / LTB)
Formula & Definition
MTD & YTD trend charts for Actual, Target, and PY
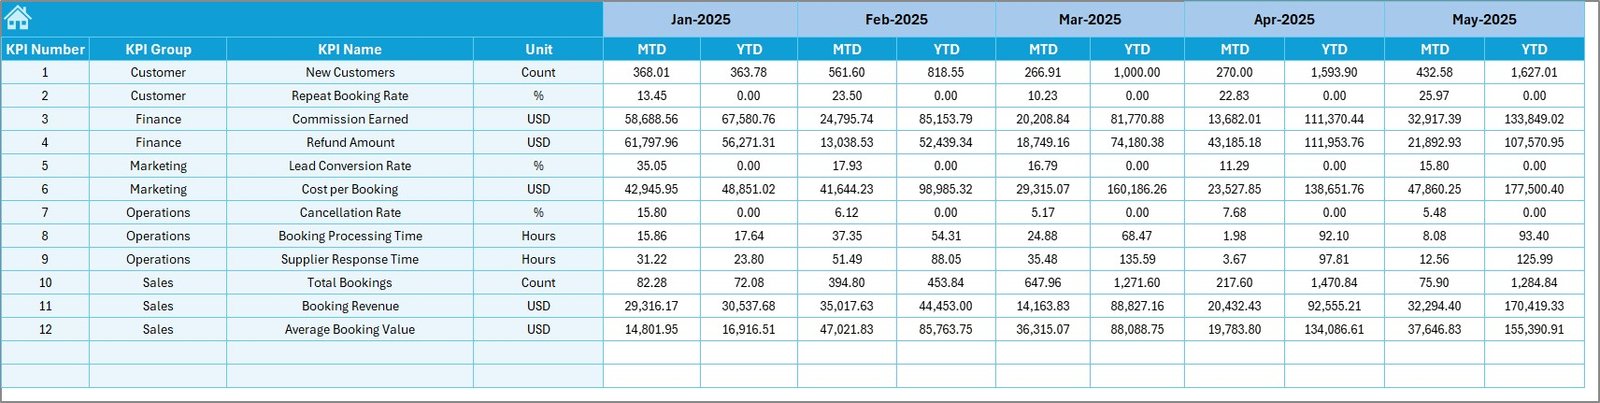
📥 Actual Numbers Input Sheet
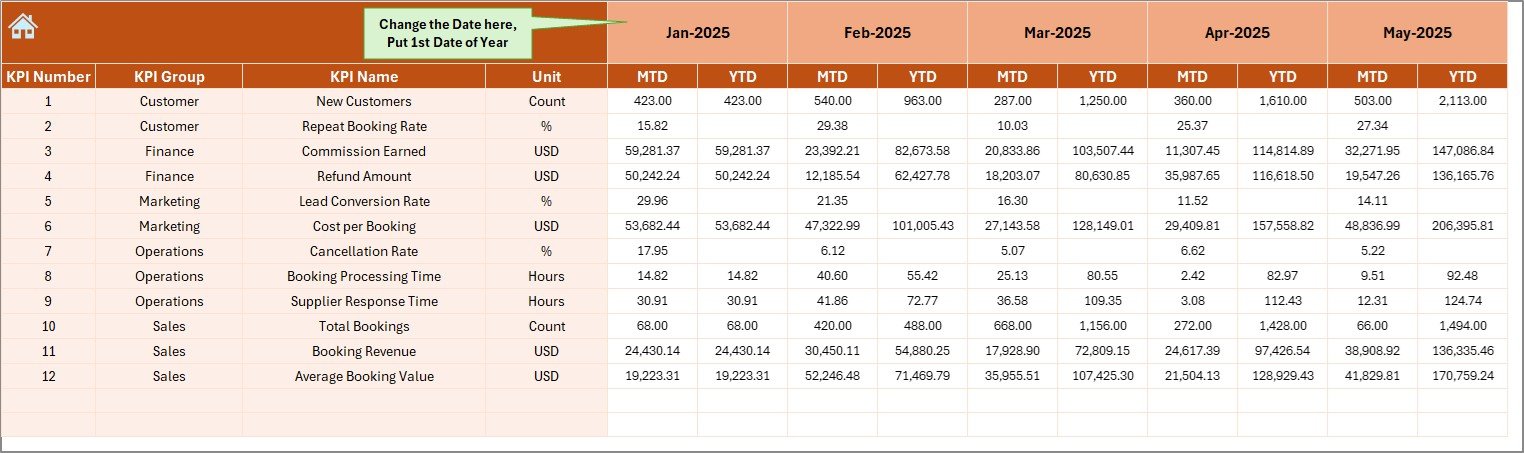
Used to enter actual KPI values.
Features:
Monthly MTD and YTD data entry
Reporting month selection
Dynamic year configuration
🎯 Target Sheet
Stores monthly MTD and YTD target values for each KPI. These targets power all variance calculations in the dashboard.
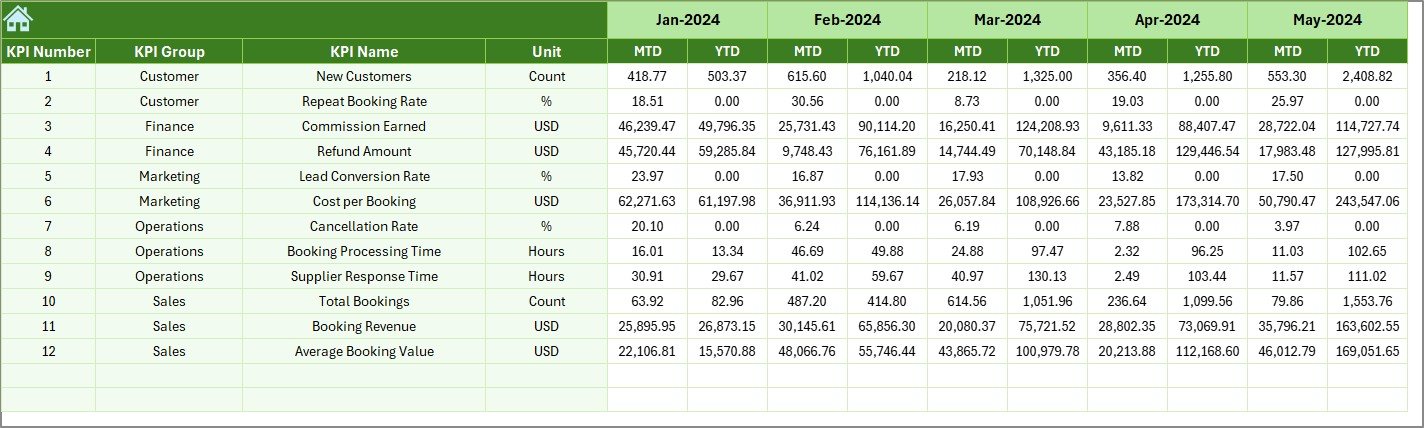
📆 Previous Year Number Sheet
Captures historical KPI data to support year-over-year comparison and growth analysis.
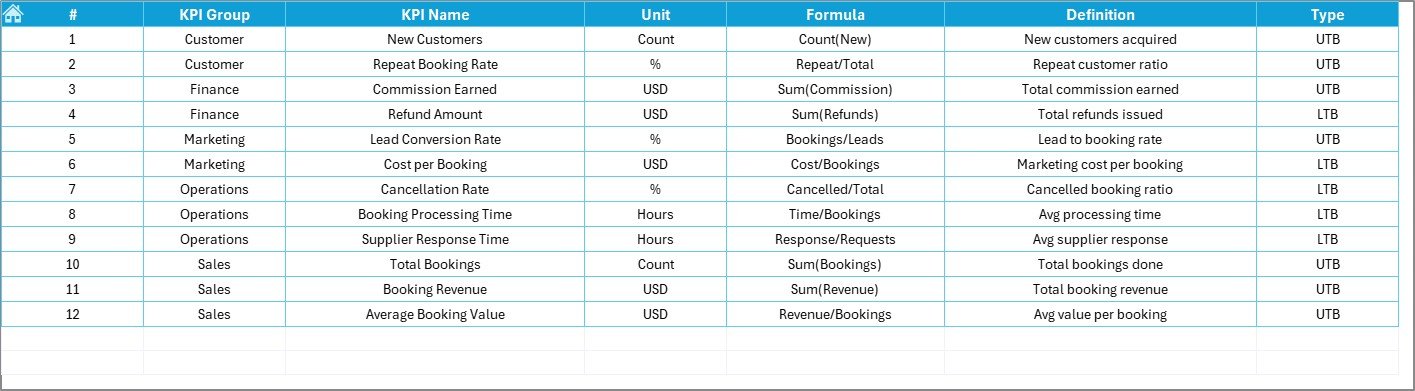
📘 KPI Definition Sheet
Maintains a single source of truth for KPIs.
Includes:
KPI Name
KPI Group
Unit
Formula
Definition
This ensures consistency across teams and reports.
🛠️ How to Use the Travel Agencies KPI Dashboard in Excel
1️⃣ Define KPIs and targets in the KPI Definition & Target sheets
2️⃣ Enter actual monthly data in the Actual Numbers Input sheet
3️⃣ Input previous year data in the PY sheet
4️⃣ Select the reporting month from the Dashboard
5️⃣ Review MTD and YTD performance instantly
6️⃣ Analyze trends using the KPI Trend sheet
Because all calculations are automated, users always see updated insights without manual effort.
👥 Who Can Benefit from This Travel Agencies KPI Dashboard
✈️ Travel Agency Owners
📊 Sales & Operations Managers
💼 Regional & Branch Heads
📈 Finance & Performance Teams
🏢 Small & Mid-Sized Travel Agencies
This dashboard adapts easily to different agency sizes and business models.
📘 Click here to read the Detailed blog post
▶️ Visit our YouTube channel to learn step-by-step video tutorials
👉 Youtube.com/@PKAnExcelExpert
Watch the step-by-step video tutorial:
Compatibility and Requirements
- Works in Microsoft Excel desktop (Excel 2016 or later, or Microsoft 365).
- You pick the reporting month on the Dashboard sheet and the KPI on the KPI Trend sheet from dropdown lists. Microsoft explains how they work in Create a drop-down list.
Frequently Asked Questions
Which sheets are included?
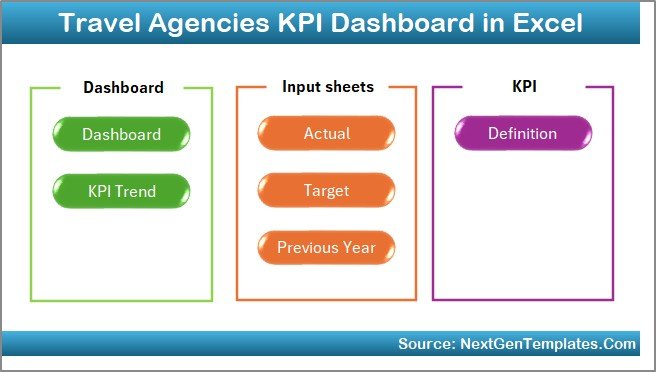
Seven sheets: Home, Dashboard, KPI Trend, Actual Numbers Input, Target, Previous Year Number and KPI Definition.
How do I update the dashboard?
Enter your monthly MTD and YTD figures in the Actual Numbers Input sheet and your goals in the Target sheet. Then select the reporting month in cell D3 of the Dashboard sheet and the numbers refresh.
Can I compare this year with last year?
Yes. Add last year’s figures to the Previous Year Number sheet. The Dashboard shows PY next to Actual and Target for both MTD and YTD, with PY vs Actual variance.
How do I see the trend for one KPI?
Open the KPI Trend sheet and choose the KPI name from the dropdown in cell C3. It shows the KPI group, unit, type (UTB or LTB), formula and definition, plus MTD and YTD trend charts for Actual, Target and PY.
Is there a Power BI version?
Yes. See the Travel Agencies KPI Dashboard in Power BI.
Related Travel Templates
- Travel Agencies KPI Dashboard in Power BI: the same KPIs in Power BI
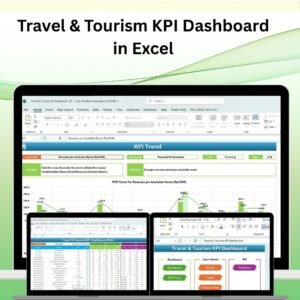
- Travel & Tourism KPI Dashboard in Excel: a KPI view for tourism businesses
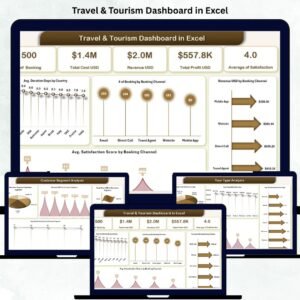
- Travel & Tourism Dashboard in Excel: a wider tourism dashboard
- Business Travel Services Dashboard in Excel: a dashboard for business travel services
- KPI Dashboard Library (Excel): 15 KPI dashboards in one download
Browse all Excel KPI dashboards.