



Managing a Third-Party Logistics (3PL) business today is no longer just about moving goods from point A to point B. Customers demand faster deliveries, lower costs, real-time visibility, and flawless execution. Meanwhile, competition is increasing, margins are tightening, and operational complexity keeps growing. In such an environment, managing your 3PL business without clear performance insights is risky and expensive.Third-Party Logistics (3PL) KPI Dashboard in Excel
That is exactly why the Third-Party Logistics (3PL) KPI Dashboard in Excel is a must-have performance management tool for logistics providers.
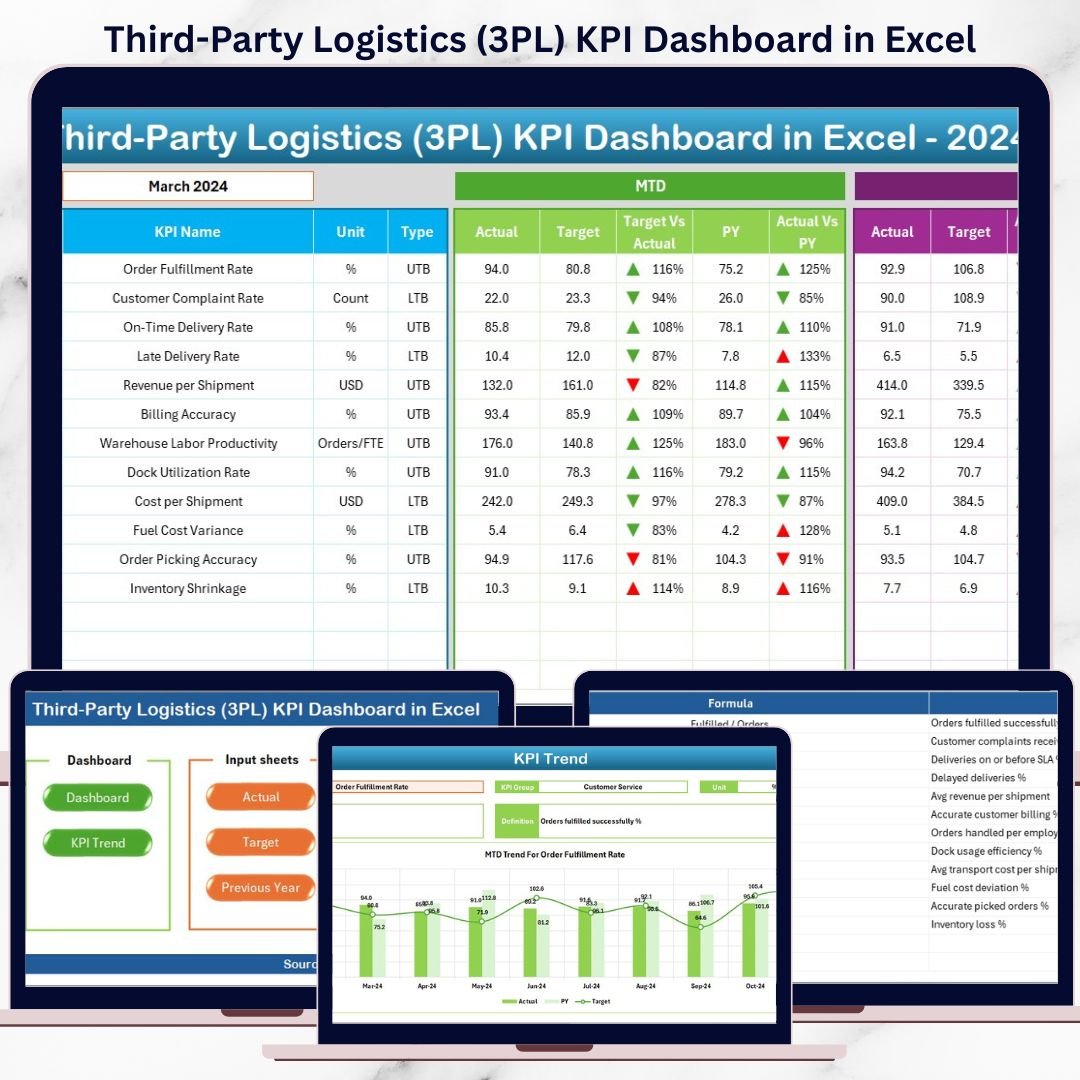
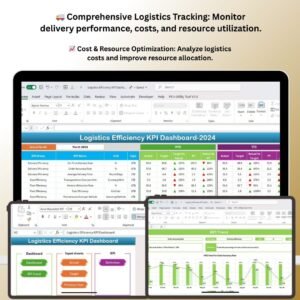
This professionally designed and ready-to-use Excel dashboard converts raw logistics data into powerful KPIs, comparisons, and trends. Instead of juggling multiple spreadsheets, emails, and reports, you get one centralized dashboard that shows how your operations, finances, and service levels are performing—month by month and year to date. Best of all, it works entirely in Microsoft Excel, so you do not need expensive BI tools or technical expertise.
🔑 Key Features of Third-Party Logistics (3PL) KPI Dashboard in Excel
🚚 Centralized KPI Monitoring
Track all critical operational, financial, and service-level KPIs in one structured dashboard designed specifically for 3PL businesses.Third-Party Logistics (3PL) KPI Dashboard in Excel
📊 MTD & YTD Performance Tracking
Analyze Month-to-Date and Year-to-Date performance side by side to understand short-term results and long-term trends.
🎯 Target vs Actual Comparison
Instantly identify performance gaps using automated variance analysis between actual results and planned targets.
📈 Previous Year Comparison
Measure Year-over-Year performance to detect improvements, declines, and seasonal patterns.
🔽🔼 Visual Performance Indicators
Conditional formatting with up and down arrows highlights positive and negative performance at a glance.
🧭 Easy Navigation with Summary Page
Jump to any section of the dashboard instantly using navigation buttons—no scrolling, no confusion.
📦 What’s Inside the Third-Party Logistics (3PL) KPI Dashboard in Excel
This Excel template is built with a clear, professional, and user-friendly structure:
📌 Summary Page (Index Sheet)
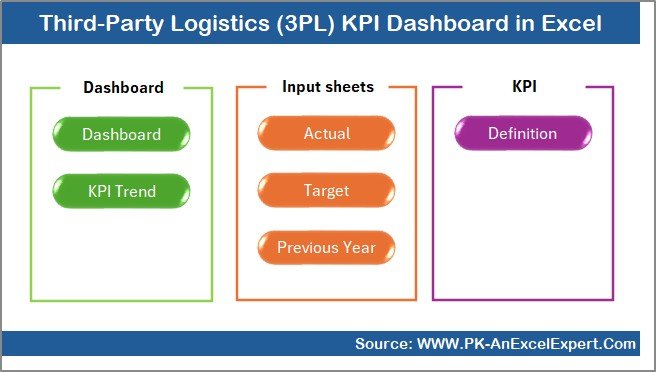
Acts as the navigation hub with buttons that take users directly to each worksheet, making the dashboard executive-friendly.
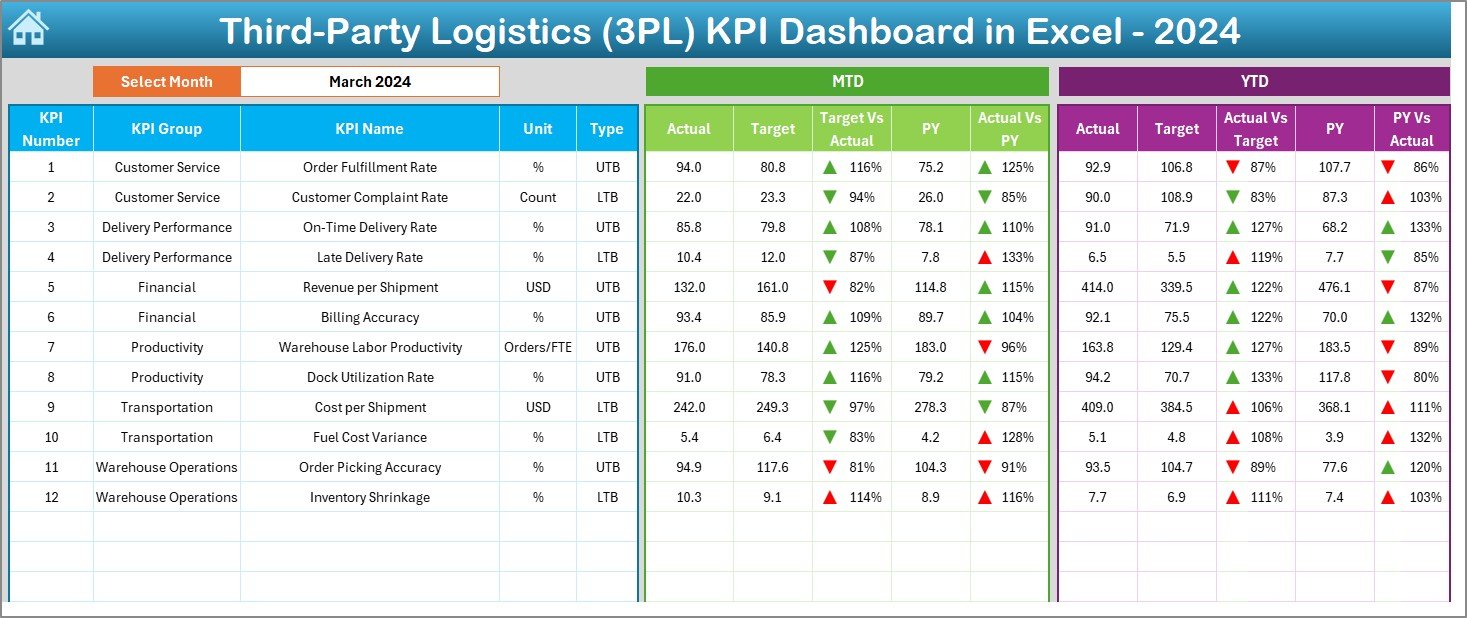
📌 Dashboard Sheet
The main reporting page displaying all KPIs in one view. Select the month from the drop-down in range D3, and the entire dashboard updates automatically.
📌 Trend Sheet
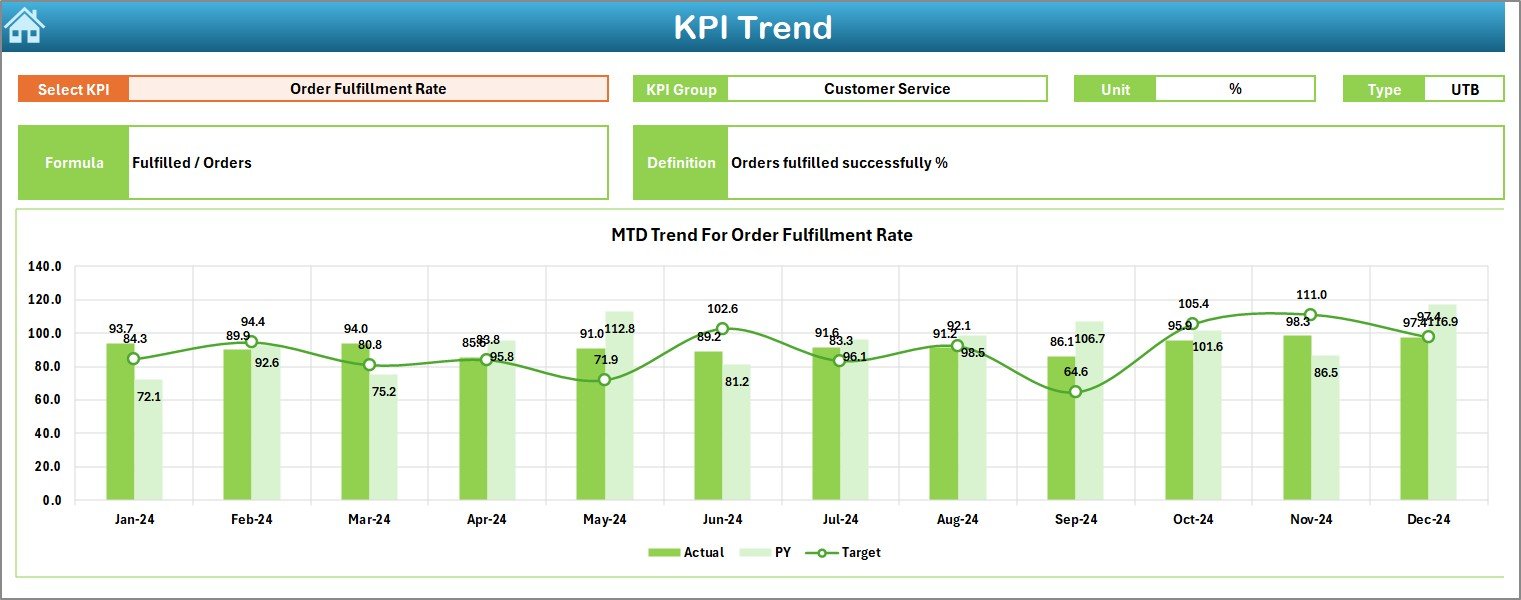
Select any KPI from the drop-down in range C3 to view detailed MTD and YTD trend charts along with KPI definition, formula, unit, and performance type.
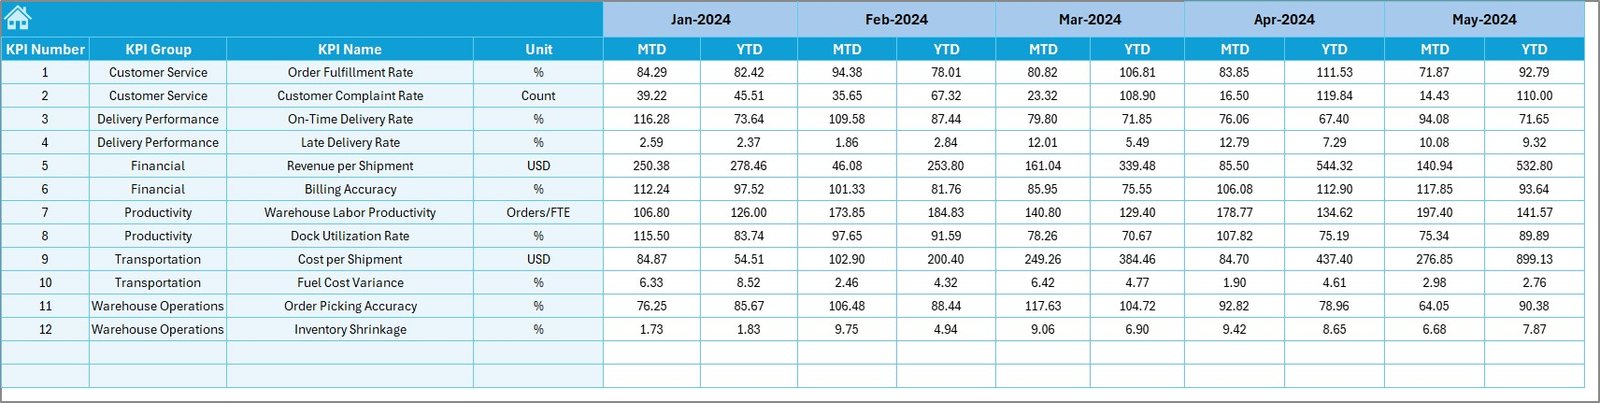
📌 Actual Numbers Input Sheet
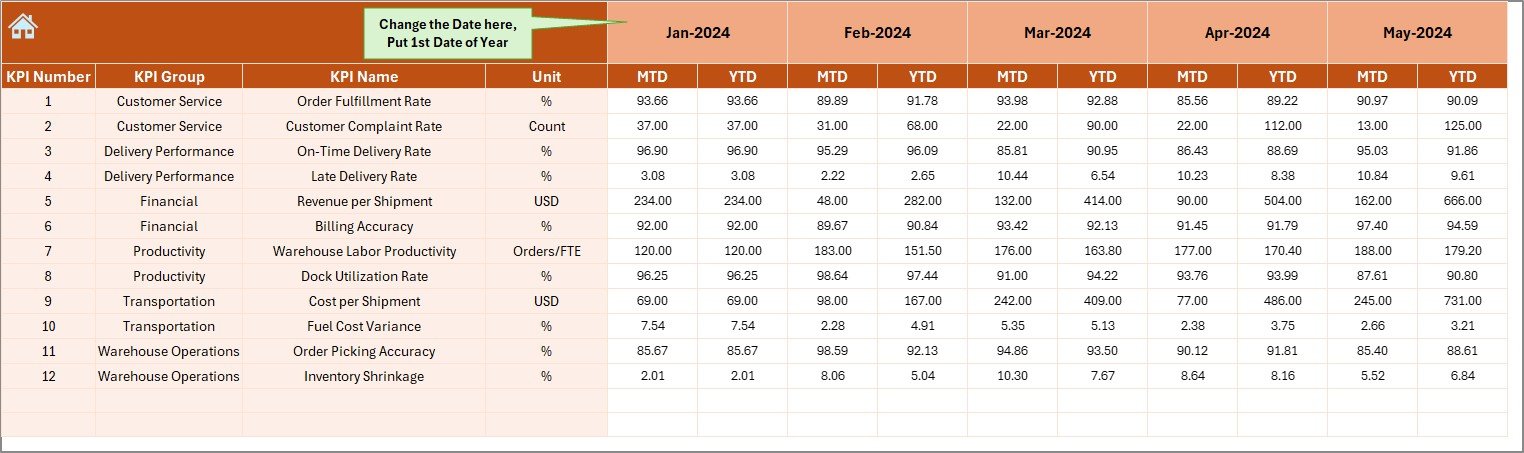
Enter current-year actual data in a structured format to ensure accuracy and consistency.
📌 Target Sheet
Store monthly and YTD targets separately to enable automatic variance analysis.
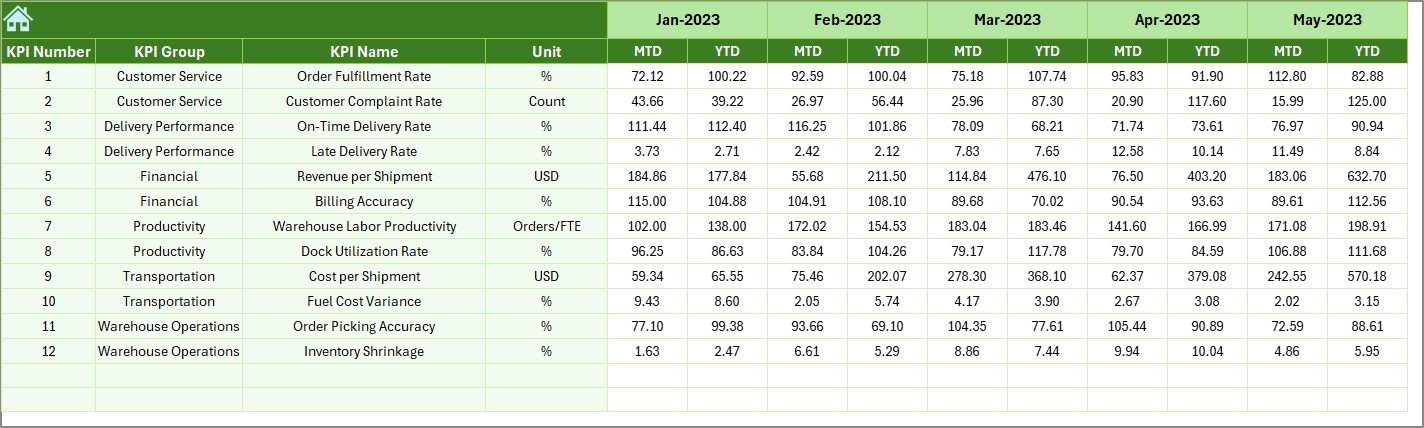
📌 Previous Year Sheet
Maintain historical data for Year-over-Year comparison and long-term performance analysis.Third-Party Logistics (3PL) KPI Dashboard in Excel
📌 KPI Definition Sheet
Clearly defines each KPI, ensuring consistency, transparency, and easy understanding across teams.
🛠️ How to Use the Third-Party Logistics (3PL) KPI Dashboard in Excel
Using this dashboard is simple and intuitive:
1️⃣ Enter current-year actual numbers in the Actual Numbers sheet
2️⃣ Define targets in the Target sheet
3️⃣ Add previous-year values in the Previous Year sheet
4️⃣ Select the month from the drop-down on the Dashboard
5️⃣ Instantly analyze MTD, YTD, Target vs Actual, and YoY performance
6️⃣ Use the Trend Sheet to deep-dive into individual KPIs
No advanced Excel skills are required—basic data entry is enough.
👥 Who Can Benefit from This Third-Party Logistics (3PL) KPI Dashboard in Excel
🚛 Third-Party Logistics (3PL) Companies
📦 Warehouse & Distribution Centers
📊 Logistics & Operations Managers
💼 Supply Chain Analysts
📈 Finance & Performance Teams
🏢 Small, Medium, and Large Logistics Providers
If you want better visibility, faster decisions, and improved profitability, this dashboard is built for you.
Click here to read the Detailed Blog Post
Visit our YouTube channel to learn step-by-step video tutorials
Watch the step-by-step video tutorial:
Compatibility and Requirements
- Works in Microsoft Excel desktop (Excel 2016 or later, or Microsoft 365).
- Month and KPI selectors are dropdown lists, which Microsoft explains in Create a drop-down list.
Frequently Asked Questions
How do I change the month on the dashboard?
Select the month from the drop-down in cell D3 of the Dashboard sheet, and the whole dashboard updates.
How do I see the trend for one KPI?
On the Trend sheet, pick a KPI from the drop-down in cell C3 to see its MTD and YTD trend charts with the definition, formula, unit and performance type.
Can I compare against targets and last year?
Yes. Targets go on the Target sheet and last year’s figures on the Previous Year sheet, so the dashboard shows target vs actual and year-over-year results.
How are good and bad results shown?
Conditional formatting adds up and down arrows to highlight positive and negative performance.
Do I need advanced Excel skills?
No. Basic data entry on the Actual Numbers, Target and Previous Year sheets is enough.
Related Logistics KPI Templates
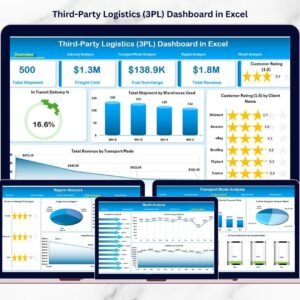
- Third-Party Logistics (3PL) Dashboard in Excel: a 3PL dashboard with charts
- Logistics Cost Optimization KPI Dashboard in Excel: KPIs for logistics costs
- Warehouse Management KPI Dashboard in Excel: KPIs for warehouse operations
- Third-Party Logistics (3PL) Dashboard in Power BI: the Power BI option
- Logistics and Transportation Hub: 7 premium Excel and Power BI logistics templates
Browse all Excel KPI dashboards or the Excel logistics templates.




Reviews
There are no reviews yet.