

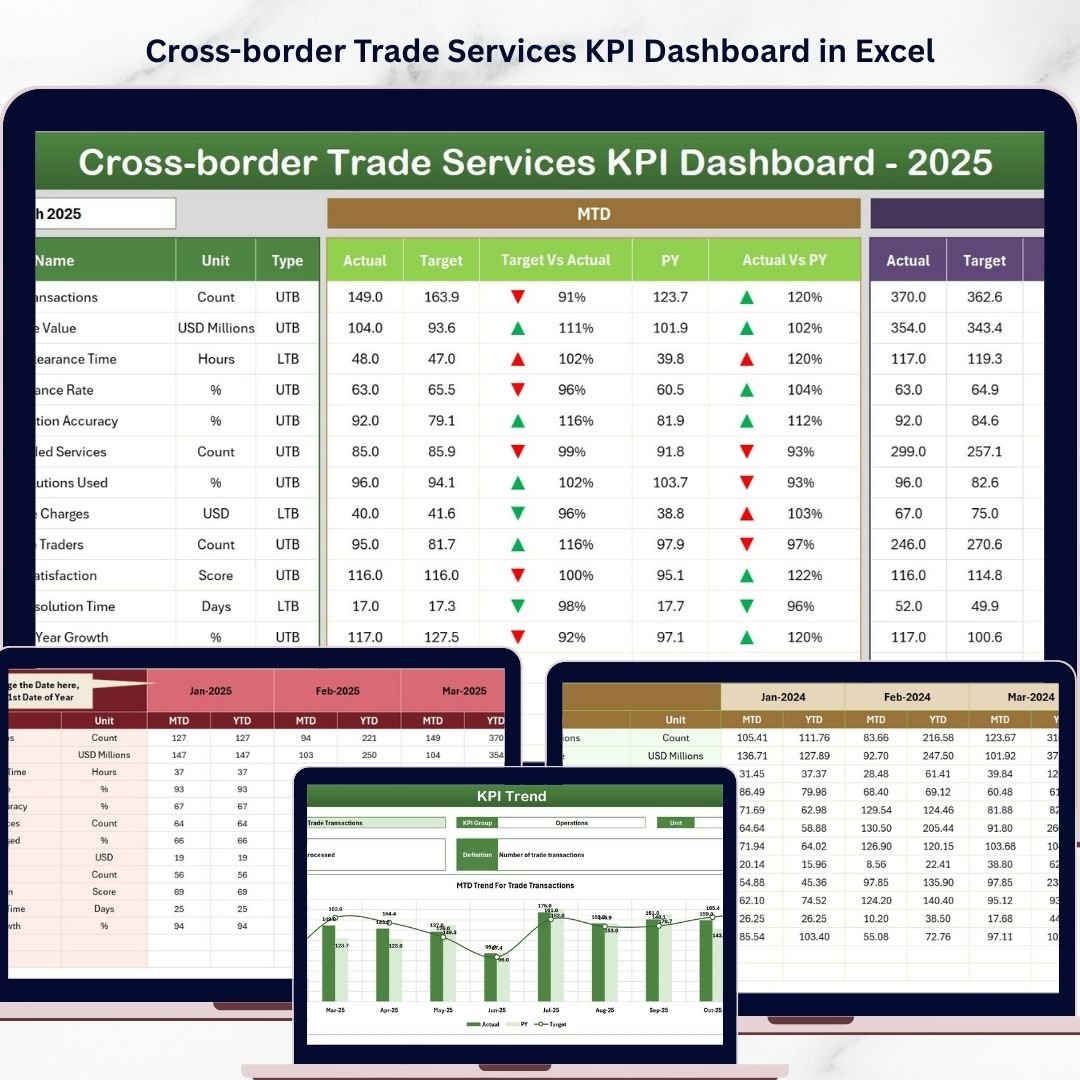


Key Features of Cross-border Trade Services KPI Dashboard
Unlock the power of insightful analytics with our Cross-border Trade Services KPI Dashboard, designed specifically to streamline and enhance your international trade performance tracking. This comprehensive digital dashboard offers 7 meticulously crafted worksheets that bring clarity and precision to your KPI management.
- 🗂️ Home Sheet: An intuitive index page featuring six easy-to-navigate buttons to jump between sheets, making your workflow seamless and efficient.
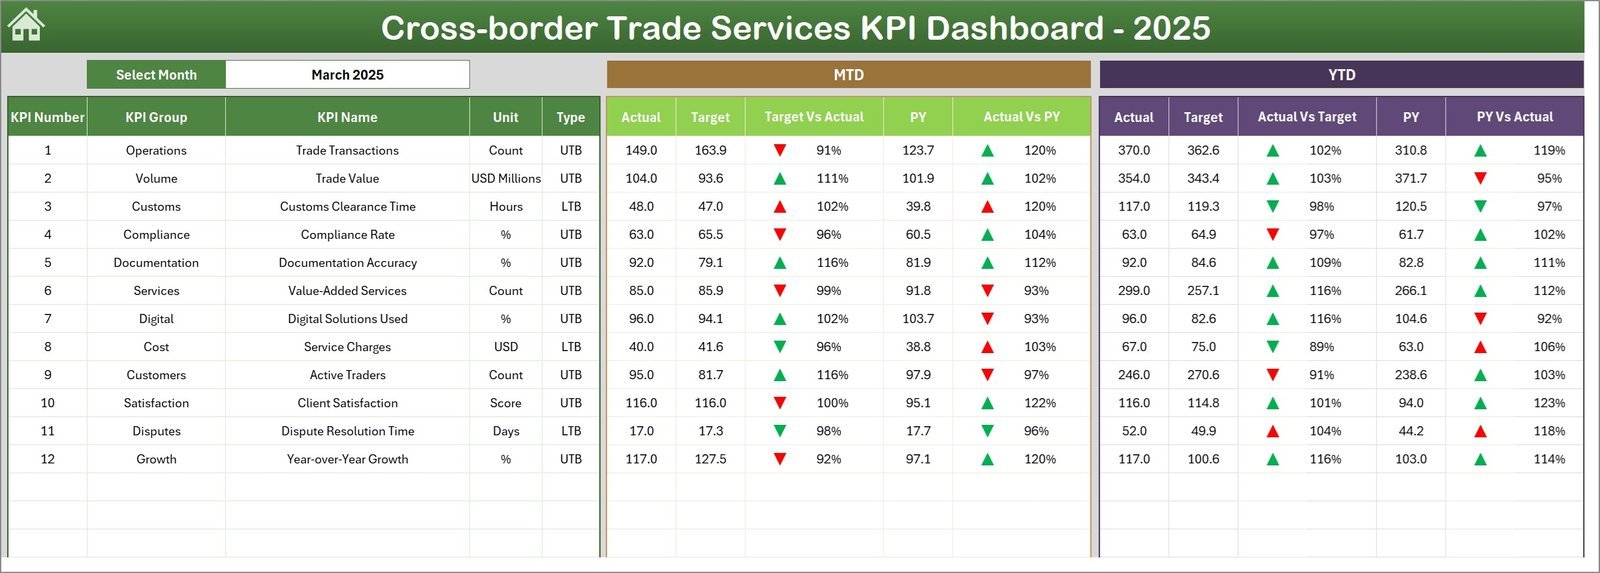
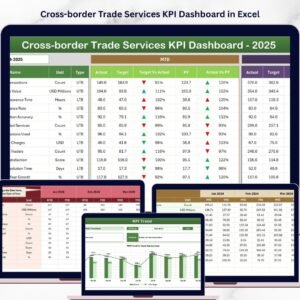
- 📊 Dashboard Sheet Tab: The heart of the dashboard, displaying all KPIs with dynamic monthly selection via a drop-down. Visualize MTD Actual, Target, and Previous Year data alongside YTD values, all enhanced with conditional formatting and up/down arrows for quick performance insights.
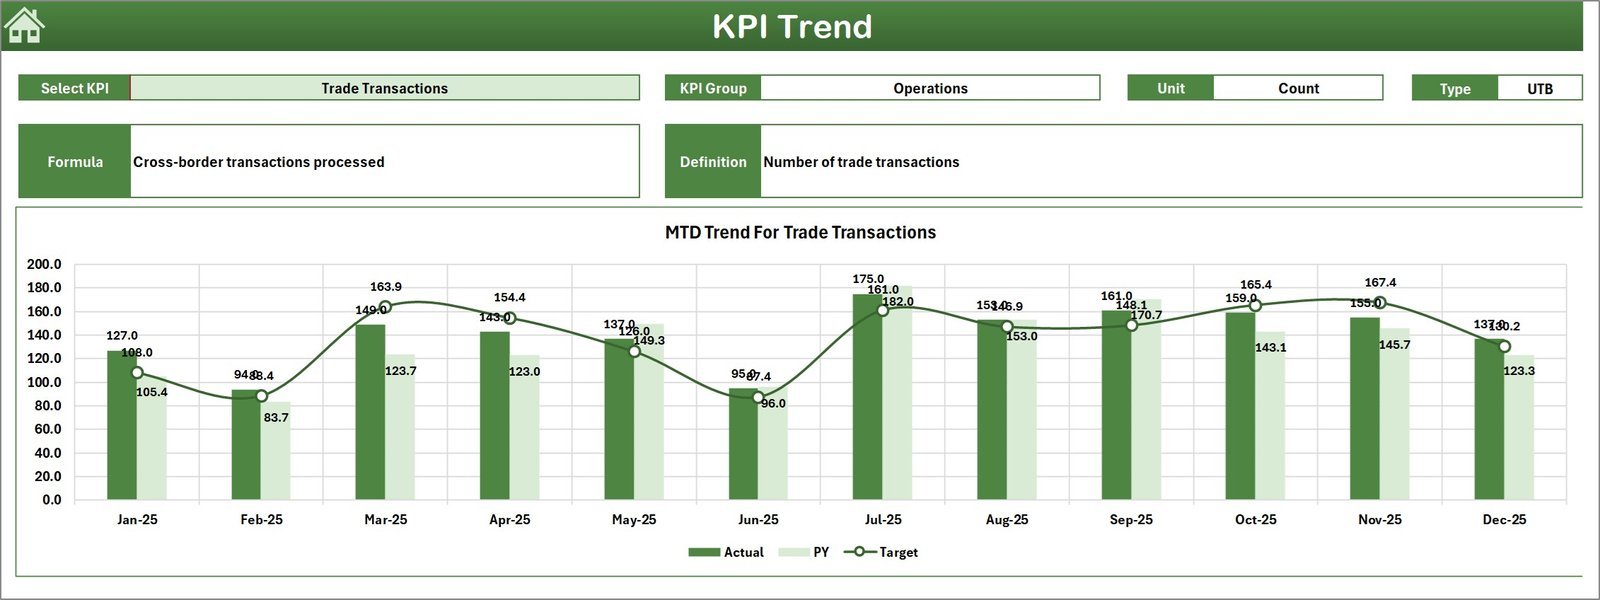
- 📈 KPI Trend Sheet Tab: Select any KPI from a drop-down to view detailed KPI Group, Unit, Type (Lower the Better or Upper the Better), Formula, and Definition. Monitor MTD and YTD trends with easy-to-read charts comparing Actual, Target, and Previous Year figures.
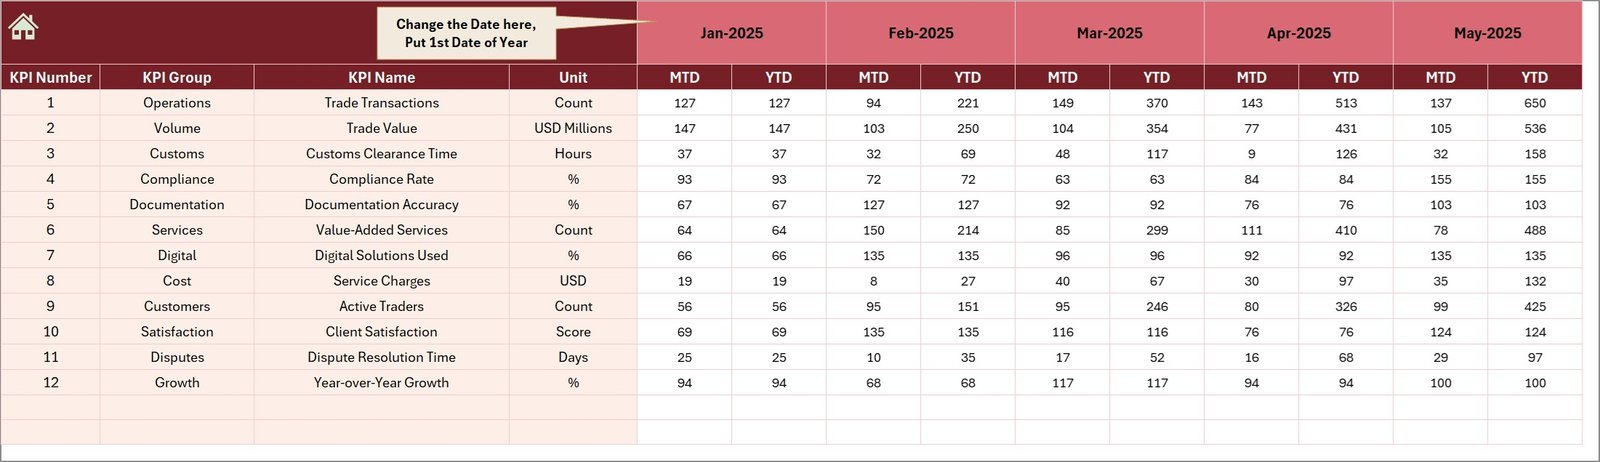
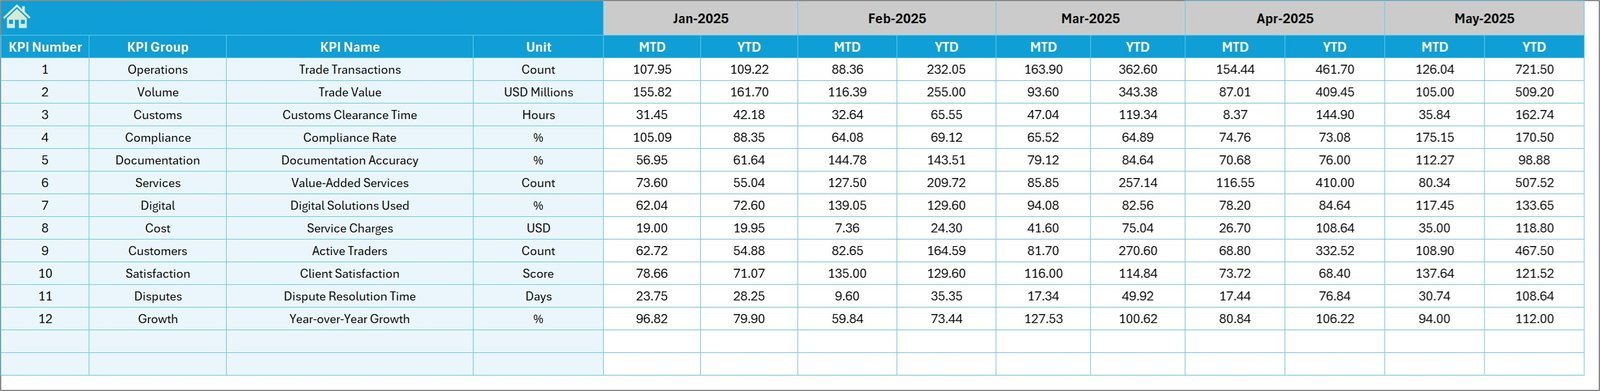
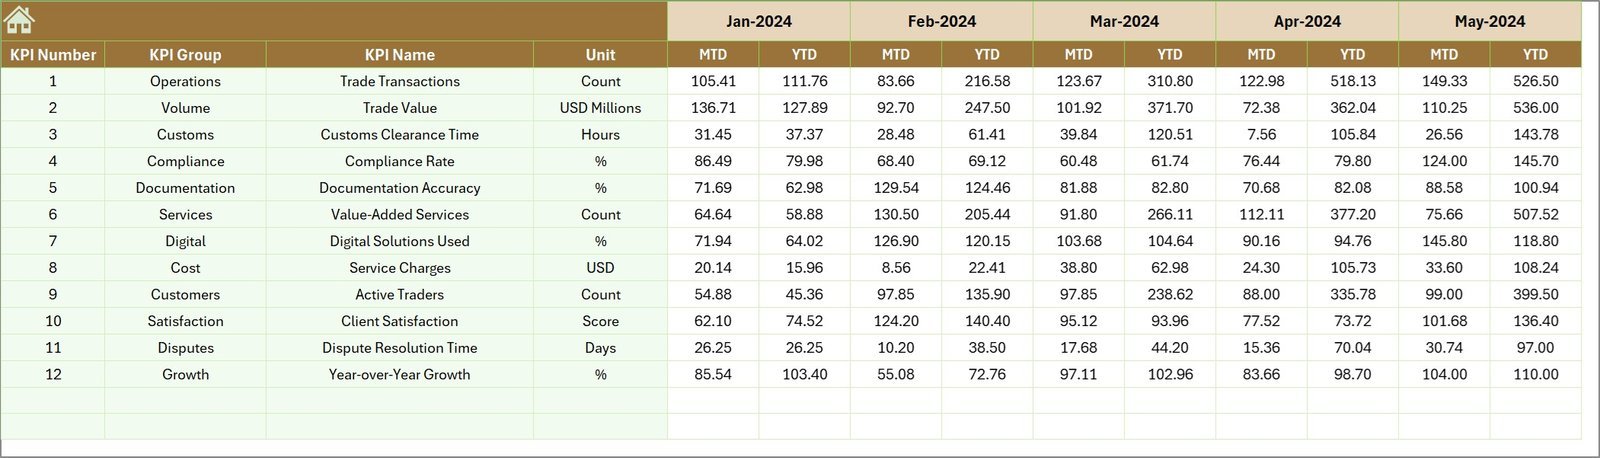
- ✍️ Actual Numbers Input Sheet: Enter your monthly actual numbers for MTD and YTD effortlessly, with a flexible month-selection feature to customize your data entry.
- 🎯 Target Number Input Sheet: Define your monthly targets for each KPI to keep your goals aligned and measurable, covering both MTD and YTD data.
- 📅 Previous Year Number Sheet Tab: Input last year’s data to enable meaningful year-over-year comparisons and performance evaluations.
- 📚 KPI Definition Sheet Tab: Maintain clarity by defining each KPI’s name, group, unit, formula, and type (Lower the Better or Upper the Better) for comprehensive understanding across your team.
What’s Inside the Cross-border Trade Services KPI Dashboard
This dashboard is a complete digital solution built to help businesses track, analyze, and optimize their cross-border trade KPIs. Inside, you will find:
- 🖥️ Seven fully interactive worksheets for data input, visualization, and KPI management
- 📅 Dynamic monthly and yearly data selection and comparison capabilities
- 📉 Conditional formatting and visual cues to quickly identify KPI performance trends
- 📊 Trend charts illustrating actual vs target vs previous year for informed decision-making
- 📥 Easy-to-use input sheets for actual, target, and previous year data entry
- 📖 Clear KPI definitions and formulas ensuring consistent understanding within your team
How to Use the Cross-border Trade Services
Getting started with this dashboard is straightforward and user-friendly. Follow these simple steps:
- 🔍 Begin at the Home Sheet to navigate quickly across different sections.
- 📅 Use the Dashboard Sheet to select the month you want to analyze through the drop-down in cell D3; all KPI data will update accordingly.
- ✏️ Enter your actual numbers in the Actual Numbers Input sheet, adjusting the starting month as needed.
- 🎯 Input your monthly and yearly targets in the Target Number Input sheet to set measurable goals.
- 📊 Fill in last year’s data in the Previous Year Number sheet for accurate comparisons.
- 📈 Select any KPI from the KPI Trend Sheet to view detailed trend charts and performance insights.
- 📚 Use the KPI Definition sheet to understand each KPI’s purpose, formula, and performance type.
- ✅ Monitor your KPIs regularly to identify trends, gaps, and opportunities for improvement in your cross-border trade operations.
Who Can Benefit from This Cross-border Trade Services KPI Dashboard
This KPI dashboard is perfect for a wide range of professionals and organizations involved in international trade and logistics:
- 🌍 Trade Managers: Track key performance indicators efficiently to optimize global trade processes.
- 📦 Supply Chain Professionals: Gain visibility into cross-border logistics performance and identify bottlenecks.
- 📈 Business Analysts: Analyze trends and generate actionable insights for strategic decision-making.
- 👥 Executives and Stakeholders: Monitor company-wide performance at a glance with clear visual dashboards.
- 💼 Consultants: Provide clients with powerful tools to measure and improve cross-border trade KPIs.
- 🏢 International Trade Firms: Manage and report KPIs across different regions and timelines effortlessly.
- 📊 Finance Teams: Align financial targets with operational KPIs to ensure consistent performance tracking.
Whether you are a small business expanding overseas or a large corporation managing multiple trade lanes, this dashboard is designed to elevate your KPI tracking and drive measurable business growth.
Click here to read the Detailed blog post.
Visit our YouTube channel to learn step-by-step video tutorials
Watch the step-by-step video tutorial:
Compatibility and Requirements
- Works in Microsoft Excel desktop (Excel 2016 or later, or Microsoft 365).
- The month and the KPI are picked from dropdowns. Microsoft explains them in Create a drop-down list.
Frequently Asked Questions
How many worksheets does the dashboard have?
Seven: Home, Dashboard, KPI Trend, Actual Numbers Input, Target Number Input, Previous Year Number and KPI Definition.
How do I change the month shown on the dashboard?
Pick the month from the drop-down in cell D3 on the Dashboard sheet. The MTD and YTD values for Actual, Target and Previous Year update to that month.
Where do I enter my own numbers?
Enter actual figures in the Actual Numbers Input sheet and goals in the Target Number Input sheet. Last year’s figures go in the Previous Year Number sheet.
How do I see the trend for one KPI?
Open the KPI Trend sheet and select the KPI from the drop-down. It shows the KPI Group, Unit, Type (Lower the Better or Upper the Better), Formula and Definition, with charts comparing Actual, Target and Previous Year.
Is there a Power BI version?
Yes. See the Cross-border Trade Services KPI Dashboard in Power BI.
Related Cross-border Trade Templates
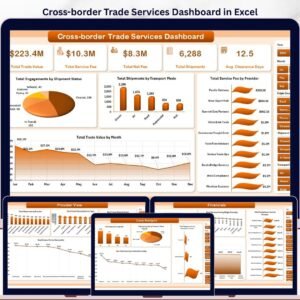
- Cross-border Trade Services Dashboard in Excel: a dashboard view of the same trade topic
- Cross-border Trade Services KPI Dashboard in Power BI: the Power BI edition
- Cross-border Trade Services Dashboard in Power BI: the dashboard for Power BI users
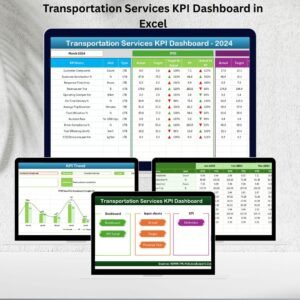
- Transportation Services KPI Dashboard in Excel: KPIs for transport operations
- KPI Dashboard Library (Excel): 15 KPI dashboard templates in one download
Browse all Excel KPI dashboards.







Reviews
There are no reviews yet.