



Think tanks operate in a highly impact-driven environment where research quality, policy influence, funding efficiency, and outreach effectiveness define success. However, when performance data remains scattered across spreadsheets, reporting becomes slow and insights get lost. That is exactly where the Think Tanks KPI Dashboard in Excel becomes a game-changer.
This ready-to-use Excel dashboard helps think tanks track, analyze, and improve performance across research, policy impact, funding, outreach, and operations — all in one structured file. Moreover, because it is built in Excel, teams can start using it immediately without costly BI tools or technical complexity.
Whether you manage a small policy research group or a large international think tank, this dashboard delivers clarity, accountability, and data-driven decision-making.
🚀 Key Features of Think Tanks KPI Dashboard in Excel
✅ Centralized KPI Monitoring
Track all critical think tank KPIs — research output, policy influence, funding utilization, outreach impact, and operations — in one dashboard.
📅 Dynamic Month Selection
Select the reporting month from a drop-down, and the entire dashboard updates instantly.
📊 MTD & YTD Performance Tracking
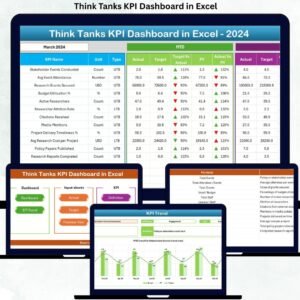
Monitor Month-to-Date and Year-to-Date Actuals, Targets, and Previous Year values with variance analysis.
🔼 Smart Conditional Formatting
Up and down arrows instantly highlight strong and weak performance areas.
📈 Trend Analysis for Every KPI
Visual MTD and YTD trend charts help identify patterns, seasonality, and performance gaps.
📂 Well-Structured 7-Sheet Design
Each worksheet serves a clear purpose, making the dashboard intuitive and user-friendly.
💰 Cost-Effective Excel Solution
No subscriptions, no licenses, no IT dependency — just Excel.

📁 What’s Inside the Think Tanks KPI Dashboard in Excel
This digital product includes 7 professionally designed worksheets, carefully structured for performance tracking:
📌 Summary Page
An index page with interactive buttons that allow one-click navigation across all sheets.
📌 Dashboard Sheet
The main performance view showing:
MTD & YTD Actual, Target, and Previous Year values
Target vs Actual variance
PY vs Actual variance
Visual indicators using conditional formatting
📌 Trend Sheet
Analyze individual KPIs with:
KPI group, unit, type (LTB / UTB), formula, and definition
MTD and YTD trend charts for Actual, Target, and PY
📌 Actual Numbers Input Sheet
Enter real performance values with automatic cumulative calculations.
📌 Target Sheet
Define monthly and yearly performance targets for each KPI.
📌 Previous Year Numbers Sheet
Compare current performance with historical data for year-over-year analysis.
📌 KPI Definition Sheet
Standardize KPIs with clear names, units, formulas, and definitions to eliminate confusion.
🛠️ How to Use the Think Tanks KPI Dashboard in Excel
Using this dashboard is simple and intuitive:
1️⃣ Define your KPIs in the KPI Definition Sheet
2️⃣ Enter planned targets in the Target Sheet
3️⃣ Input actual monthly performance data
4️⃣ Add previous year values for comparison
5️⃣ Select the reporting month from the dashboard
6️⃣ Instantly review insights, trends, and variances
No advanced Excel skills are required. Basic Excel knowledge is enough to get started.
🎯 Who Can Benefit from This Think Tanks KPI Dashboard in Excel?
This dashboard is ideal for:
👥 Think Tank Directors & Leadership Teams – Track impact and strategic alignment
📚 Research Managers & Analysts – Monitor output and policy influence
📢 Communication & Outreach Teams – Measure media and stakeholder engagement
💼 Finance & Operations Teams – Track funding efficiency and budget utilization
🤝 Donors & Funding Partners – Gain transparency and accountability
If your organization values measurable impact and credible reporting, this dashboard is built for you.
Click here to read the Detailed blog post
Watch the step-by-step video tutorial:
Visit our YouTube channel to learn step-by-step video tutorials
<a href=”https://www.youtube.com/@PKAnExcelExpert” target=”_blank”>YouTube.com/@PKAnExcelExpert</a>
Compatibility and Requirements
- Works in Microsoft Excel desktop (Excel 2016 or later, or Microsoft 365).
- The dashboard has seven sheets, and the trend sheet shows MTD and YTD charts for each KPI. Microsoft explains charts in Create a chart from start to finish.
Frequently Asked Questions
Which sheets does the dashboard include?
Seven sheets: Summary Page, Dashboard, Trend, Actual Numbers, Target, Previous Year Numbers and KPI Definition.
How do I change the reporting month?
Select the month from the drop-down on the Dashboard sheet. The MTD and YTD figures, variances and arrows update for that month.
How do I enter my own performance data?
Type your monthly figures in the Actual Numbers sheet, your goals in the Target sheet and last year’s values in the Previous Year Numbers sheet. The cumulative values are calculated for you.
Can I see the trend of a single KPI?
Yes. The Trend sheet shows the KPI group, unit, type (LTB or UTB), formula and definition, with MTD and YTD charts for Actual, Target and Previous Year.
Is there a Power BI version?
Yes. See the Think Tanks KPI Dashboard in Power BI.
Related Think Tank Templates
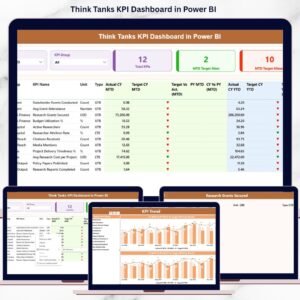
- Think Tanks KPI Dashboard in Power BI: the same KPIs as a Power BI report
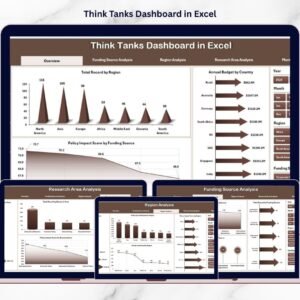
- Think Tanks Dashboard in Excel: another dashboard for think tank teams in Excel
- Think Tanks Dashboard in Power BI: the Power BI edition of that dashboard
- KPI Dashboard Library (Excel): 15 KPI dashboard templates in one download
Browse all Excel KPI dashboards.






























Reviews
There are no reviews yet.