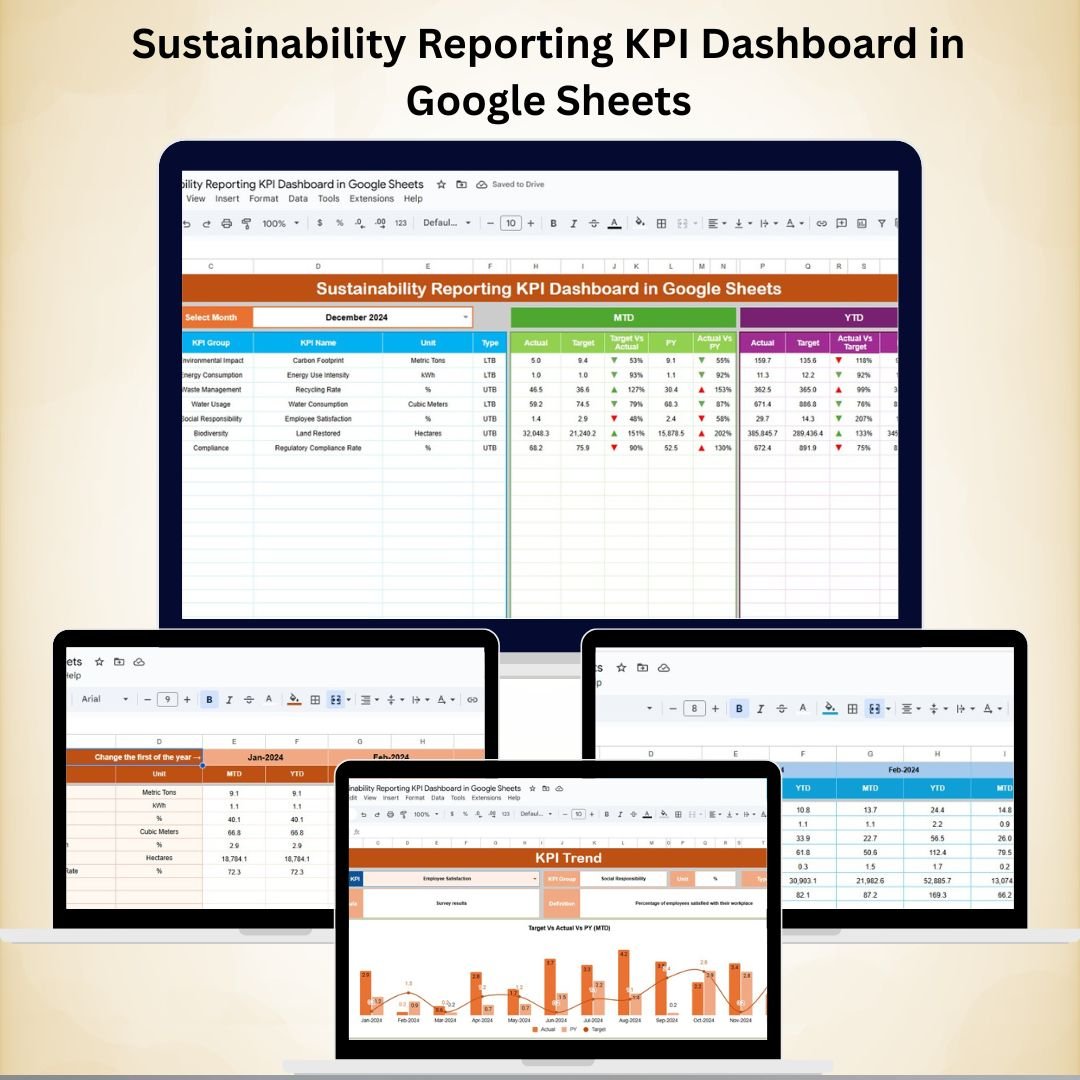
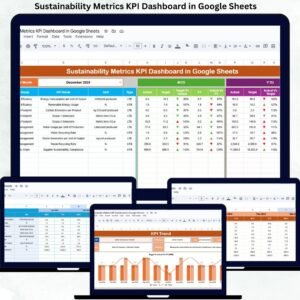
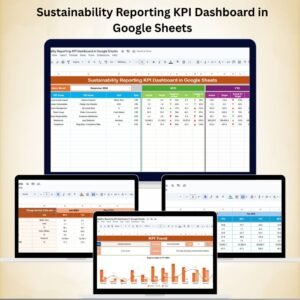
Sustainability is no longer optional—it’s a strategic necessity. 🌍 Companies today face increasing expectations from regulators, investors, and customers to measure, monitor, and report on sustainability performance. To meet these demands, you need a tool that combines simplicity, flexibility, and actionable insights. That’s where the Sustainability Reporting KPI Dashboard in Google Sheets comes in.
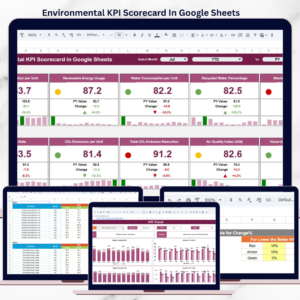
This ready-to-use dashboard empowers organizations to track environmental, social, and governance (ESG) KPIs with real-time visibility, clear visualizations, and automated calculations. From energy usage and emissions to waste reduction and water conservation, this dashboard centralizes all sustainability metrics into one accessible Google Sheet. ✅
🔑 Key Features of Sustainability Reporting KPI Dashboard in Google Sheets
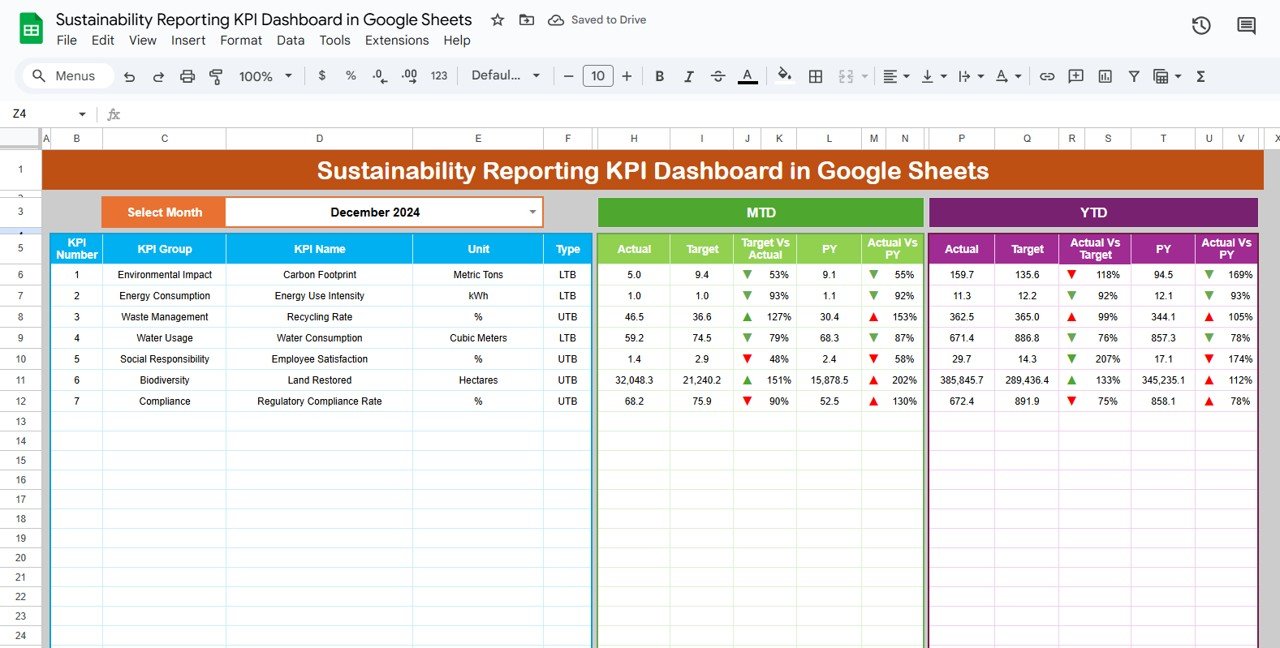
📊 Interactive Dashboard Tab
-
Select the month from a drop-down menu.
-
Instantly see MTD (Month-to-Date) and YTD (Year-to-Date) performance.
-
Conditional formatting highlights KPIs above or below targets.
-
Compare against previous year values for context.
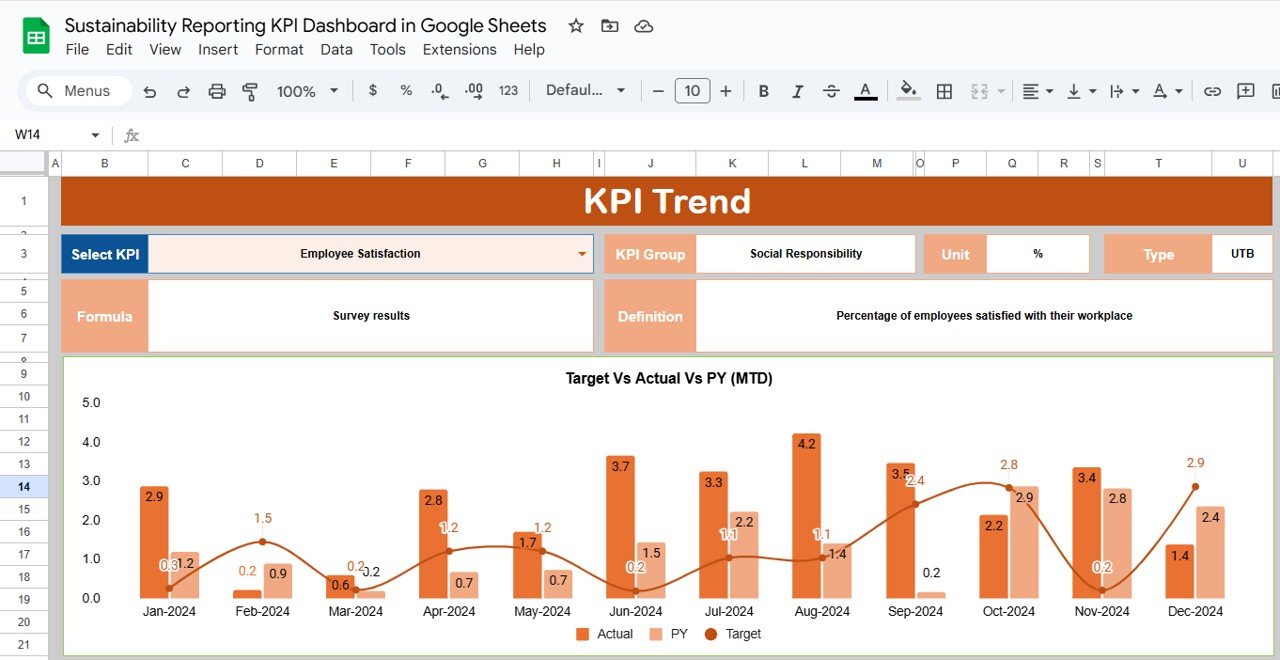
📈 KPI Trend Tab
-
Drill into specific KPIs by choosing from a drop-down list.
-
View KPI details: Group, Unit, Formula, and Type (UTB/LTB).
-
Analyze trends to identify patterns and performance gaps.
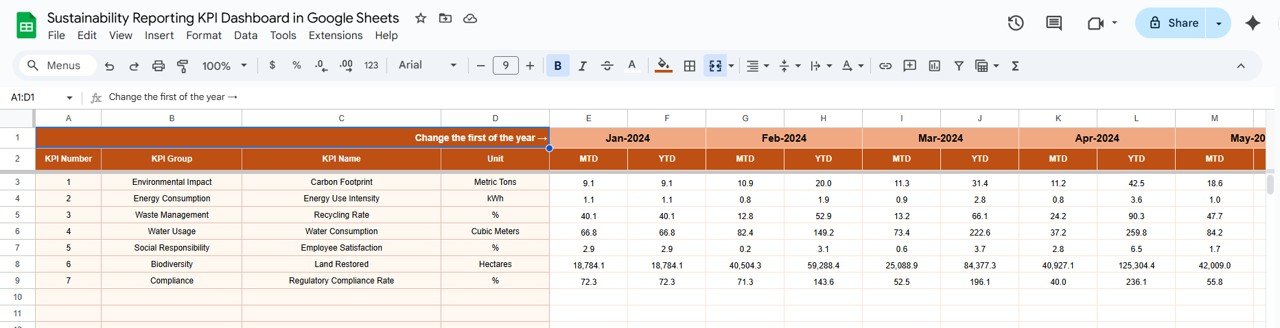
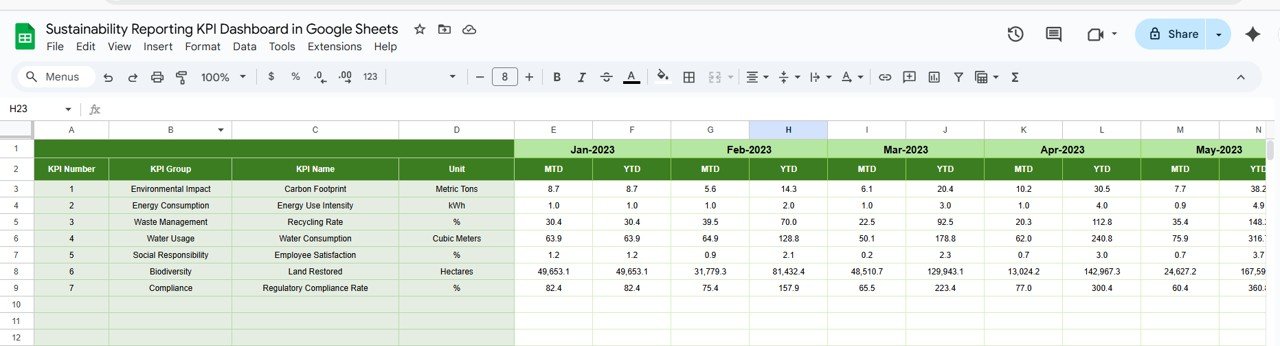
🧾 Actual Number Tab
-
Enter actual KPI data for each month.
-
Automatically updates dashboard calculations.
-
Supports pivot-based reporting for dynamic analysis.
🎯 Target Tab
-
Record monthly and YTD targets for each KPI.
-
Track Target vs Actual performance automatically.
-
Perfect for goal-setting and corrective planning.
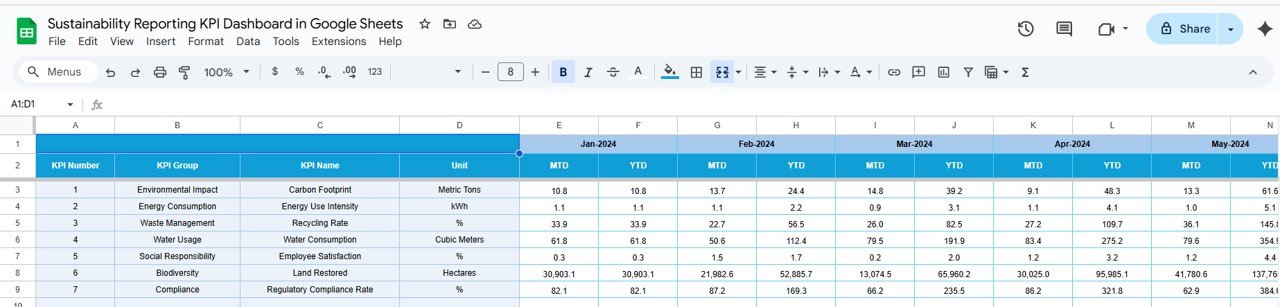
📉 Previous Year Tab
-
Store historical performance data.
-
Compare current year vs previous year progress.
-
Identify long-term sustainability improvements.
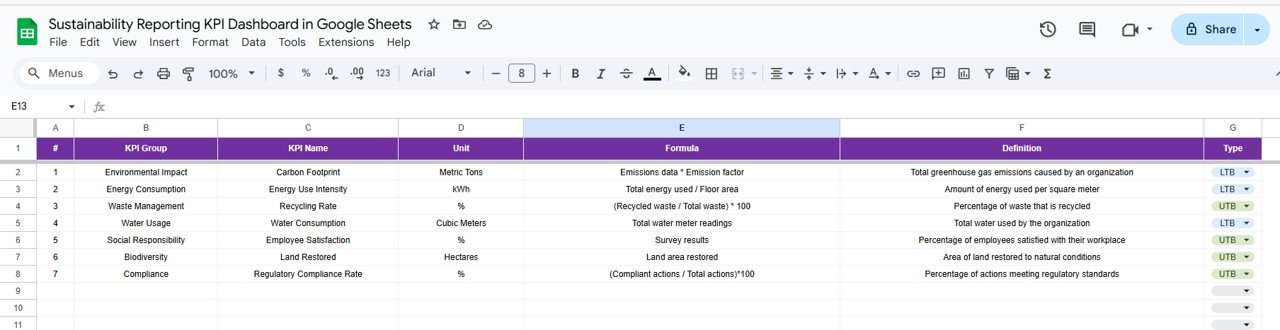
📚 KPI Definition Tab
-
Maintain a centralized reference for all KPIs.
-
Capture Name, Group, Unit, Formula, and Definition.
-
Mark each KPI as Upper the Better (UTB) or Lower the Better (LTB).
📦 What’s Inside the Dashboard?
When you download, you’ll get:
✅ 6 Pre-Built Worksheets – Dashboard, KPI Trend, Actuals, Targets, Previous Year, Definitions
✅ Pre-Formatted Charts & Conditional Formatting – No setup required
✅ Sample KPIs Included – For energy, waste, emissions, water, and more
✅ Customizable Structure – Add/remove KPIs as per your needs
✅ Cloud Accessibility – Access from anywhere, collaborate with teams in real-time
👥 Who Can Benefit from This Dashboard?
🌱 Sustainability Managers – Track ESG KPIs with transparency.
📊 Data & Reporting Teams – Automate sustainability reporting.
🏭 Operations Leaders – Monitor energy, waste, and efficiency metrics.
💼 SMEs & Enterprises – Comply with ESG standards at any scale.
📑 Auditors & Compliance Teams – Validate reporting with structured data.
This tool adapts to any organization size and industry.
🧾 How to Use the Sustainability Reporting KPI Dashboard
-
📥 Download and make a copy in Google Drive.
-
📝 Fill in KPI actuals in the Actual Number Tab.
-
🎯 Enter monthly & YTD goals in the Target Tab.
-
📊 Check performance insights on the Dashboard Tab.
-
🔍 Use the KPI Trend Tab for detailed analysis.
-
📉 Compare with Previous Year Tab to track improvements.
-
🤝 Share with your team for collaborative reporting.
With built-in formulas and formatting, you’ll be up and running in minutes—no advanced setup required. 🚀
🔗 Click here to read the Detailed blog post
Watch the step-by-step video Demo:


Reviews
There are no reviews yet.