
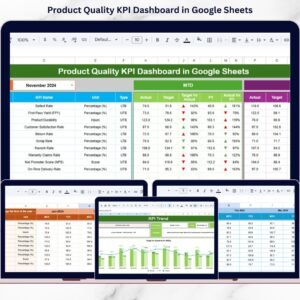
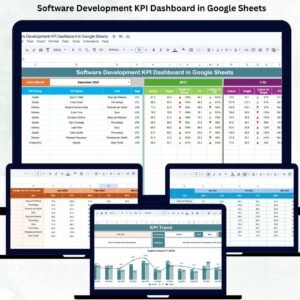
Software development moves at lightning speed. Teams work across sprints, manage bugs, push releases, optimize code quality, and align with delivery deadlines. In such a fast-paced environment, leaders need complete visibility into productivity, efficiency, quality, and DevOps performance. The Software Development KPI Dashboard in Google Sheets gives you exactly that—a powerful, automated, and cloud-based performance monitoring system built for modern engineering teams.Software Development KPI Dashboard in Google Sheets
This ready-to-use dashboard updates instantly as you enter actual numbers, targets, and previous-year data. It shows you whether your team is improving, falling behind, or staying consistent. From sprint velocity to defect density, from deployment success rate to cycle time, this dashboard helps every development team gain clarity, speed, and control.Software Development KPI Dashboard in Google Sheets
✨ Key Features of the Software Development KPI Dashboard in Google Sheets
📊 1. Real-Time Performance Tracking
The dashboard tracks both monthly (MTD) and year-to-date (YTD) performance for all KPIs. The moment you select the month, the dashboard recalculates every value instantly—targets, actuals, previous-year comparisons, and variances.Software Development KPI Dashboard in Google Sheets
⚡ 2. KPI Cards with Conditional Indicators
Each KPI displays green or red arrows, helping you quickly identify improvements and issues. This visual feedback is perfect for sprint reviews and leadership updates.
📈 3. Month-Wise Trend Analysis
Track how performance evolves month after month. Identify patterns like increasing bugs, slow deployments, or improved productivity.Software Development KPI Dashboard in Google Sheets
🧮 4. Automated Formulas
All KPI values—velocity, reopen rate, lead time, cycle time, story completion ratio, and more—are automatically calculated based on your data entry.
☁️ 5. Cloud-Based Collaboration
Teams across different locations can update the dashboard together. No version conflicts. No delays. Full transparency.
📦 What’s Inside the Software Development KPI Dashboard in Google Sheets
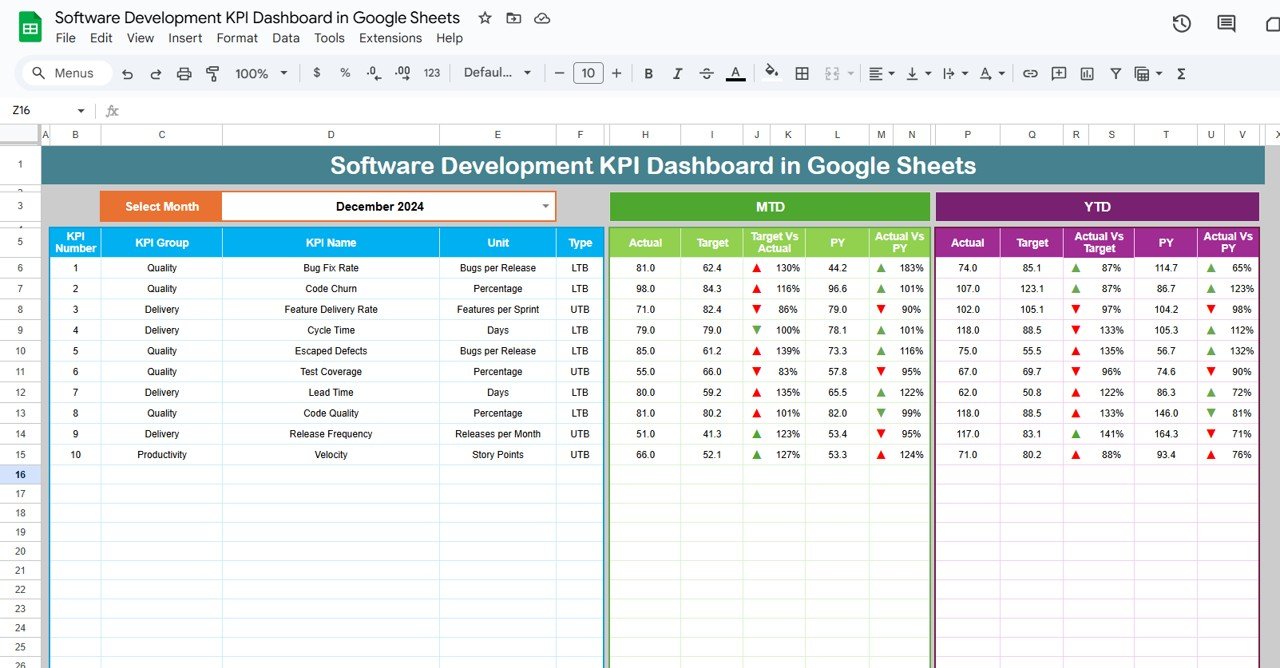
📍 1. Dashboard Sheet (Main Page)
The central page displays all KPI values for your selected month. You will see:
-
MTD Actual
-
MTD Target
-
MTD Previous Year
-
Target vs Actual
-
PY vs Actual
-
YTD Actual
-
YTD Target
-
YTD Previous Year
-
YTD vs Target
-
YTD vs Previous Year
With automatic arrows for improvement or decline, this page becomes your single source of truth for development performance.
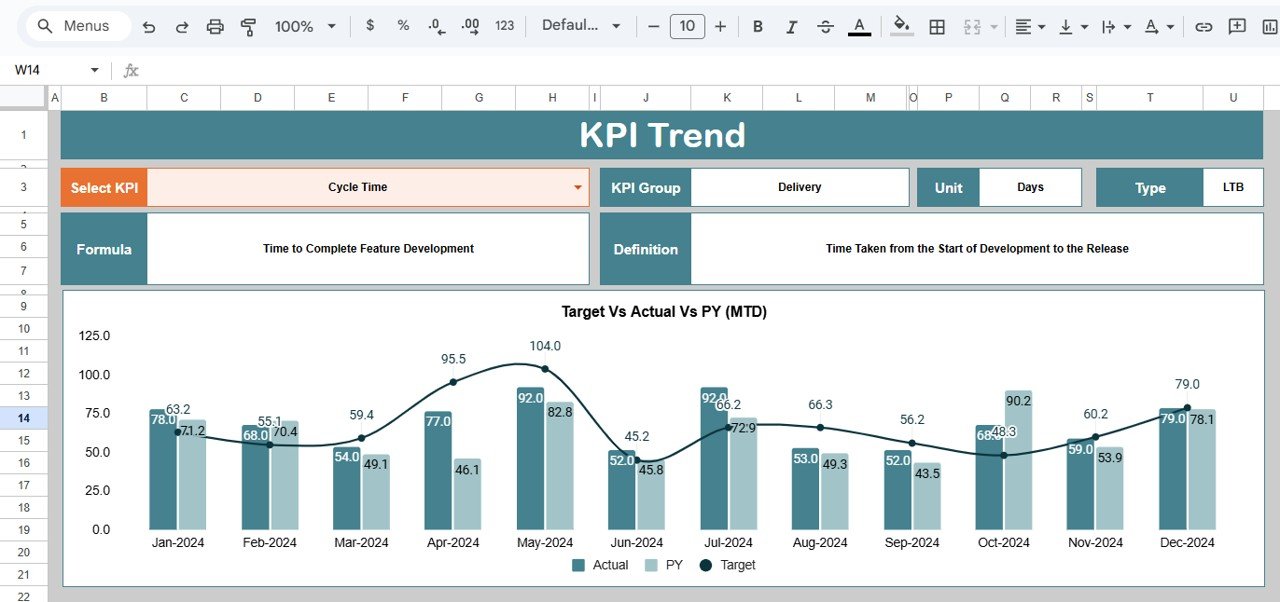
📊 2. KPI Trend Sheet
Here, you select one KPI from a dropdown and review:
-
KPI Name
-
KPI Group
-
Unit
-
Type (UTB or LTB)
-
Formula
-
Definition
-
Month-wise trend chart
This helps teams identify bottlenecks and improvement areas using long-term patterns.
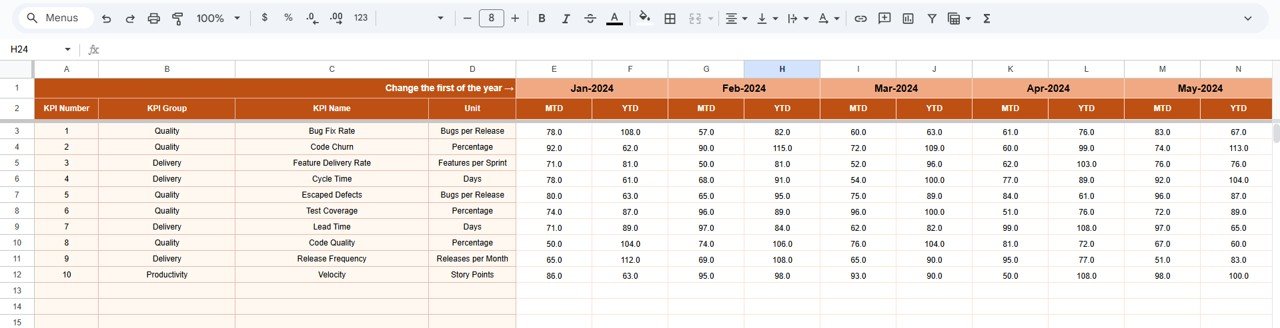
📝 3. Actual Number Sheet
Enter your monthly actual numbers here. Once you select the first month of the year in cell E1, the sheet automatically aligns all months.
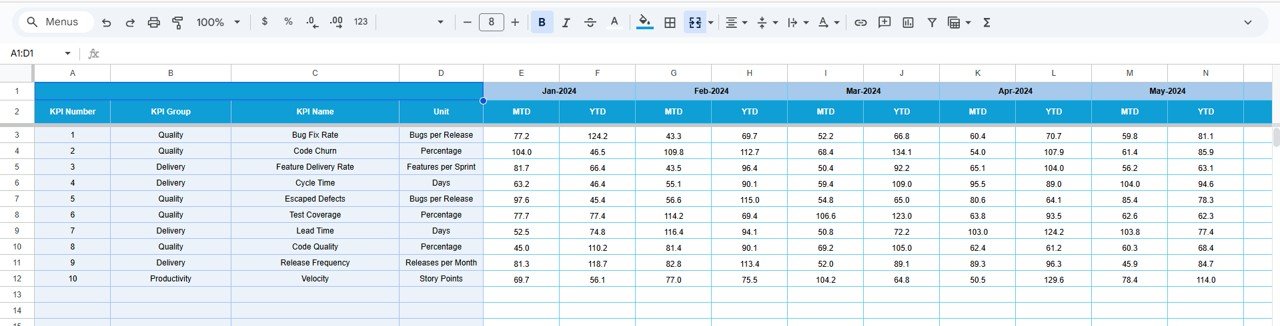
🎯 4. Target Sheet
Store your monthly targets for productivity, quality, velocity, and DevOps metrics. Teams update targets whenever priorities shift or new goals are set.
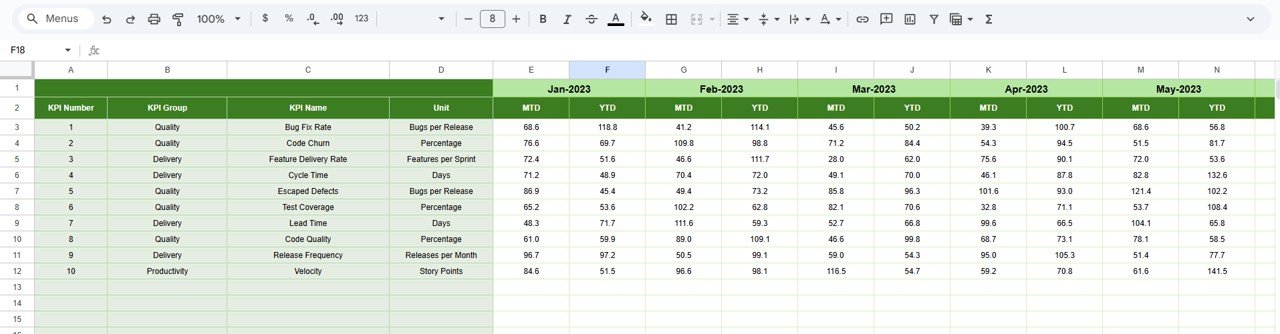
📆 5. Previous Year Sheet
Enter last year’s performance to unlock full comparative insights:
-
CY vs PY
-
Monthly improvement
-
YTD progress
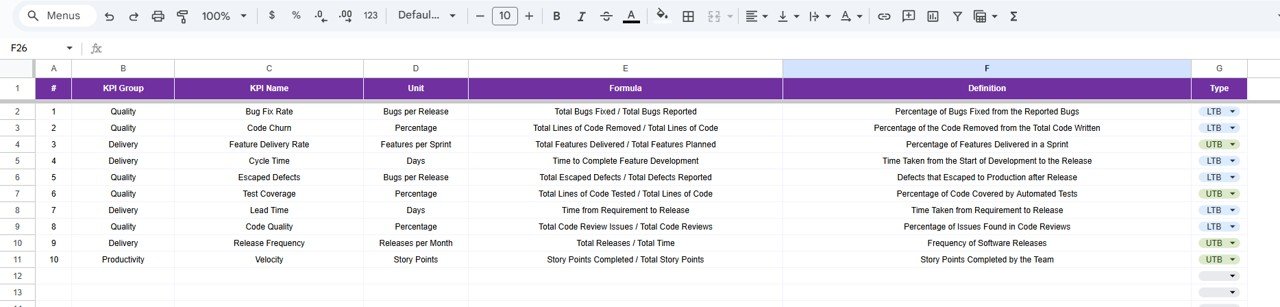
📚 6. KPI Definition Sheet
Your full KPI dictionary includes:
-
KPI Name
-
KPI Unit
-
Formula
-
KPI Group
-
Definition
-
KPI Type (UTB or LTB)
This ensures clarity, consistency, and training support for both new and experienced team members.
🎯 Who Can Benefit from the Software Development KPI Dashboard in Google Sheets
👨💻 Developers
Track performance indicators like code quality, bugs resolved, merge time, and efficiency.
🧑🏫 Scrum Masters
Monitor sprint velocity, completion ratio, and backlog movement.
🧑💼 Product Managers
Get visibility into release efficiency, lead time, and customer-reported defects.
👨💼 Engineering Managers
Track team productivity, bottlenecks, and DevOps reliability.
🧑💻 CTOs & Leadership
Analyze growth, long-term improvement, and delivery readiness.
Click here to read the Detailed blog post
Watch the step-by-step video tutorial:


Reviews
There are no reviews yet.