


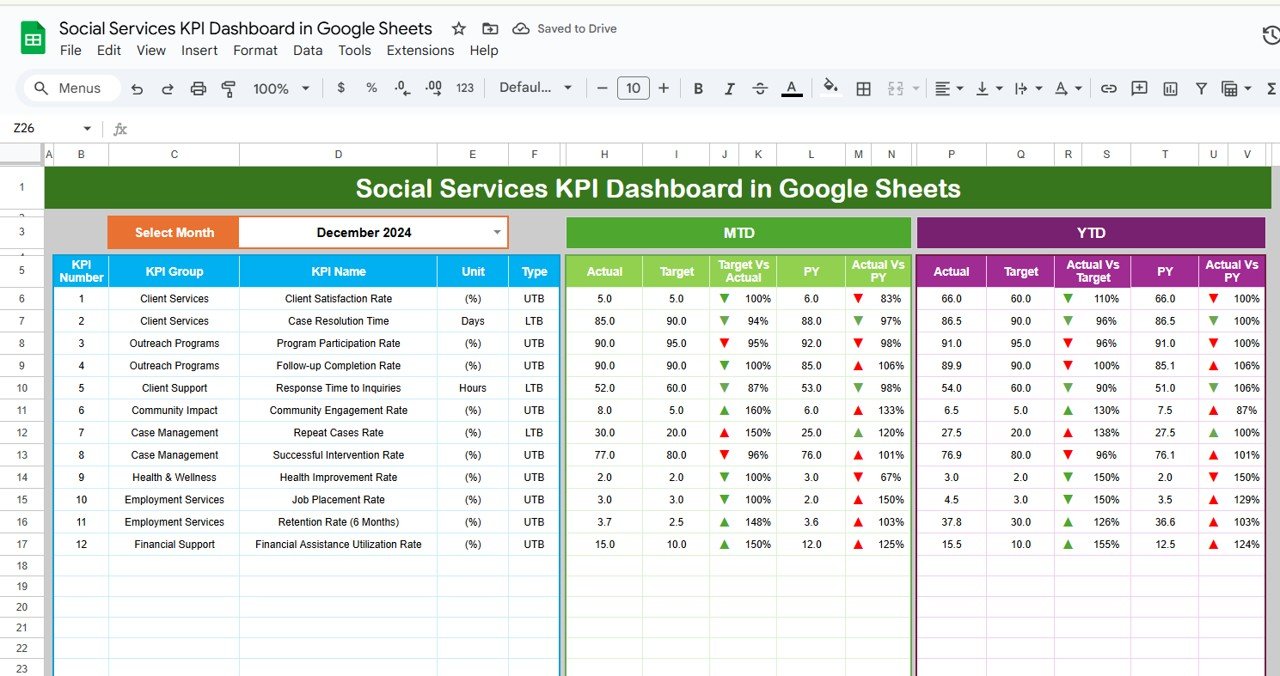
The Social Services KPI Dashboard in Google Sheets is a comprehensive and user-friendly tool designed to help social service organizations monitor and evaluate their key performance indicators (KPIs). Whether you’re managing community outreach programs, assessing service delivery, or tracking client outcomes, this dashboard provides a structured approach to visualize and analyze your data.
Key Features:
-
Customizable Metrics: Tailor the dashboard to your organization’s specific KPIs, such as client satisfaction, service utilization rates, and program effectiveness.
-
Real-Time Data Updates: Automatically refresh your data to ensure that your dashboard reflects the most current information.
-
Interactive Visualizations: Utilize charts and graphs to present your data in an easily digestible format, facilitating quick insights and decision-making.
-
User-Friendly Interface: Navigate through the dashboard with ease, thanks to its intuitive design and layout.
-
Collaboration Tools: Share the dashboard with team members and stakeholders to foster transparency and collaborative decision-making.
Benefits:
-
Enhanced Decision-Making: With real-time data and visualizations, make informed decisions that can improve service delivery and client outcomes.
-
Increased Accountability: Track progress towards your goals and identify areas for improvement, promoting accountability within your organization.
-
Resource Optimization: By identifying trends and patterns, allocate resources more effectively to areas that require attention.
-
Stakeholder Engagement: Keep stakeholders informed with up-to-date data, fostering trust and support for your programs.
How to Use:
-
Access the Template: Open the provided Google Sheets template link.
-
Customize Metrics: Modify the existing metrics or add new ones that align with your organization’s goals.
-
Input Data: Regularly update the dashboard with your organization’s data to keep it current.
-
Analyze Trends: Use the visualizations to identify trends and make data-driven decisions.
-
Share Insights: Collaborate with team members and stakeholders by sharing the dashboard and discussing the insights gathered.
Who Can Benefit:
-
Social Service Managers: Oversee program performance and client outcomes.
-
Data Analysts: Analyze trends and generate reports for decision-making.
-
Program Coordinators: Monitor service delivery and identify areas for improvement.
-
Stakeholders: Stay informed about the organization’s performance and impact.
By implementing the Social Services KPI Dashboard in Google Sheets, organizations can enhance their ability to monitor performance, make informed decisions, and ultimately improve the services they provide to the community.
Click here to read the Detailed blog post
Visit our YouTube channel to learn step-by-step video tutorials
Youtube.com/@PKAnExcelExpert


Reviews
There are no reviews yet.