

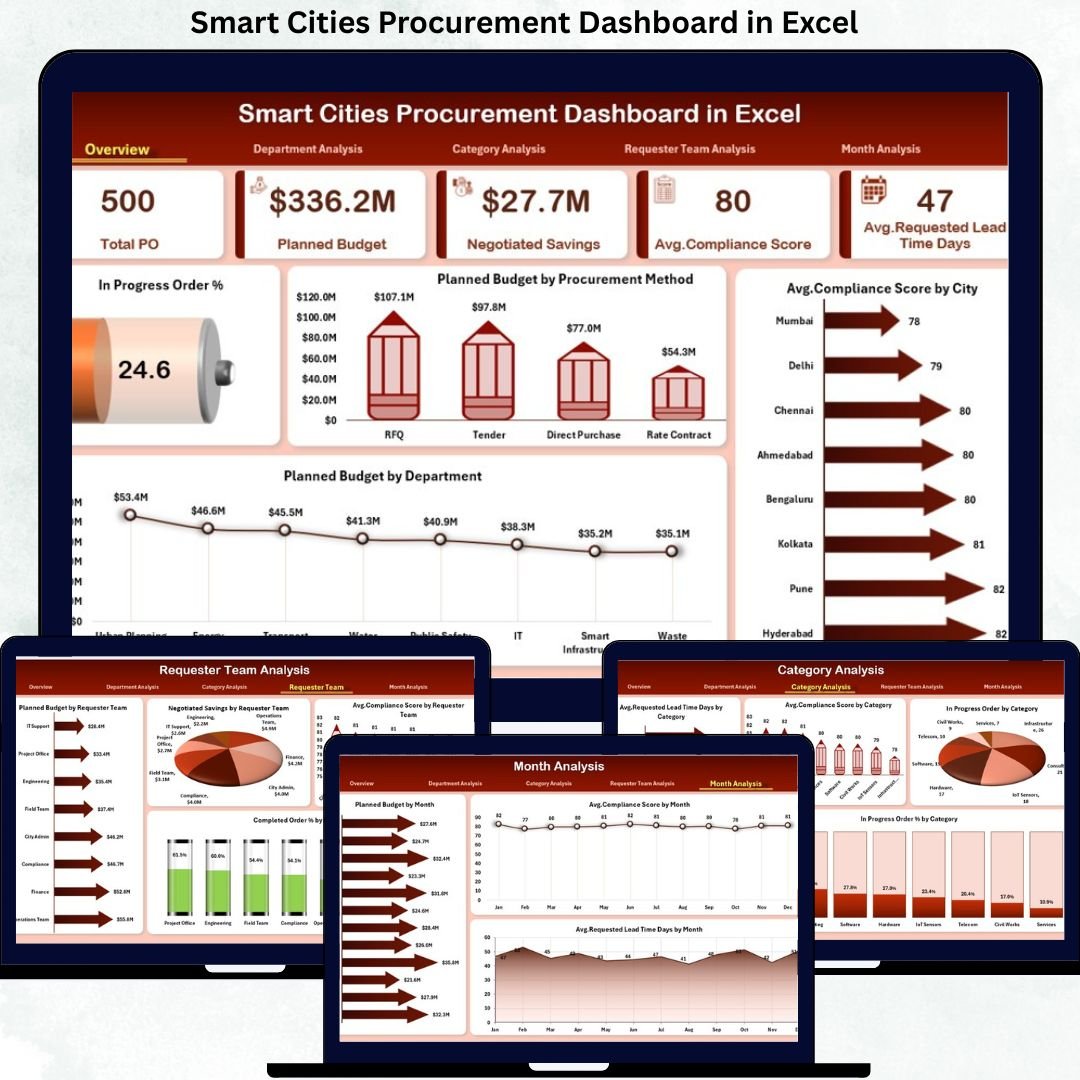



Smart cities operate under constant pressure to deliver transparency, efficiency, and accountability in public spending. Every procurement decision affects budgets, timelines, compliance, and citizen trust. However, when procurement data remains scattered across multiple Excel files, emails, and manual reports, visibility reduces, risks increase, and governance weakens.
That is exactly why the Smart Cities Procurement Dashboard in Excel becomes a powerful and practical solution 🚀
This ready-to-use Excel dashboard converts raw procurement data into clear KPIs, interactive visuals, and performance insights, enabling city administrators to make confident, data-driven decisions—without expensive BI tools or complex systems.
Designed specifically for smart city environments, this dashboard strengthens procurement governance while remaining simple, flexible, and cost-effective.
Key Features of Smart Cities Procurement Dashboard in Excel 🔑
📊 Centralized Procurement Monitoring
Track all procurement activities across departments, categories, and requester teams in one dashboard.
💰 Budget & Savings Visibility
Monitor planned budgets, negotiated savings, and cost efficiency clearly.
⏱️ Lead Time & Order Status Tracking
Analyze requested and promised lead times to reduce procurement delays.
✅ Compliance Performance Measurement
Evaluate average compliance scores across cities, departments, and categories.
🏢 Department & Requester Team Analysis
Improve accountability by comparing performance across internal teams.
📅 Month-Wise Procurement Trends
Identify seasonal patterns and long-term procurement behavior.
🧭 Interactive Slicers & Navigation
Filter insights instantly without formulas or VBA.
What’s Inside the Smart Cities Procurement Dashboard in Excel 📁
This dashboard contains five professionally designed analytical pages, supported by structured data and support sheets.
📄 Overview Page

The executive summary for city leaders.
Includes:
Right-side slicer for dynamic filtering
KPI cards for headline metrics
In Progress Order %
Planned Budget by Procurement Method
Average Compliance Score by City
Planned Budget by Department
This page delivers instant clarity on procurement health.
📄 Department Analysis Page
Evaluates procurement efficiency at the department level.
Includes:
Average Requested Lead Time by Department
Negotiated Savings by Department
Average Promised Lead Time by Department
Average Compliance Score by Department
Helps identify high-performing and risk-prone departments.
📄 Category Analysis Page
Focuses on procurement behavior by category.
Includes:
Average Requested Lead Time by Category
Average Compliance Score by Category
In-Progress Orders by Category
In-Progress Order % by Category
Supports strategic sourcing and category optimization.
📄 Requester Team Analysis Page
Highlights how internal requester teams impact procurement outcomes.
Includes:
Planned Budget by Requester Team
Negotiated Savings by Requester Team
Average Compliance Score by Requester Team
Completed Order % by Requester Team
Improves internal accountability and training effectiveness.
📄 Month Analysis Page
Tracks procurement trends over time.
Includes:
Planned Budget by Month
Average Compliance Score by Month
Average Requested Lead Time by Month
Supports forecasting, planning, and performance reviews.
How to Use the Smart Cities Procurement Dashboard in Excel 🛠️
1️⃣ Update procurement records in the Data Sheet
2️⃣ Refresh pivot tables with one click
3️⃣ Use slicers to filter by department, category, team, or month
4️⃣ Review KPIs, compliance, lead times, and budgets
5️⃣ Use insights for audits, reviews, and planning
No macros. No VBA. No technical complexity.
Who Can Benefit from This Smart Cities Procurement Dashboard 👥
🏙️ City Procurement Managers – Improve visibility and control
💰 Finance & Audit Teams – Strengthen compliance and governance
📊 Smart City Program Teams – Track procurement efficiency
🧑💼 Policy Makers – Support transparency initiatives
🏢 Urban Planning Departments – Improve data-driven decisions
Suitable for both small municipalities and large smart city programs.
### Click here to read the Detailed blog post
Visit our YouTube channel to learn step-by-step video tutorials
Watch the step-by-step video tutorial:
Compatibility and Requirements
- Works in Microsoft Excel desktop (Excel 2016 or later, or Microsoft 365).
- The dashboard uses pivot tables and slicers. Refresh the pivot tables after you update the Data Sheet. Microsoft explains slicers in Use slicers to filter data.
Frequently Asked Questions
How many dashboard pages are included?
Five analytical pages: Overview, Department Analysis, Category Analysis, Requester Team Analysis and Month Analysis. Structured data and support sheets sit behind them.
How do I update the dashboard with my own data?
Enter your procurement records in the Data Sheet, then refresh the pivot tables with one click. The KPI cards and charts update from there.
Does it need macros or VBA?
No. The dashboard uses pivot tables and slicers only.
What can I filter with the slicers?
You can filter by department, category, requester team or month. The Overview page also has a slicer on the right side.
Which compliance and lead time views does it show?
It shows average compliance score by city, department, category, requester team and month. It also shows average requested and promised lead times by department, and requested lead time by category and by month.
Is there a Power BI version?
Yes. See the Smart Cities Procurement Dashboard in Power BI.
Related Smart Cities Templates
- Smart Cities Procurement Dashboard in Power BI: the same procurement dashboard in Power BI
- Smart Cities Procurement KPI Dashboard in Excel: a KPI-focused view of procurement
- Smart Cities Purchasing Dashboard in Excel: a purchasing view in Excel
- Smart Cities Contract Management Dashboard in Excel: contract tracking for city teams
- Smart Cities Tender Dashboard in Excel: tender tracking in Excel
Browse all Excel dashboards.



















Reviews
There are no reviews yet.