The Small Business KPI Dashboard in Google Sheets is a powerful tool designed to help small business owners track and manage their most important metrics. Whether you’re focused on revenue growth, customer acquisition, or employee productivity, this customizable dashboard offers an intuitive way to monitor key performance indicators (KPIs) in real-time. With this tool, small business owners can make data-driven decisions to optimize their operations and improve business performance.
🔑 Key Features of the Small Business KPI Dashboard:
-
Comprehensive KPI Tracking: Track essential KPIs such as sales revenue, profit margin, customer acquisition cost, and employee productivity all in one place.
-
Real-Time Data Updates: As you input your actual data, the dashboard automatically updates, providing real-time insights into your business performance.
-
Customizable for Your Business: Tailor the dashboard by adding or removing KPIs based on your specific needs and business goals.
-
Clear Performance Metrics: View your performance through various metrics such as Month-to-Date (MTD), Year-to-Date (YTD), and previous year data, helping you compare current performance with past results.
-
User-Friendly Interface: Easily navigate between different sheets, view charts, and track progress with clear visualizations and conditional formatting.
-
Collaboration-Friendly: Share the dashboard with your team to keep everyone aligned on performance metrics and goals.
What’s Inside the Small Business KPI Dashboard Template 🧑💼📅
This Small Business KPI Dashboard template contains six essential worksheets to help you monitor all aspects of your business performance:
-
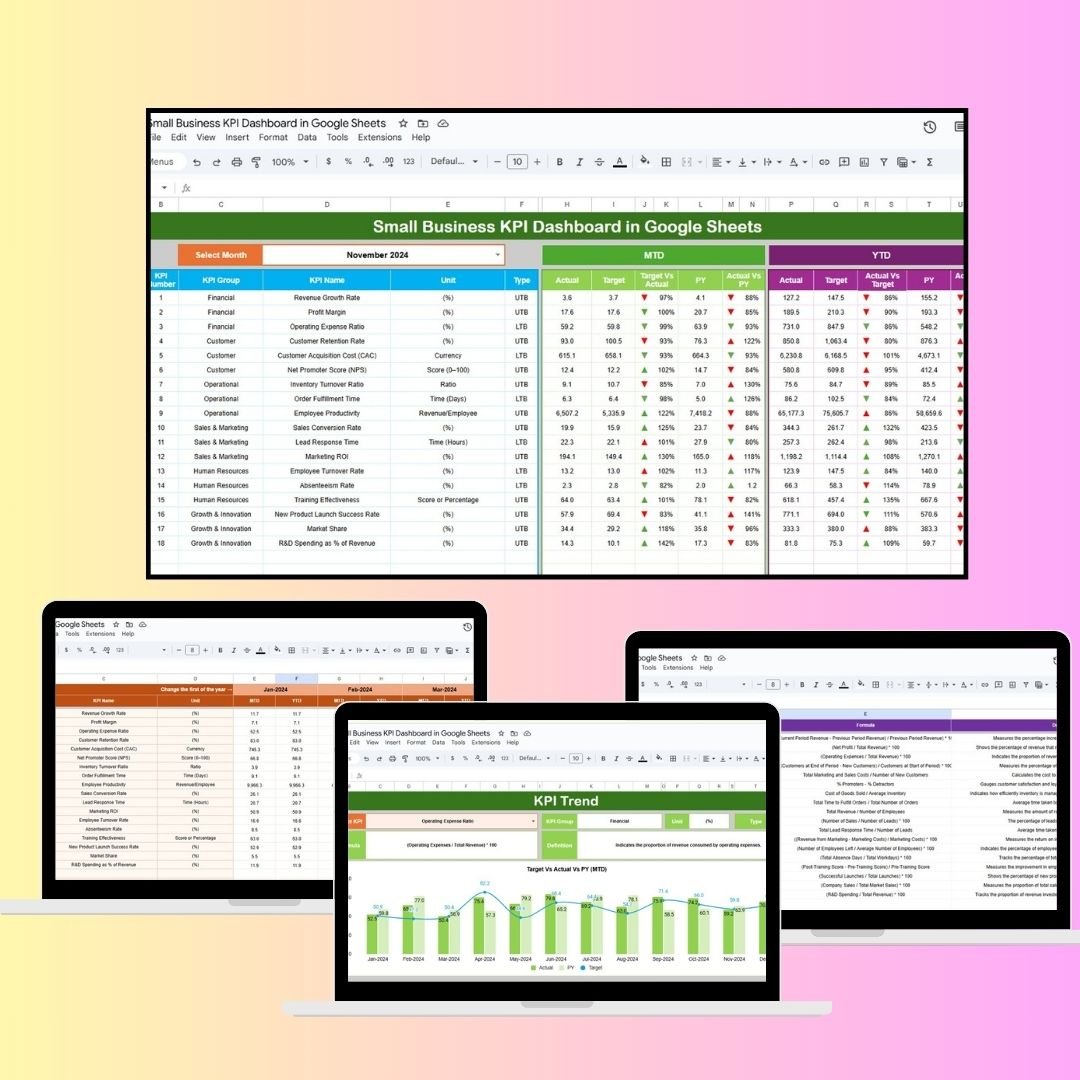
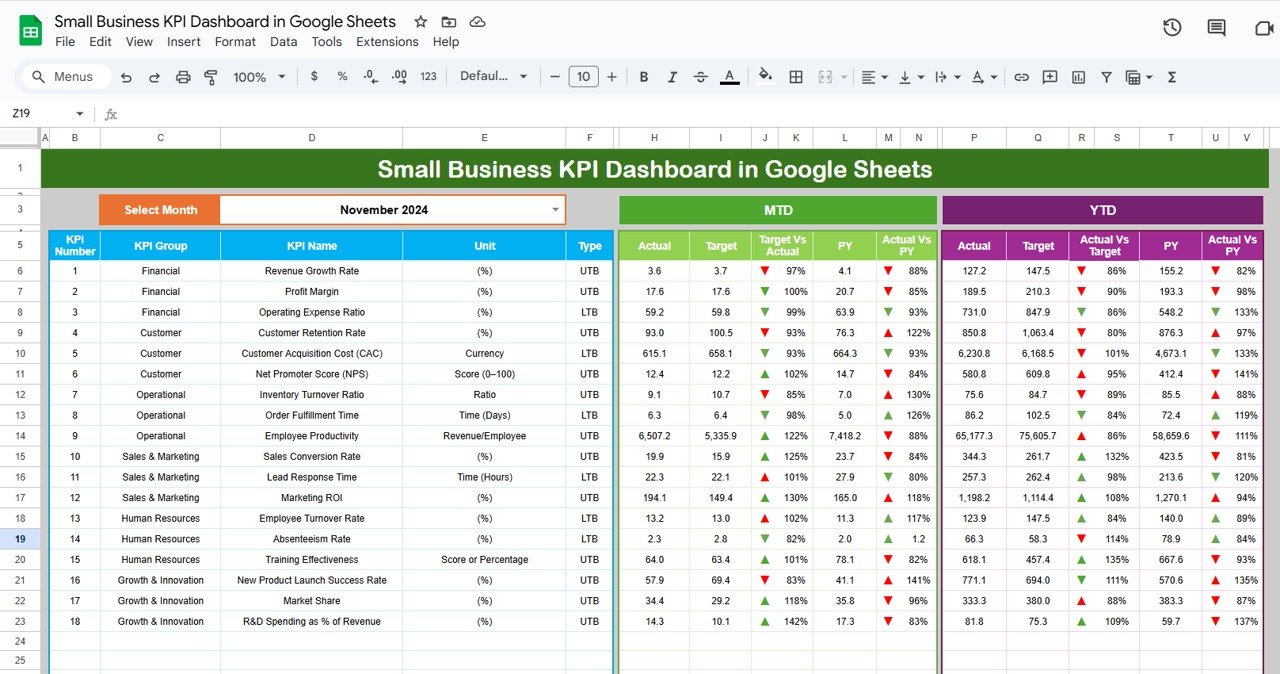
Dashboard Sheet: The central hub for all your KPI data, where you can:
-
Select the Month: The dashboard updates automatically when you select the month.
-
View MTD and YTD Performance: Compare actual performance with targets and previous year’s data.
-
Visual Indicators: Use color-coded arrows to visually see whether you’re meeting or exceeding your targets.
-
-
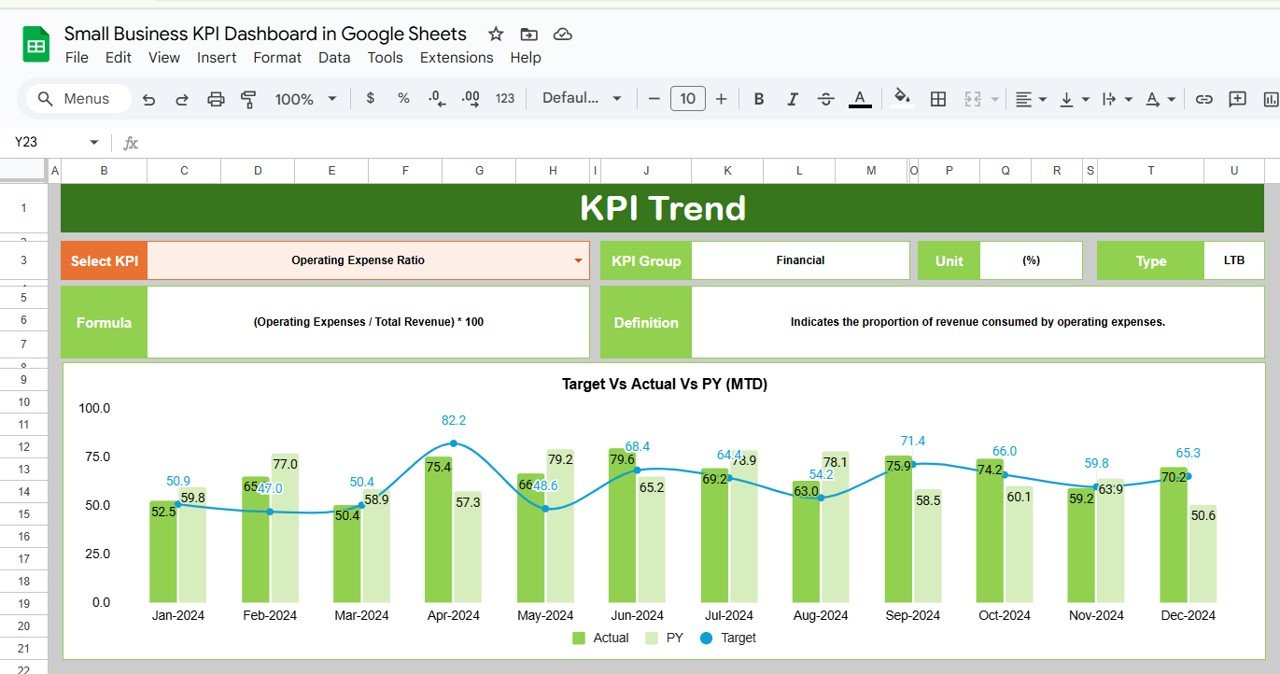
KPI Trend Sheet: Track the performance of each KPI over time. The sheet includes:
-
KPI Dropdown: Select a KPI and view its historical performance.
-
KPI Details: Includes information about the KPI’s unit, type (Lower the Better or Upper the Better), and calculation formula.
-
-
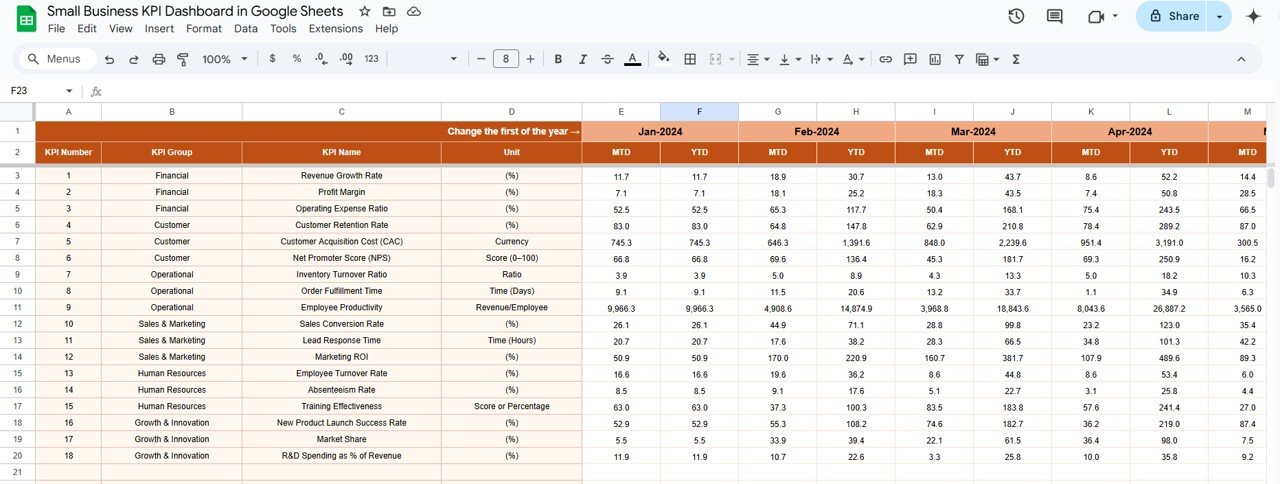
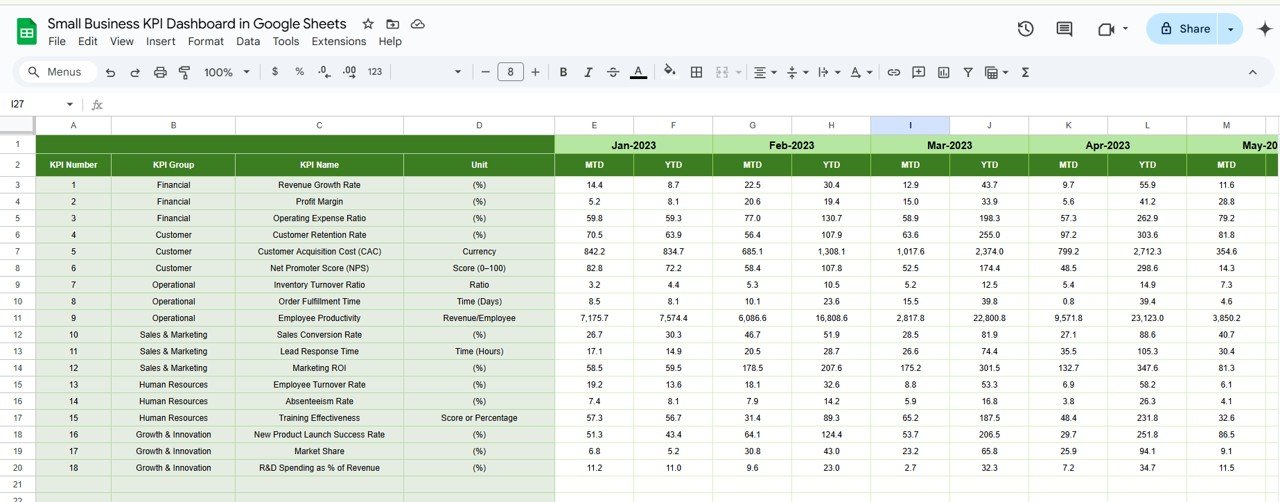
Actual Numbers Sheet: Input your actual data for MTD and YTD, ensuring the dashboard reflects the most up-to-date information.
-
Dynamic Month Selection: Change the starting month, and the dashboard updates accordingly.
-
-
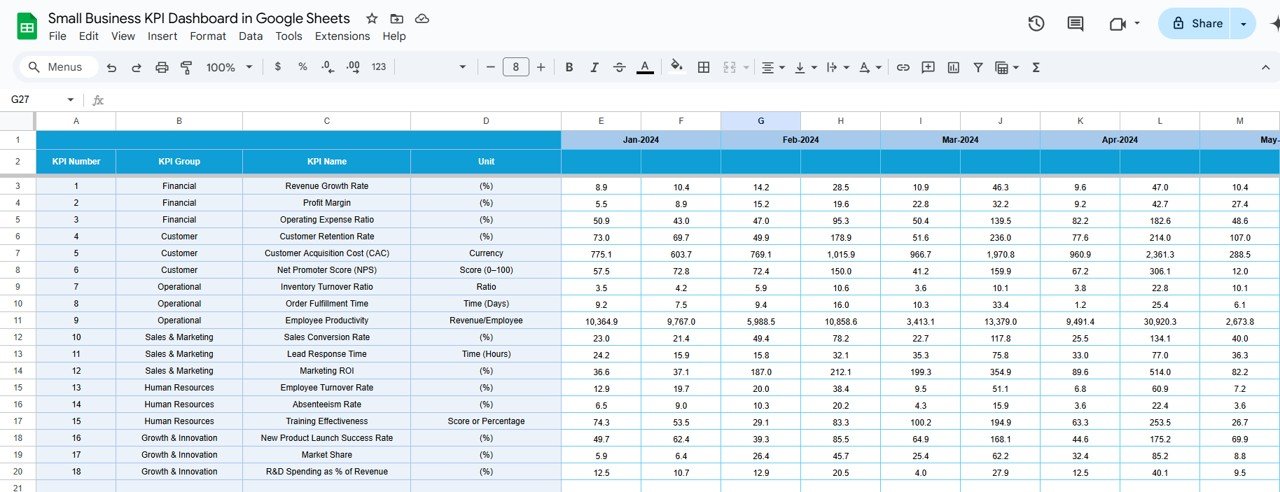
Target Sheet: Enter target values for each KPI, both for monthly and yearly tracking. The sheet includes:
-
Monthly and YTD Targets: Set realistic targets to measure your business performance.
-
-
Previous Year Number Sheet: Compare this year’s data with last year’s performance for better insights and analysis.
-
Track Historical Data: Input previous year’s data for year-over-year (YoY) comparisons.
-
-
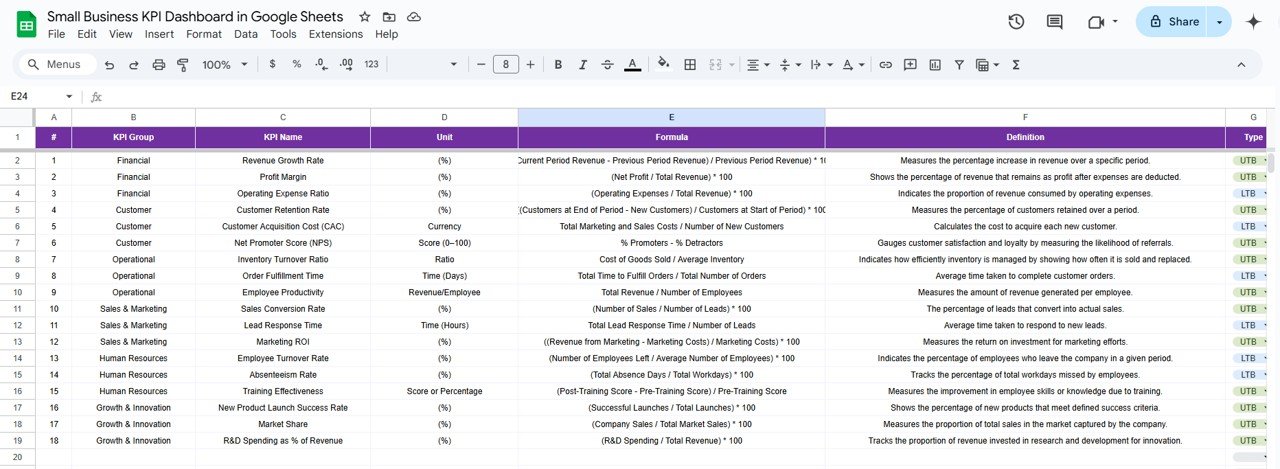
KPI Definition Sheet: Define each KPI used in the dashboard, including:
-
KPI Name, Group, and Unit: Clear definitions for each metric to ensure everyone understands the calculations.
-
Formula and Definition: Detailed explanations of how each KPI is calculated.
-
How to Use the Small Business KPI Dashboard 📉📋
To make the most of the Small Business KPI Dashboard, follow these easy steps:
-
Download and Open the Template: Open the dashboard in Google Sheets and start entering your business data.
-
Input Your Actual Numbers: Enter your MTD and YTD data in the Actual Numbers Sheet to track your performance.
-
Set Your Targets: Input your monthly and yearly targets in the Target Sheet to compare actual data against your goals.
-
Track Your Progress: Use the Dashboard Sheet to monitor performance and compare actual results with your targets.
-
Analyze Trends: Use the KPI Trend Sheet to view historical data and make informed decisions about where to focus your efforts.
Who Can Benefit from This Small Business KPI Dashboard? 🏢📊
This dashboard is designed for small business owners, managers, and teams who need an efficient way to track and manage their KPIs. Whether you’re running a retail shop, a service business, or an e-commerce store, this tool can help you streamline operations and stay on top of key metrics.
-
Small Business Owners: Keep track of your business’s financial health, customer acquisition costs, and operational performance.
-
Sales Managers: Track sales revenue, customer retention, and other key metrics to improve performance and meet sales goals.
-
Marketing Teams: Monitor campaign effectiveness and track customer acquisition costs to ensure the marketing budget is being used efficiently.
-
HR Managers: Track employee productivity, turnover, and other workforce-related metrics to improve HR operations.
Advantages of Using the Small Business KPI Dashboard 📈💼
-
Real-Time Data Insights: Monitor your business’s performance in real-time, ensuring you can make quick, informed decisions.
-
Customizable for Your Business Needs: Easily adjust the dashboard to track the KPIs most relevant to your business operations.
-
Visual Performance Metrics: Use charts, graphs, and color-coded arrows to instantly assess how your business is performing against targets.
-
Improved Goal Setting: Set clear and achievable targets for each KPI to improve focus and drive business growth.
-
Easy Collaboration: Share the dashboard with your team, ensuring everyone is aligned on key metrics and business goals.
Click here to read the Detailed Blog Post 📖
Watch the step-by-step video Demo:


Reviews
There are no reviews yet.