

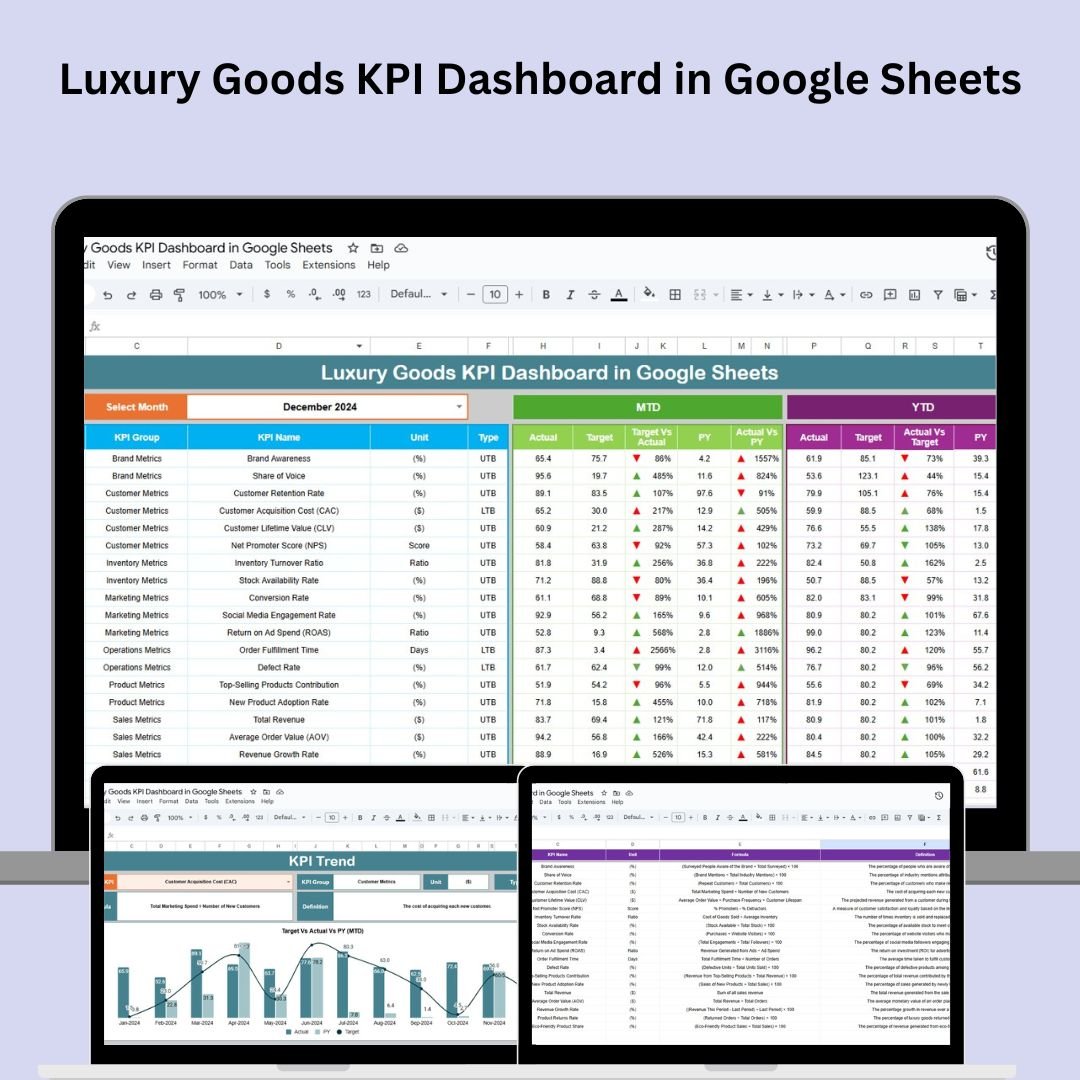

The Luxury Goods KPI Dashboard in Google Sheets is a powerful and easy-to-use tool designed to help luxury brands track and analyze essential business metrics. Whether you’re monitoring sales revenue, customer satisfaction, or inventory turnover, this dashboard gives you real-time insights into your business’s performance. By consolidating key performance indicators (KPIs) into one centralized view, this tool enables informed decision-making to ensure your brand stays competitive in a constantly evolving market.
🔑 Key Features of the Luxury Goods KPI Dashboard:
Real-Time Data Updates: Stay up-to-date with monthly and yearly performance data, allowing you to make immediate adjustments.
Target vs Actual Comparison: Easily compare your current performance to your targets and previous year’s data using clear visual indicators (up/down arrows).
Customizable Structure: Tailor the dashboard to your specific business needs, adjusting KPIs, targets, and input data.
Sales Performance Tracking: Monitor sales performance month-to-month, identifying trends and areas for improvement.
Customer Satisfaction Insights: Track customer satisfaction and retention rates to ensure you’re delivering a superior experience.
Market Share Analysis: Analyze your brand’s market share and performance across different regions, helping identify opportunities for global expansion.
What’s Inside the Luxury Goods KPI Dashboard 🏷️💼
Inside the Luxury Goods KPI Dashboard, you’ll find six essential worksheets designed to streamline your business performance monitoring:
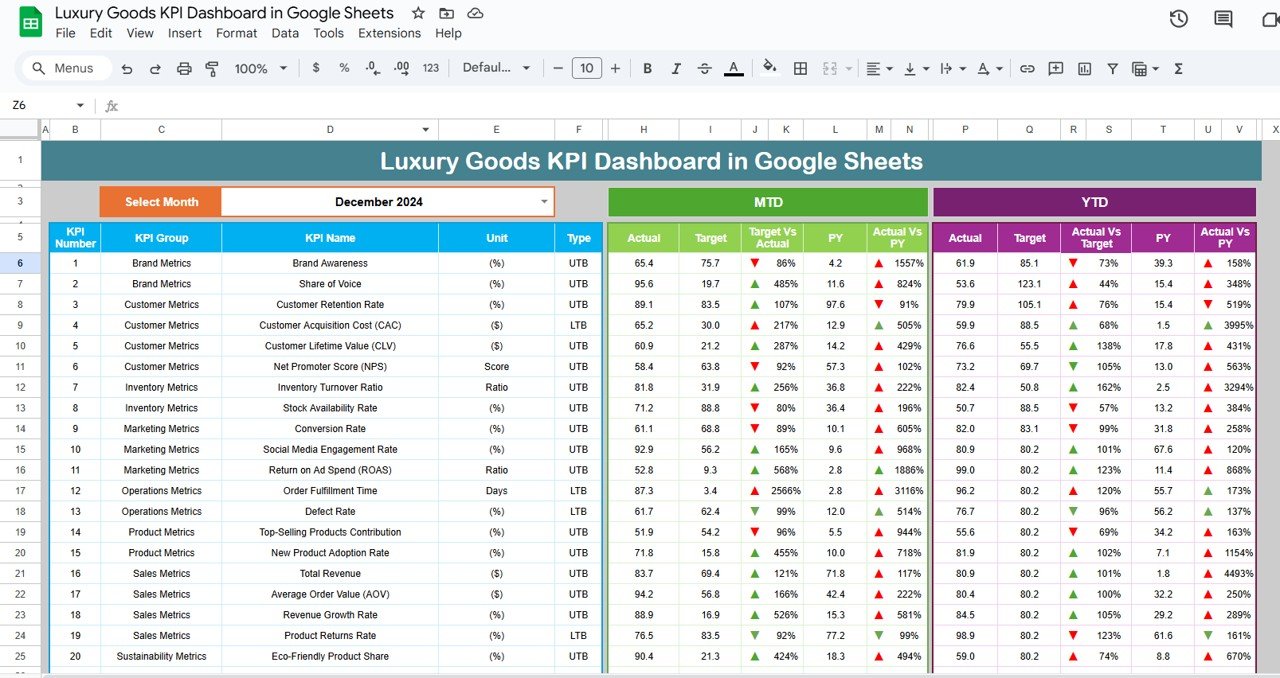
Dashboard Sheet: The central hub of the dashboard where all key performance metrics are displayed. It includes:
MTD (Month-to-Date) and YTD (Year-to-Date): View your actuals, targets, and comparisons with the previous year.
Target vs Actual Comparison: See how you’re performing against your goals and last year’s numbers with visual aids like up/down arrows.
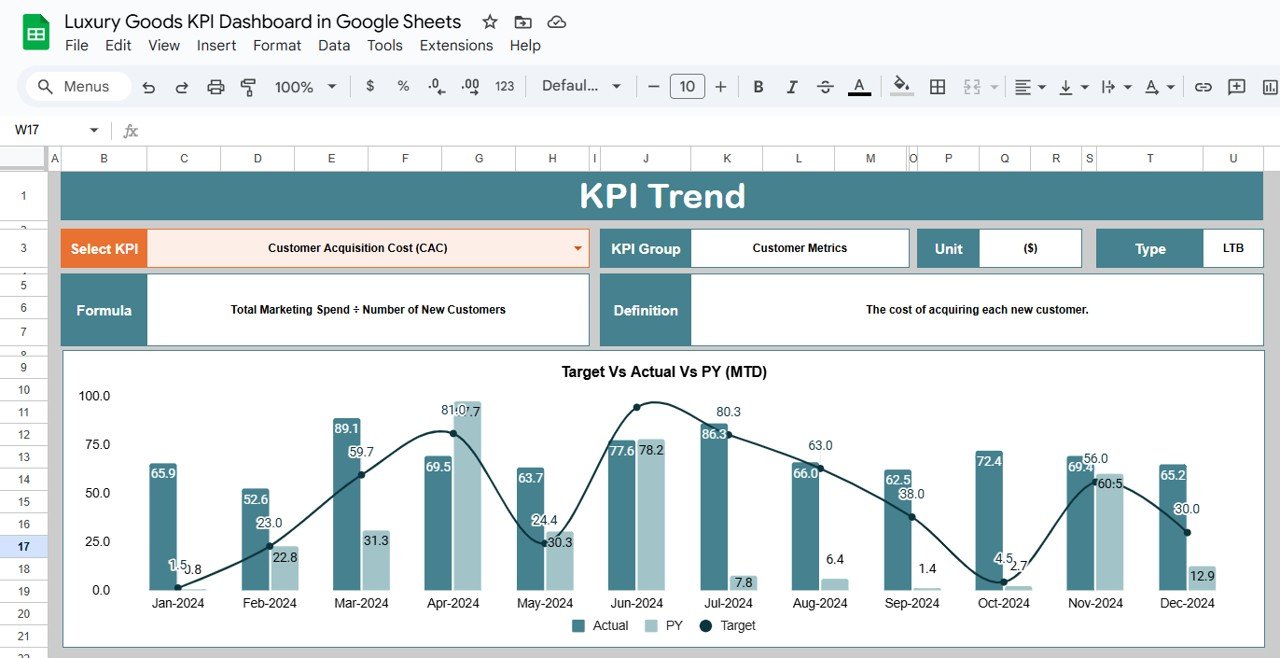
KPI Trend Sheet: Analyze trends for any selected KPI, including group, unit of measure, formula, and definitions, giving you clarity on how each metric impacts your business.
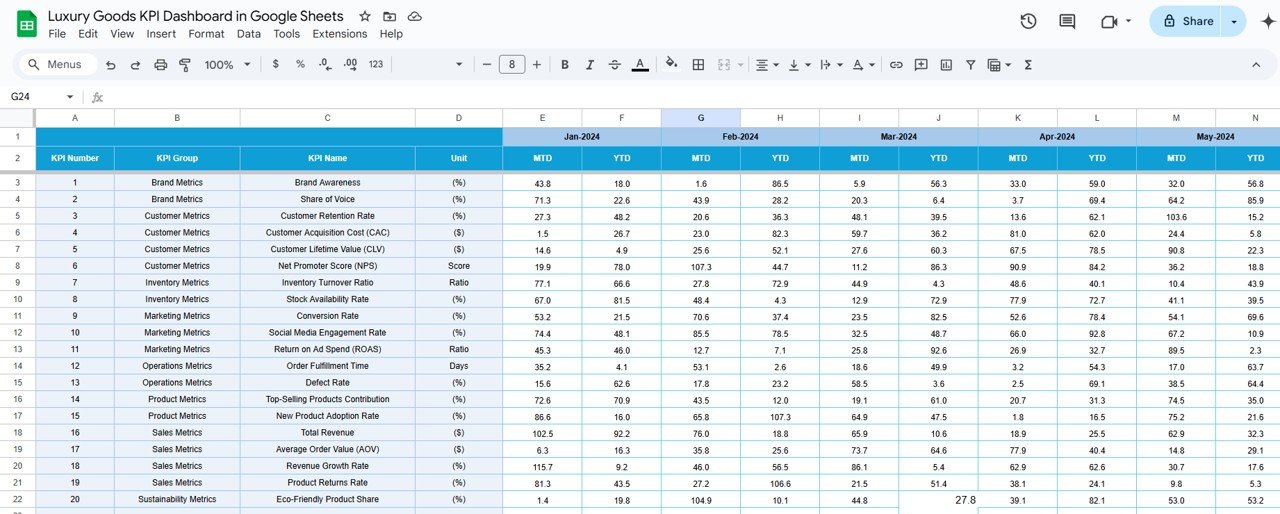
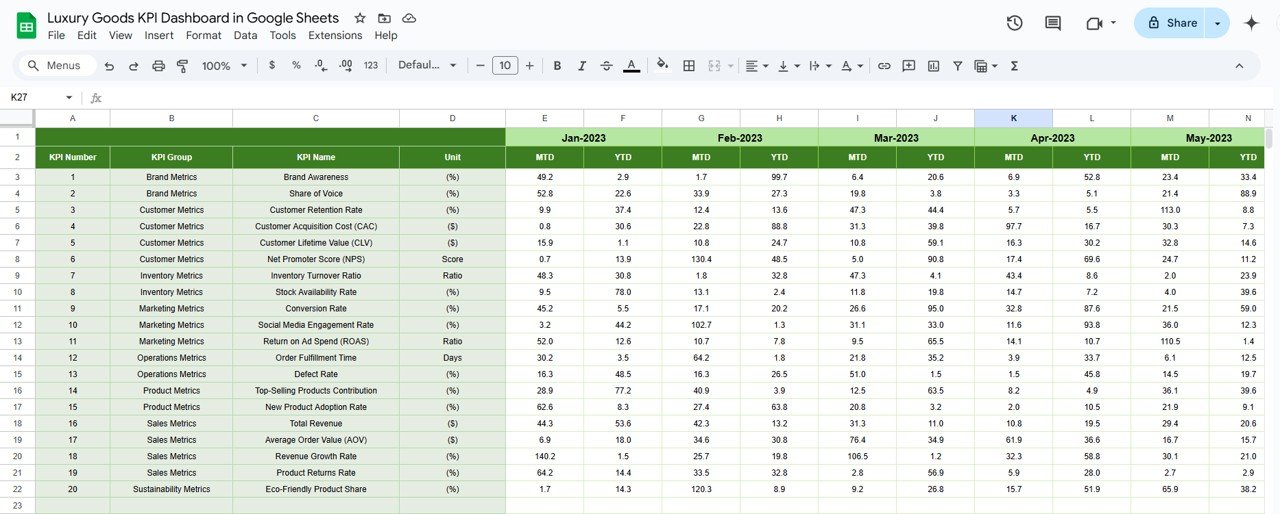
Actual Numbers Sheet: This is where you input actual data for MTD and YTD for the selected month. The dashboard automatically updates when new data is entered.
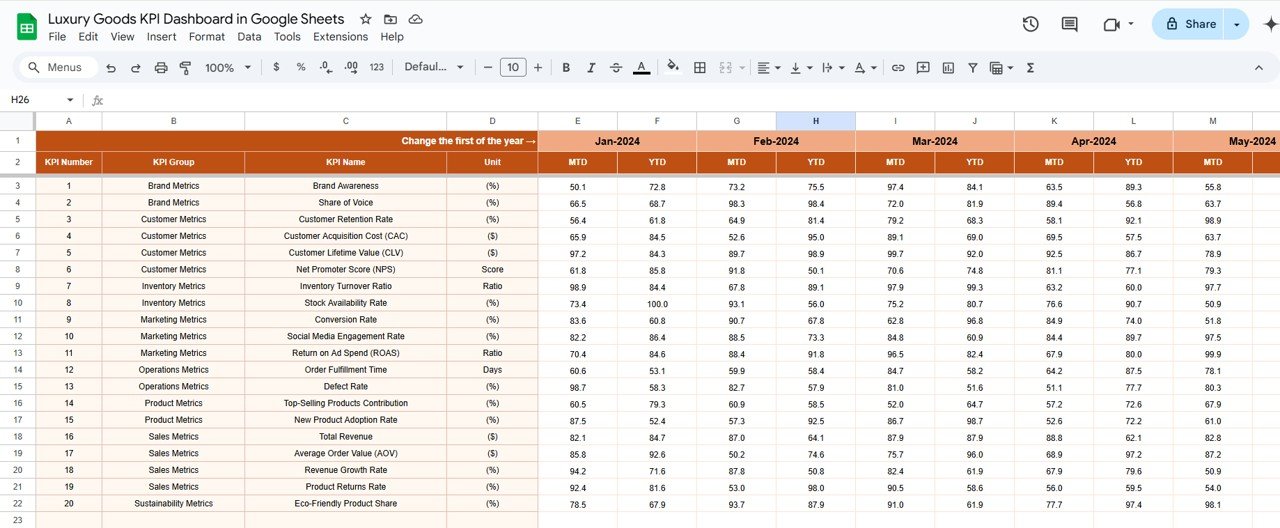
Target Sheet: Define your target numbers for each KPI, both for MTD and YTD, so you can track whether your business is meeting its goals.
Previous Year Numbers Sheet: Track performance comparisons with last year’s data for insightful year-over-year analysis.
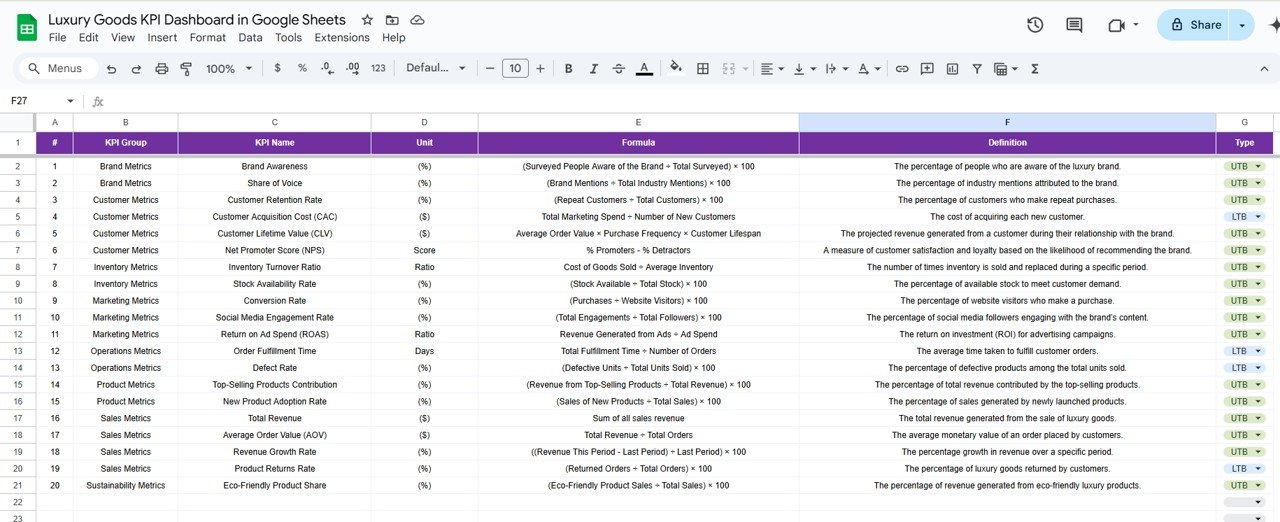
KPI Definition Sheet: This sheet outlines each KPI, its name, group, unit, formula, and definition, ensuring clarity and consistency across your team.
How to Use the Luxury Goods KPI Dashboard 📈🎯
To make the most of the Luxury Goods KPI Dashboard, follow these steps:
Download the Template: Open the dashboard in Google Sheets and start entering your data.
Update Data Regularly: Input your MTD and YTD data to keep the dashboard up to date.
Set Targets: Enter your sales, customer satisfaction, and other targets in the Target Sheet to monitor performance.
Track Performance: Use the Dashboard Sheet to monitor KPIs and track your performance against set targets.
Analyze Trends: Leverage the KPI Trend Sheet to assess performance over time and spot areas for improvement.
Who Can Benefit from This Luxury Goods KPI Dashboard? 🏢🌍
This dashboard is perfect for businesses in the luxury goods industry looking to track their performance and stay competitive. Whether you’re a small luxury brand or a multinational corporation, this tool helps ensure you’re always on top of your KPIs.
Luxury Brand Managers: Track overall business performance, including sales revenue, customer retention, and market share.
Marketing Teams: Measure the effectiveness of your marketing campaigns by tracking key customer satisfaction and retention metrics.
Sales Teams: Monitor sales revenue and adjust strategies to meet targets.
Executive Teams: Use the dashboard to make data-driven decisions and plan for global expansion.
Advantages of Using the Luxury Goods KPI Dashboard 💎📉
Improved Data Visibility: All critical metrics are in one place, making it easy to track performance and make informed decisions.
Real-Time Performance Monitoring: Update the dashboard regularly for real-time insights, helping you act quickly on performance gaps.
Enhanced Strategic Planning: With clear visibility into key metrics, you can plan for growth, identify weaknesses, and make necessary adjustments.
Better Customer Experience: Monitor customer satisfaction and retention KPIs to ensure you are providing a top-tier experience.
Increased Profitability: By optimizing sales, inventory, and customer satisfaction metrics, you can improve the bottom line and enhance business performance.
Click here to read the Detailed Blog Post 📖
Watch the step-by-step video Demo:
Visit our YouTube Channel to Learn Step-by-Step Video Tutorials 🎥
YouTube.com/@NeotechNavigators
Compatibility and Requirements
- Works in Google Sheets. You need a free Google account and a web browser.
- Up and down arrows compare actuals with targets and the previous year. Google explains charts in Add & edit a chart or graph.
Frequently Asked Questions
How many worksheets are included?
Six: Dashboard, KPI Trend, Actual Numbers, Target, Previous Year Numbers and KPI Definition.
What can I compare on the Dashboard?
MTD and YTD actuals against targets and the previous year’s numbers, with up and down arrows for each KPI.
Which KPIs does it cover?
Areas such as sales revenue, customer satisfaction, customer retention, market share and inventory turnover. You can adjust the KPIs and targets.
Does it update when I add data?
Yes. Enter MTD and YTD figures in the Actual Numbers sheet and the Dashboard updates automatically.
Is there an Excel or Power BI version?
Yes. See the Luxury Goods KPI Dashboard in Excel and the Luxury Goods KPI Dashboard in Power BI.
Related Luxury Brand Templates
- Luxury Goods KPI Dashboard in Excel: the same KPIs in Excel
- Luxury Goods KPI Dashboard in Power BI: the Power BI edition
- Luxury Goods KPI Scorecard in Google Sheets: a scorecard view
- Luxury Goods Dashboard in Google Sheets: sales and operations analysis
- Luxury Retail KPI Dashboard in Google Sheets: store-level retail KPIs
Browse all Google Sheets KPI dashboards.






Reviews
There are no reviews yet.