
The Sales KPI Dashboard in Google Sheets is a powerful tool designed to help sales teams, business owners, and managers track and analyze key sales metrics. This template allows you to monitor performance, visualize trends, and make data-driven decisions to boost sales performance. With a user-friendly interface and customizable features, this dashboard makes it easier than ever to stay on top of your sales targets and goals.
Whether you are tracking individual sales reps, product performance, or overall sales goals, this Google Sheets dashboard provides real-time insights into sales activity, making it an essential tool for sales management and performance optimization.
Key Features of the Sales KPI Dashboard in Google Sheets
📊 Sales Metrics Tracking: Monitor key sales KPIs such as revenue, units sold, conversion rates, and more.
⚙️ Customizable Data Inputs: Easily adjust the template to track your specific sales goals, targets, and metrics.
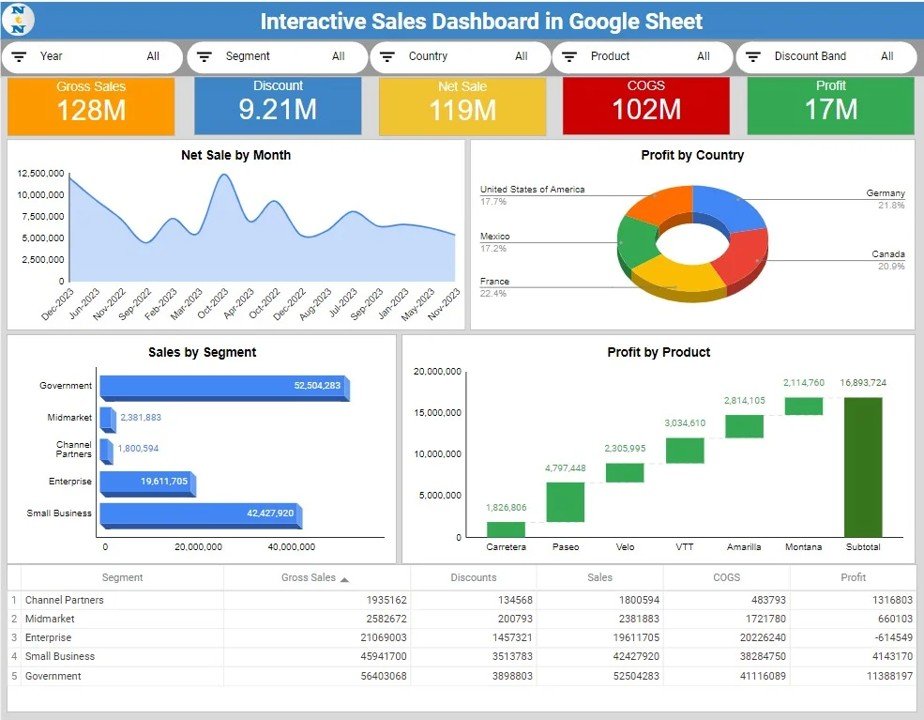
📈 Performance Visualization: Use built-in charts and graphs to visualize your sales performance and trends.
💼 Real-Time Monitoring: Track your sales performance in real time, ensuring you are always on top of your targets.
📅 Target Comparison: Compare actual sales performance against set targets to measure success and identify areas for improvement.
🔄 Real-Time Collaboration: Share the template with your team and collaborate in real time to stay aligned on sales goals.
Why You’ll Love the Sales KPI Dashboard in Google Sheets
✅ Track Sales Effectively: Keep track of key sales metrics to understand how your team is performing and where improvements can be made.
✅ Visualize Your Data: Use charts to quickly spot trends, strengths, and weaknesses in your sales process.
✅ Customizable for Your Needs: Modify the dashboard to fit your unique sales process, whether you’re tracking revenue, units sold, or sales rep performance.
✅ Data-Driven Insights: Make informed decisions based on visualized data to optimize your sales strategy.
✅ Real-Time Updates: Ensure that your sales data is always up to date, allowing you to act quickly on any changes.
What’s Inside the Sales KPI Dashboard in Google Sheets?
📊 Sales Metrics Tracker: Track key sales metrics such as revenue, conversion rates, deals closed, and more.
⚙️ Custom Sales Targets: Set and compare sales targets against actual performance to measure progress.
📈 Visual Dashboards: Built-in charts and graphs to visualize your sales data and identify trends.
💼 Sales Rep Performance: Track individual sales rep performance and measure their contributions to the overall sales goals.
📊 Revenue Analysis: Analyze revenue performance by product, region, or sales channel for targeted strategies.
How to Use the Sales KPI Dashboard in Google Sheets
1️⃣ Download the Template – Get access to the pre-configured sales KPI dashboard template.
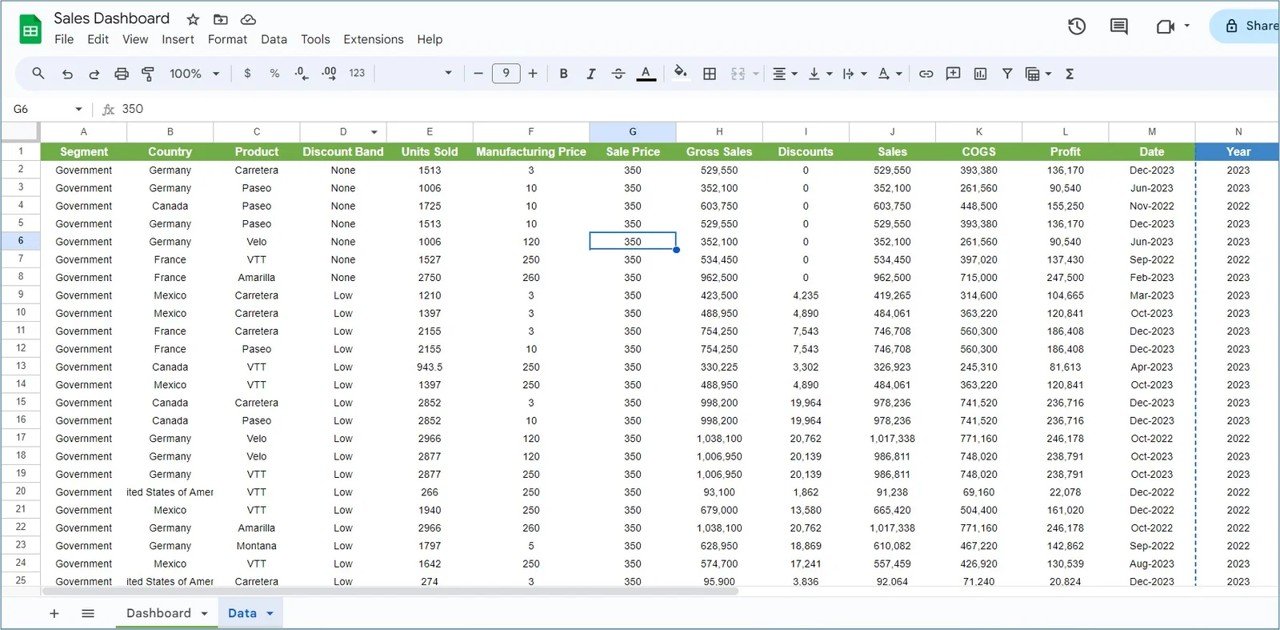
2️⃣ Input Sales Data: Enter sales data such as revenue, units sold, and sales rep performance.
3️⃣ Set Sales Targets: Input your sales targets and compare actual performance to see where you stand.
4️⃣ Visualize Trends: Use charts to analyze sales performance, trends, and areas for improvement.
5️⃣ Collaborate: Share the dashboard with your team to collaborate on sales strategies and monitor performance.
Who Can Benefit from the Sales KPI Dashboard in Google Sheets?
🔹 Sales Managers
🔹 Business Owners
🔹 Sales Teams
🔹 Marketing Teams
🔹 Consultants
🔹 Entrepreneurs
🔹 E-commerce Businesses
Track, measure, and optimize your sales performance with the Sales KPI Dashboard in Google Sheets. Visualize data, monitor progress, and ensure your team meets its sales goals effectively.
Click here to read the detailed blog post
Visit our YouTube channel to learn step-by-step video tutorials


Reviews
There are no reviews yet.