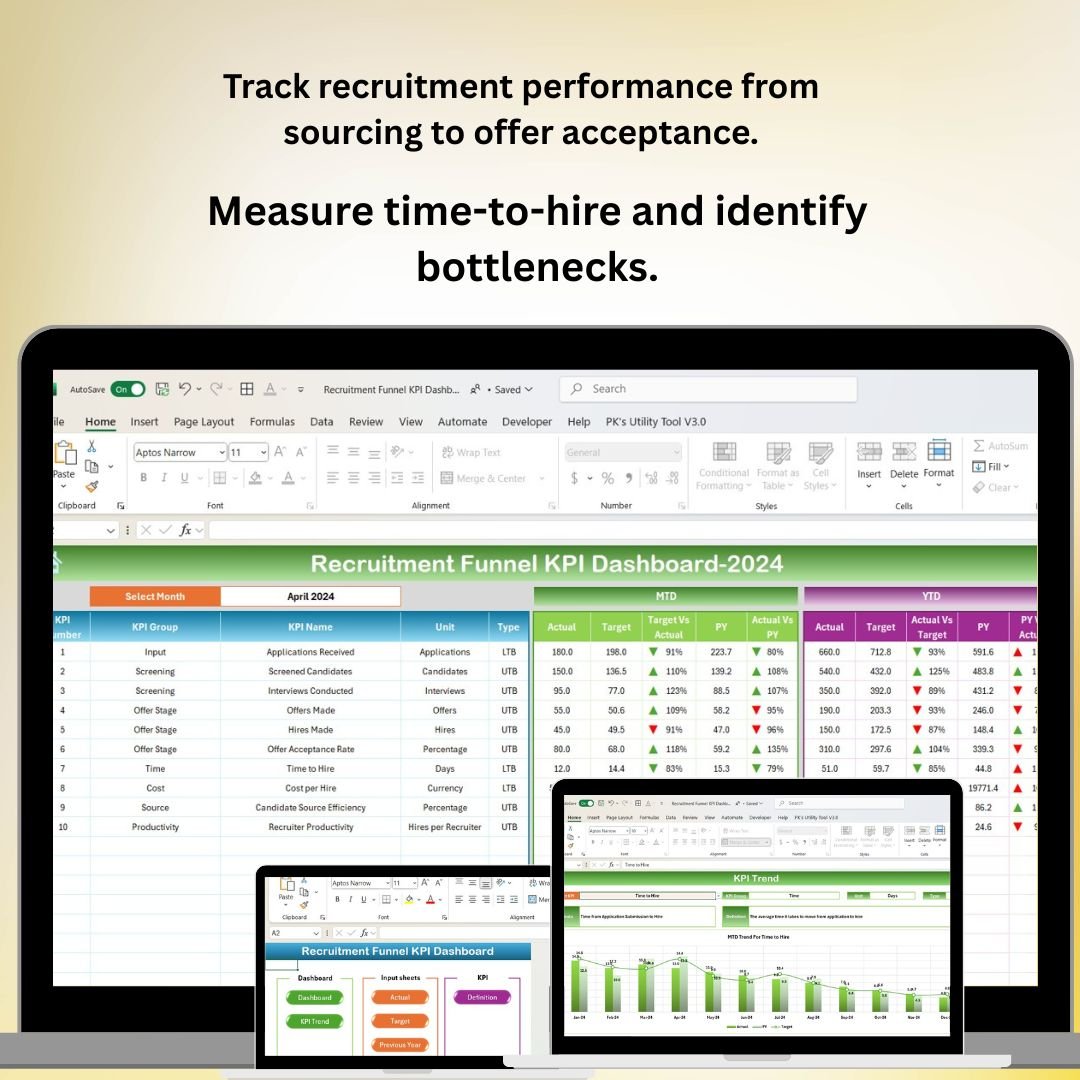


The Recruitment Funnel KPI Dashboard in Excel is a powerful tool designed for HR teams, recruiters, and hiring managers to track and optimize the recruitment process. This Excel-based dashboard allows you to monitor key performance indicators (KPIs) at every stage of the recruitment funnel, from sourcing candidates to onboarding. It helps you identify bottlenecks, optimize recruitment efforts, and ensure that the hiring process is efficient and effective.
With detailed tracking, customizable charts, and real-time updates, this dashboard ensures that you can make data-driven decisions to improve your recruitment strategy, reduce time-to-hire, and increase the quality of candidates hired.
Key Features of the Recruitment Funnel KPI Dashboard in Excel:
🔎 Sourcing Performance Tracking
Track the number of candidates sourced from different channels such as job boards, referrals, and social media, and measure the quality of these candidates.
🧑🤝🧑 Candidate Screening Efficiency
Monitor the effectiveness of candidate screening by tracking how many candidates pass each stage of the screening process, from resume review to initial interviews.
📅 Interview and Selection Tracking
Track interview progress, including the number of candidates interviewed, shortlisted, and hired, ensuring that each stage of the process is managed efficiently.
⏳ Time-to-Hire Tracking
Measure the average time-to-hire at each stage of the recruitment process to ensure that hiring timelines are being met and identify areas where delays occur.
📈 Offer Acceptance Rate
Track the percentage of candidates who accept offers compared to those who decline, helping to evaluate the competitiveness of your offers and the effectiveness of your negotiation process.
🚀 Why You’ll Love the Recruitment Funnel KPI Dashboard in Excel:

✅ Optimize Recruitment Efforts – Track sourcing, screening, interviewing, and hiring performance to identify areas for improvement in your recruitment strategy.
✅ Improve Time-to-Hire – Monitor time-to-hire and ensure that hiring deadlines are met, reducing the time it takes to fill open positions.
✅ Measure Candidate Quality – Track the quality of candidates at each stage to ensure you’re attracting and hiring the best talent.
✅ Increase Offer Acceptance – Analyze offer acceptance rates and make data-driven adjustments to improve your offer acceptance ratio.
✅ Customizable and Interactive – This Excel dashboard is highly customizable, allowing you to tailor it to your recruitment process and KPIs.
✅ Data-Driven Decision Making – Use real-time data to make informed decisions about your recruitment strategy, from sourcing to hiring.
What’s Inside the Recruitment Funnel KPI Dashboard in Excel:
-
Sourcing Performance: Track the number of candidates sourced through different channels and assess their quality at each stage of the recruitment process.
-
Screening Efficiency: Monitor how candidates are moving through the screening process, including resume reviews and initial interviews.
-
Interview Tracking: Track how many candidates progress to interviews, how many are shortlisted, and how many are offered positions.
-
Time-to-Hire Analysis: Measure the time taken at each stage of the recruitment process to identify delays and streamline the process.
-
Offer Acceptance Rate: Monitor the percentage of candidates who accept job offers to evaluate your recruitment process and offer competitiveness.
-
Custom Reports: Generate detailed reports to analyze KPIs, trends, and recruitment performance for management and stakeholders.
How to Use the Recruitment Funnel KPI Dashboard in Excel:
1️⃣ Download the Template – Instantly access your Excel file upon purchase.
2️⃣ Input Recruitment Data – Enter data for candidates sourced, screened, interviewed, and hired, including timelines for each stage.
3️⃣ Monitor Recruitment Funnel – Use the dashboard to track recruitment performance at each stage of the process, from sourcing to offer acceptance.
4️⃣ Analyze Time-to-Hire – Track the time taken at each stage and identify bottlenecks to improve recruitment efficiency.
5️⃣ Generate Custom Reports – Create detailed reports that summarize recruitment funnel performance for management review.
Who Can Benefit from the Recruitment Funnel KPI Dashboard in Excel:
-
HR Managers
-
Recruiting Teams
-
Talent Acquisition Specialists
-
Hiring Managers
-
Recruitment Agencies
-
Small and Medium Businesses (SMBs)
-
Large Enterprises with Structured Recruitment Processes
The Recruitment Funnel KPI Dashboard in Excel is an essential tool for HR and recruitment teams looking to streamline and optimize their recruitment process. By tracking key metrics at each stage of the funnel, this dashboard helps improve recruitment efficiency, reduce time-to-hire, and enhance the quality of hires.
Click here to read the Detailed blog post
https://www.pk-anexcelexpert.com/recruitment-funnel-kpi-dashboard-in-excel/
Visit our YouTube channel to learn step-by-step video tutorials
Youtube.com/@PKAnExcelExpert


Reviews
There are no reviews yet.