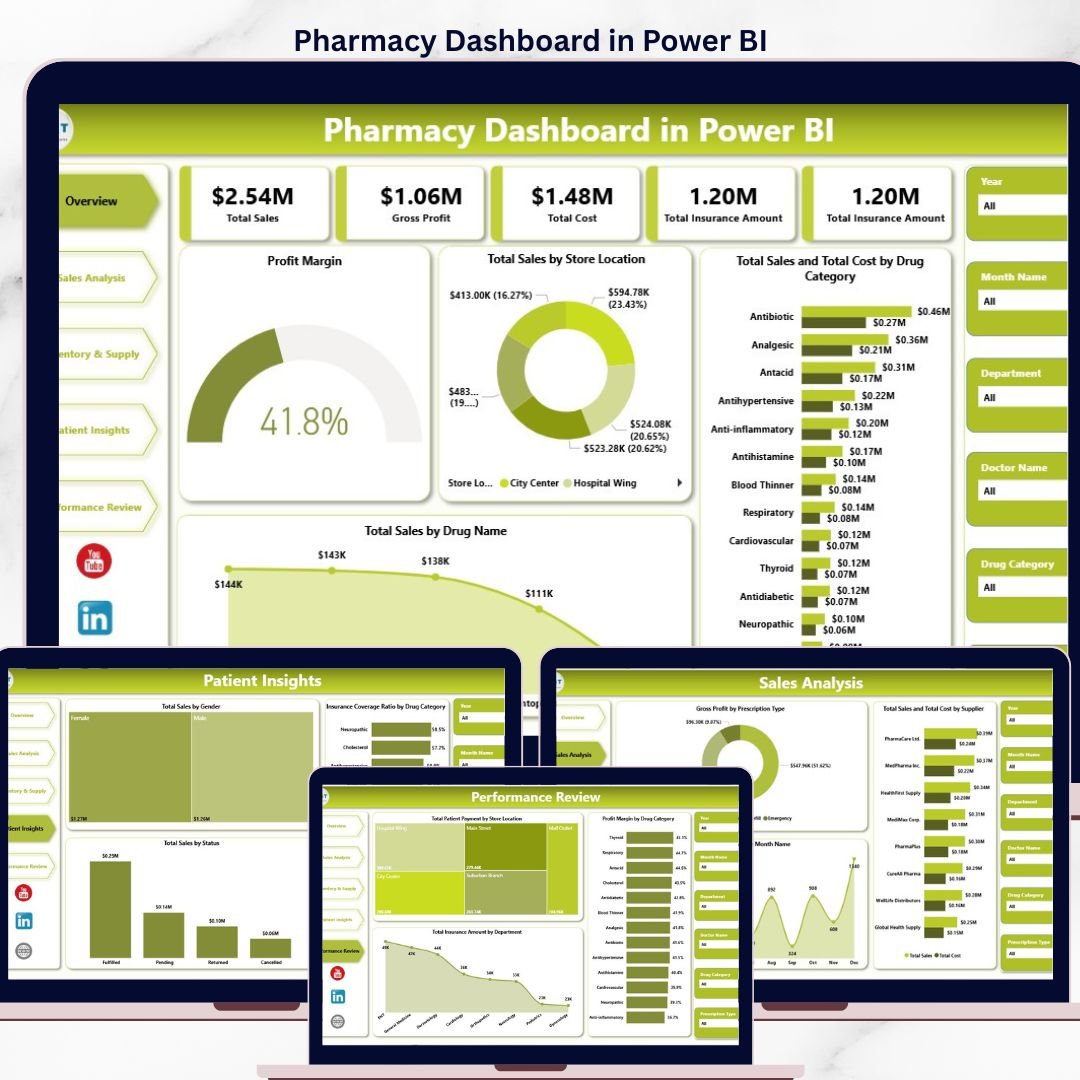
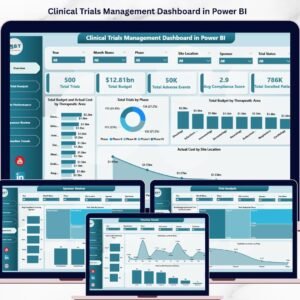
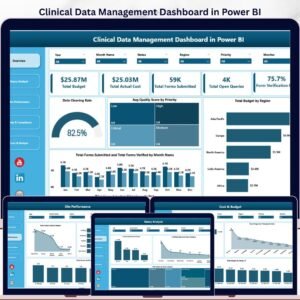
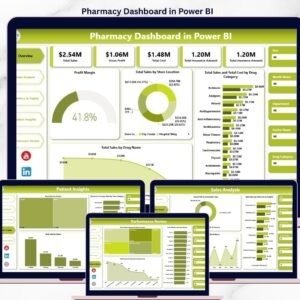
The Pharmacy Dashboard in Power BI tracks 4 high-level financial KPIs and 14+ pre-built visuals across 5 interactive pages — covering sales, gross profit, insurance, inventory expiry risk, patient demographics, and store-level performance. Setup takes under 10 minutes — open the .pbix file in Power BI Desktop, point it at your pharmacy data, and every chart refreshes automatically.
🌍 Join 8,400+ teams in 40+ countries using NextGenTemplates to replace paid SaaS pharmacy BI tools with one-time-purchase Excel, Google Sheets, Power BI, and HTML templates.
✅ Instant download · One-time payment · No subscription · No per-user fees · Lifetime access
Pharmacy Dashboard in Power BI
🔑 Key Features of the Pharmacy Dashboard in Power BI
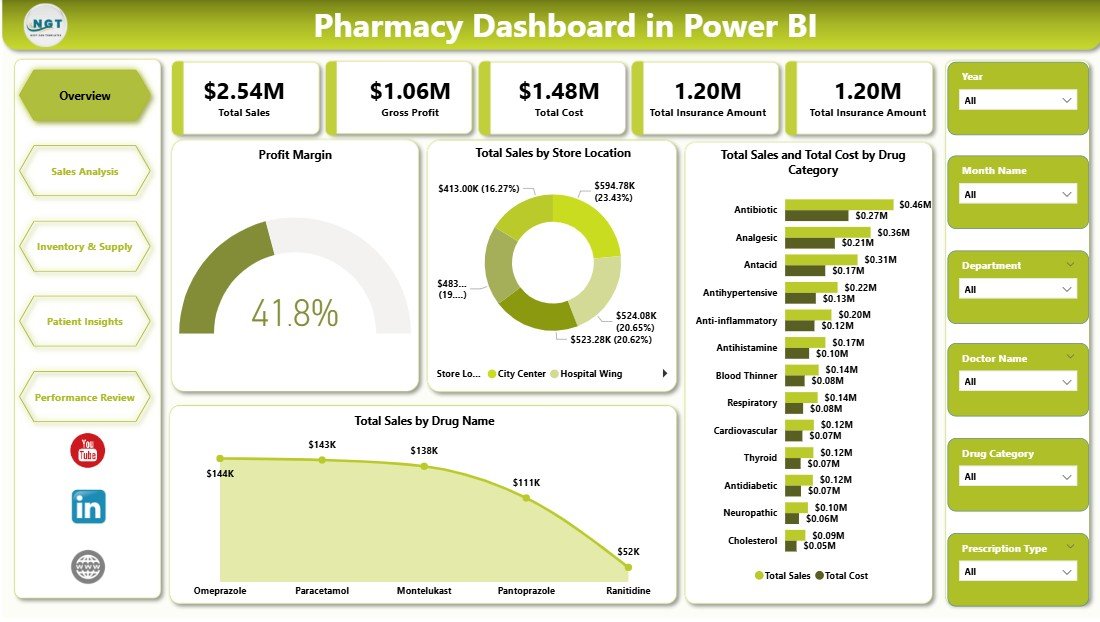
📊 4 financial KPI cards – Total Sales, Gross Profit, Total Cost, and Total Insurance Amount displayed at the top of the Overview page, letting pharmacy owners and regional managers read the state of the business in under 5 seconds.
📈 14+ pre-built charts across 5 pages – covering profit margin, store location sales, drug category profitability, supplier cost, expiry risk, patient gender and status mix, and insurance coverage ratio by drug category.
🔎 Multi-level slicers on every page – filter by store location, drug category, prescription type, department, supplier, gender, and status to drill into any segment without writing a single DAX measure yourself.
🎨 Modern Power BI design – consistent color palette, rounded cards, and a left-side navigation bar that mirrors best practices used by paid pharmacy BI vendors like IQVIA and PharmaGuide — without the 5-figure annual fee.
💾 Works with any data source – CSV exports from your POS, SQL Server, Excel files, or direct query from Azure SQL. Replace the sample data model and every visual updates automatically.
🆓 Runs on free Power BI Desktop – no Pro license required to open, edit, and customize. Only needed when you want to publish and share online via Power BI Service.
📦 What’s Inside the Pharmacy Dashboard in Power BI
The template ships as a single .pbix file containing 5 interactive report pages, a sample pharmacy dataset, and all relationships and DAX measures pre-configured.
Page 1 — Overview: KPI cards for Total Sales, Gross Profit, Total Cost, Total Insurance Amount. Visuals: Profit Margin card, Total Sales by Store Location, Total Sales and Total Cost by Drug Category (combined view), Total Sales by Drug Name. Page-level slicers apply filters across every other page when cross-filter is enabled.
Sales Analysis
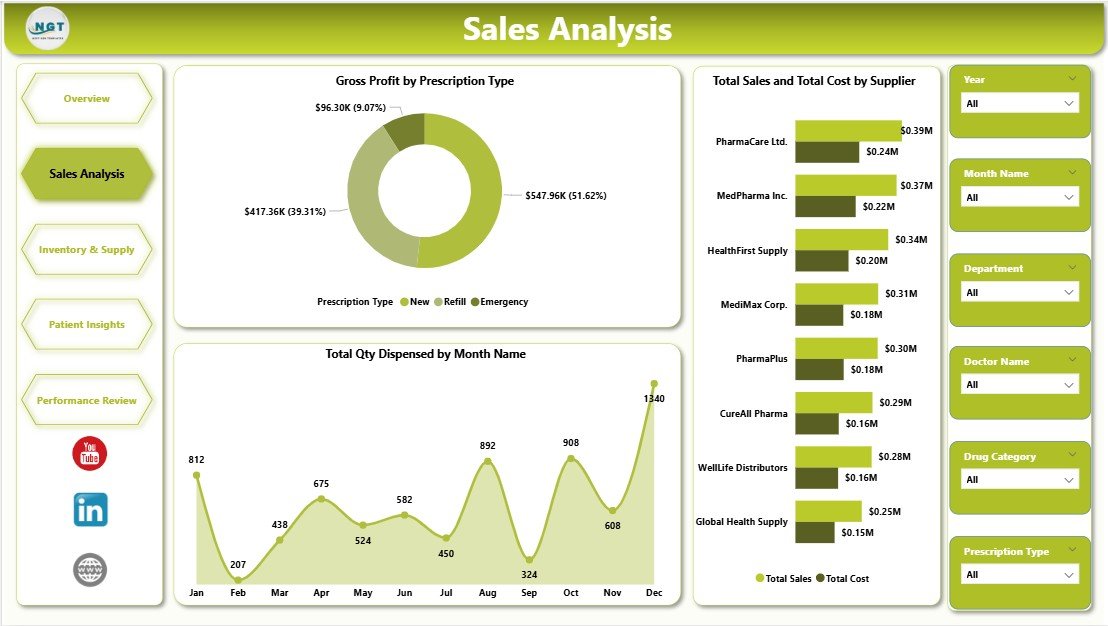
Page 2 — Sales Analysis: Gross Profit by Prescription Type reveals which script categories (OTC, Prescription, Compounded) carry the highest margin. Total Sales and Total Cost by Supplier benchmarks vendor performance side-by-side. Total Qty Dispensed by Month Name exposes seasonality — useful for stock planning and staff scheduling.
Inventory & Supply
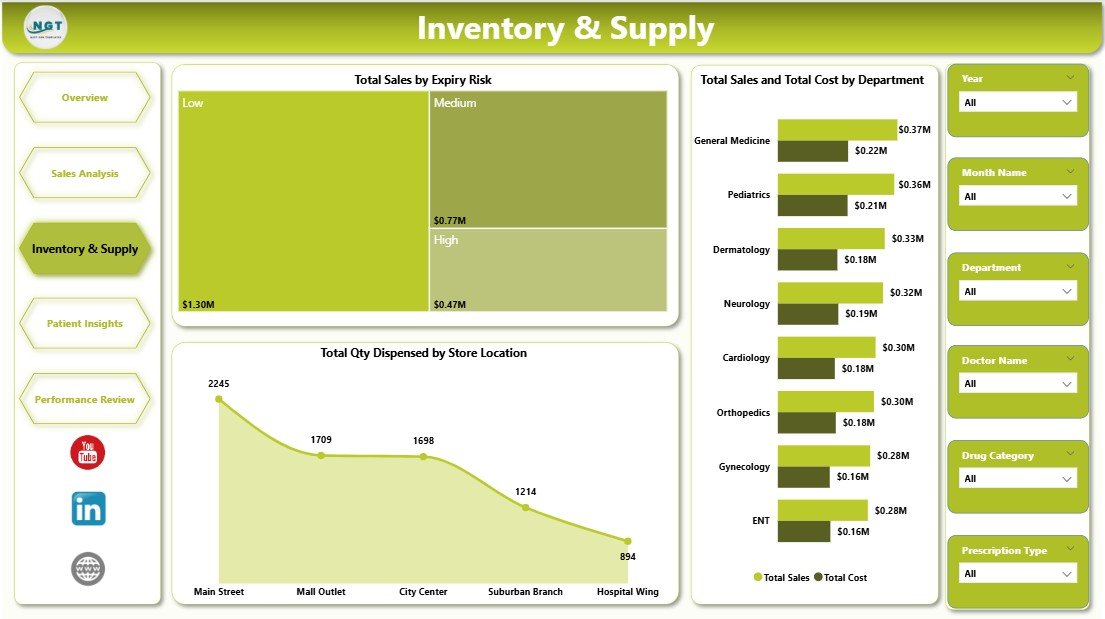
Page 3 — Inventory & Supply: Total Sales by Expiry Risk flags revenue tied up in near-expiry stock — the single biggest source of pharmacy shrinkage. Total Sales and Total Cost by Department shows which lines (Rx, OTC, Wellness, Medical Devices) drive the most volume. Total Qty Dispensed by Store Location benchmarks outlets against each other.
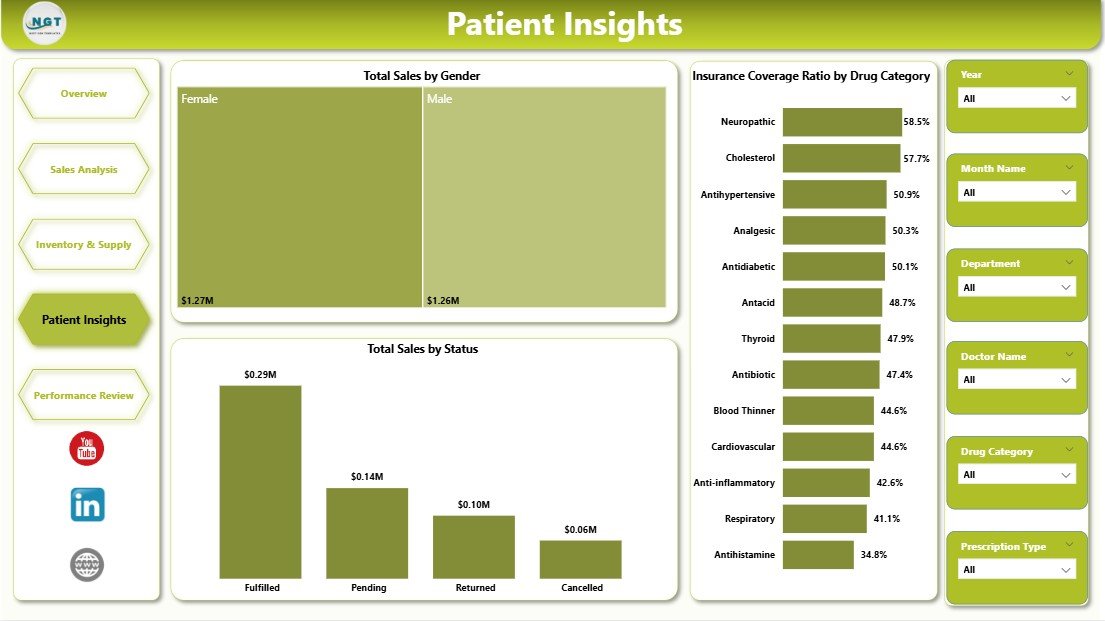
Patient Insights
Page 4 — Patient Insights: Total Sales by Gender and Total Sales by Status (new, returning, loyalty) reveal the customer mix driving revenue. Insurance Coverage Ratio by Drug Category shows which therapeutic areas are most subsidized — critical for forecasting co-pay collections and negotiating PBM contracts.
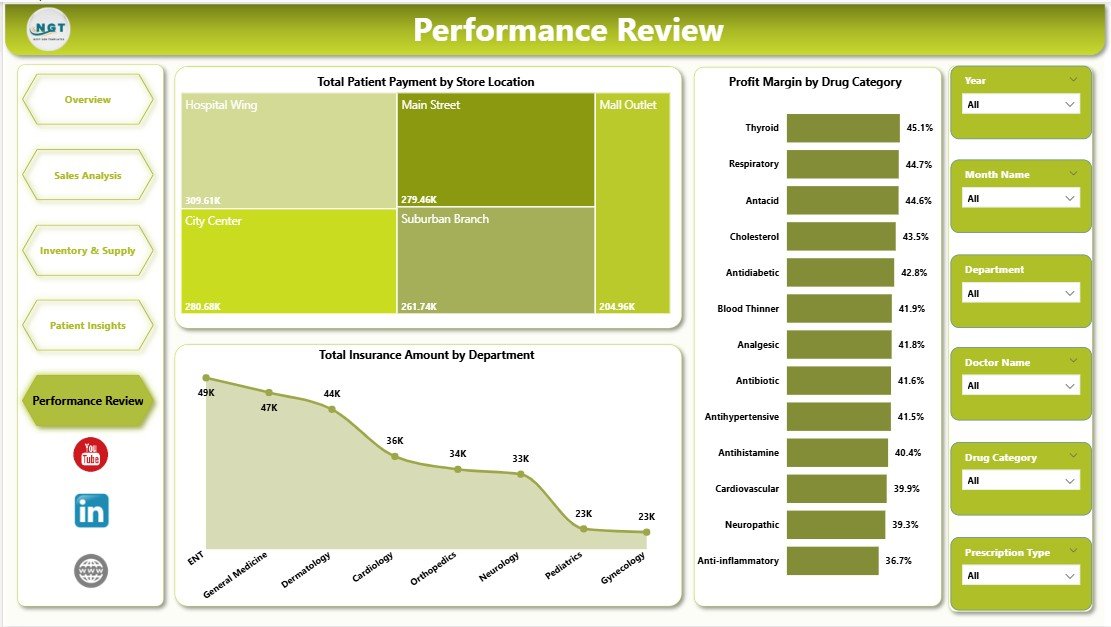
Performance Review
Page 5 — Performance Review: Total Patient Payment by Store Location isolates out-of-pocket revenue by outlet. Profit Margin by Drug Category highlights your most profitable therapeutic lines. Total Insurance Amount by Department aids reconciliation with PBMs and insurers at month-end close.
📊 Pharmacy Dashboard in Power BI vs. Tableau Pharmacy Dashboard vs. IQVIA / PharmaGuide — Where This Fits
| Feature | Pharmacy Dashboard in Power BI | Tableau Pharmacy Template | IQVIA / PharmaGuide |
|---|---|---|---|
| Cost | $17.99 one-time | $70+/user/month (Tableau Creator) | $15,000–$60,000 / year |
| Platform | Power BI Desktop (free) | Tableau Desktop | Proprietary cloud SaaS |
| Setup time | Under 10 minutes | 2–4 hours | 4–12 weeks implementation |
| Pre-built KPI cards | ✅ 4 financial KPIs ready | ❌ Build yourself | ✅ 50+ (locked templates) |
| Customizable visuals | ✅ Fully editable | ✅ Fully editable | ⚠️ Limited to vendor layout |
| Share with team | ✅ Email .pbix or publish to Power BI Service | ✅ Tableau Server | ✅ Cloud dashboard |
| Insurance & co-pay analytics | ✅ Built-in | ❌ Not included | ✅ Included |
| Year-1 cost at 5 users | $17.99 total | $4,200 | $15,000+ |
For independent pharmacies and 2–50 store chains that want IQVIA-grade visibility without the 5-figure SaaS bill, the Pharmacy Dashboard in Power BI sits in the sweet spot.
👥 Who This Template Is For — and Who It’s Not For
✅ This template is built for:
- Independent pharmacy owners tracking sales, profit, and inventory across 1–20 outlets
- Pharmacy chain regional managers reporting to leadership monthly
- Pharmacy accountants reconciling insurance claims and patient co-pays
- Hospital pharmacy directors analyzing dispensing volume and expiry risk
- Power BI analysts who want a pharmacy-ready data model to extend
❌ This template is NOT for:
- Enterprise pharmacy chains (500+ stores) needing real-time OLAP cubes and SSAS integration
- Clinical pharmacy teams needing DUR (Drug Utilization Review) or MTM workflows
- Regulatory teams needing FDA/DEA audit-trail compliance baked in
- Teams without anyone comfortable installing Power BI Desktop
⚙️ How to Use the Pharmacy Dashboard in Power BI
- Download the file — unzip to get the .pbix file and sample dataset.
- Install Power BI Desktop — free from Microsoft if not already installed.
- Open the .pbix file — the dashboard loads with sample pharmacy data.
- Replace the sample data — use Transform Data > Edit Queries to point source tables to your POS export, Excel file, or SQL database.
- Click Refresh — every KPI, chart, and slicer updates automatically based on your data.
- Customize colors or branding — use the Format pane to match your pharmacy brand.
- Publish (optional) — upload to Power BI Service to share online with your team.
💼 Real-World Use Cases
Priya runs a 6-outlet independent pharmacy group in Mumbai. She uses the Pharmacy Dashboard in Power BI every Monday morning to compare store-level sales, flag outlets with rising expiry risk, and spot which drug categories are growing fastest — without paying ₹18 lakh/year for IQVIA.
Marcus is a financial analyst at a regional hospital system in Ohio. His in-patient pharmacy contributes $12M in annual dispensing revenue, and he uses the Performance Review page to reconcile insurance amounts by department before submitting month-end reports to the CFO.
Aisha is a Power BI consultant. Instead of building a pharmacy dashboard from scratch for her retail-pharmacy client, she buys this template for $17.99, rebrands the color palette, and delivers a working demo the same afternoon — billing 6 saved hours to the client.
❓ Frequently Asked Questions
What KPIs does the Pharmacy Dashboard in Power BI track?
The Pharmacy Dashboard in Power BI tracks 4 headline financial KPIs — Total Sales, Gross Profit, Total Cost, and Total Insurance Amount — plus 14+ operational visuals across Sales Analysis, Inventory & Supply, Patient Insights, and Performance Review pages. Every metric updates automatically when you replace the sample data.
How long does setup take?
Setup takes under 10 minutes. Open the .pbix file in Power BI Desktop, go to Transform Data, point the source queries to your pharmacy data (CSV, Excel, SQL, or API), and click Refresh. All 14+ visuals repopulate instantly without any additional DAX work.
Do I need a Power BI Pro license?
No. The Pharmacy Dashboard in Power BI opens and runs in free Power BI Desktop. A Pro license ($10/user/month) is only required if you want to publish to Power BI Service and share interactive online dashboards with your team.
How does this compare to IQVIA or PharmaGuide?
IQVIA and PharmaGuide cost $15,000–$60,000 per year with 4–12 week implementations. The Pharmacy Dashboard in Power BI is a one-time $17.99 purchase, sets up in 10 minutes, and covers the core 90% — sales, profit, expiry risk, insurance ratio, store and supplier benchmarking. Best for independent and small-chain pharmacies.
Can I customize the charts and colors?
Yes. Every visual in the Pharmacy Dashboard in Power BI is fully editable. Change colors, swap visual types, add new measures, or rearrange the layout using the standard Power BI Format pane. The data model and DAX measures are open — no locked content.
Will this work with my existing pharmacy POS data?
Yes, as long as your POS can export to CSV, Excel, SQL, or a supported Power BI data connector (100+ connectors built-in). Map your source columns to the template’s fact tables once, and the Pharmacy Dashboard in Power BI handles the rest.
👤 About the Author
Built by PK — Microsoft Certified Professional with 15+ years of Excel, Google Sheets, and Power BI experience. Founder of NextGenTemplates, reaching 300K+ subscribers across YouTube channels (@PK-AnExcelExpert, @NextGenTemplates, @NeoTechNavigators). Every template is hand-built and tested before release.
🔗 Explore Related Templates
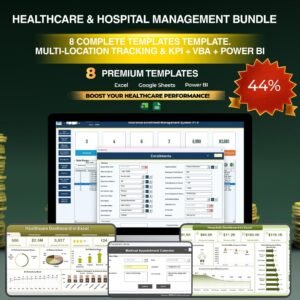
💎 Save 38% — get the Healthcare & Hospital Management Bundle (8 templates for $79.99) →
Also available as: Pharmacy Dashboard in Excel · Pharmacy KPI Dashboard in Google Sheets.
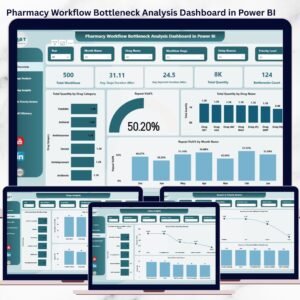
Related: Medical Practice Dashboard in Power BI · Pharmacy Workflow Bottleneck Analysis Dashboard in Power BI · browse all Power BI Dashboards.
📖 Click here to read the Detailed Blog Post about Pharmacy Dashboard in Power BI
🎥 Visit our YouTube channel for step-by-step video tutorials
👉 YouTube.com/@NextGenTemplates
📅 Last updated: April 2026


Reviews
There are no reviews yet.