

Running a successful online business across multiple platforms is becoming more challenging every year. Sellers must track orders, returns, sales trends, profit margins, customer ratings, fulfilment types, and regional performance across platforms like Amazon, Walmart, eBay, Flipkart, Etsy, Shopify, and more. When this information lives in different spreadsheets or portals, managing it becomes slow, confusing, and error-prone.
The Online Marketplaces Dashboard in Excel solves this problem instantly.
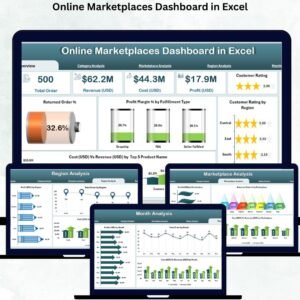
This ready-to-use dashboard brings all marketplace KPIs into one interactive Excel file. You see category insights, marketplace performance, return trends, costs vs revenue, profit margins, and monthly sales movement—all in a single visual dashboard.
The dashboard transforms raw order data into clean insights that help online sellers make faster, smarter, and more profitable decisions.
⭐ What Is an Online Marketplaces Dashboard in Excel?
An Online Marketplaces Dashboard in Excel is a visual reporting system designed for multi-marketplace sellers. It converts your raw data into meaningful charts and KPIs so that you can:
Track orders across all platforms
Monitor revenue and cost patterns
Compare marketplace performance
Analyze category profitability
Review customer satisfaction
Reduce return and replacement issues
Understand geographic trends
Study seasonality and growth
Because the dashboard is built in Excel, you do not need additional tools. Just paste your raw order data into the Data Sheet and refresh—your entire dashboard updates instantly.
⭐ Why Do You Need This Dashboard?
Modern online selling means dealing with:
Multiple product categories
Many marketplaces
Several fulfilment methods
Rising customer expectations
Increasing return rates
Seasonal sales fluctuations
Manually managing all this data is inefficient and risky.
This dashboard becomes your single source of truth, helping you:
Improve forecasting
Optimize sourcing and pricing
Control return %
Track category-wise performance
Compare marketplaces with one click
Increase profitability with data-driven insights
⭐ Key Features of the Online Marketplaces Dashboard in Excel
This dashboard includes five powerful analytical pages, each packed with slicers, charts, KPI cards, and insights.
1️⃣ Overview Page — The Heart of the Dashboard
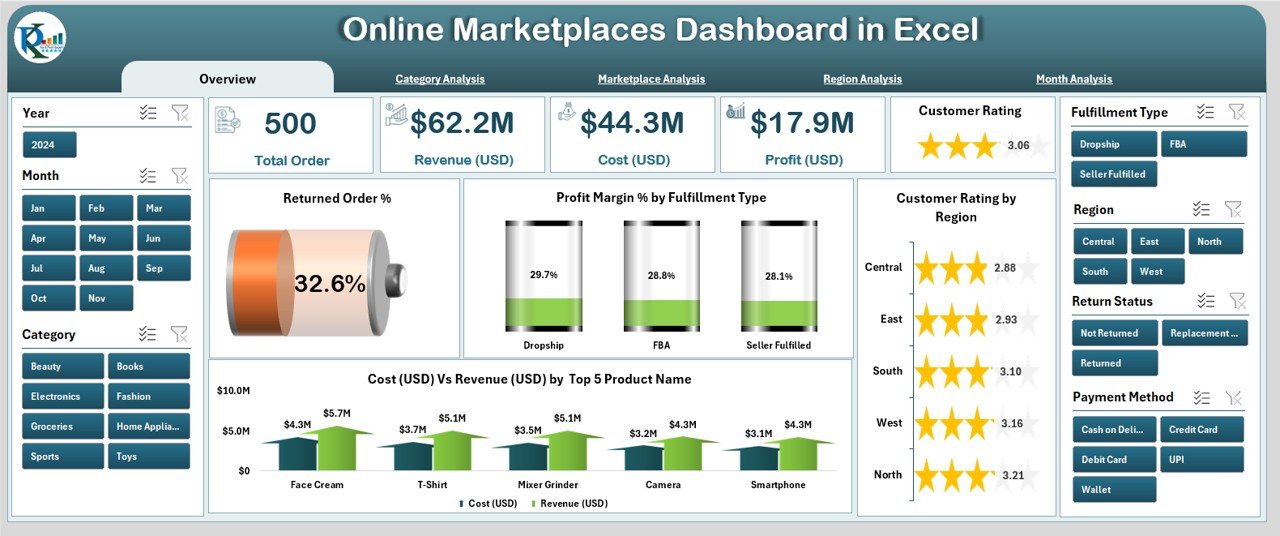
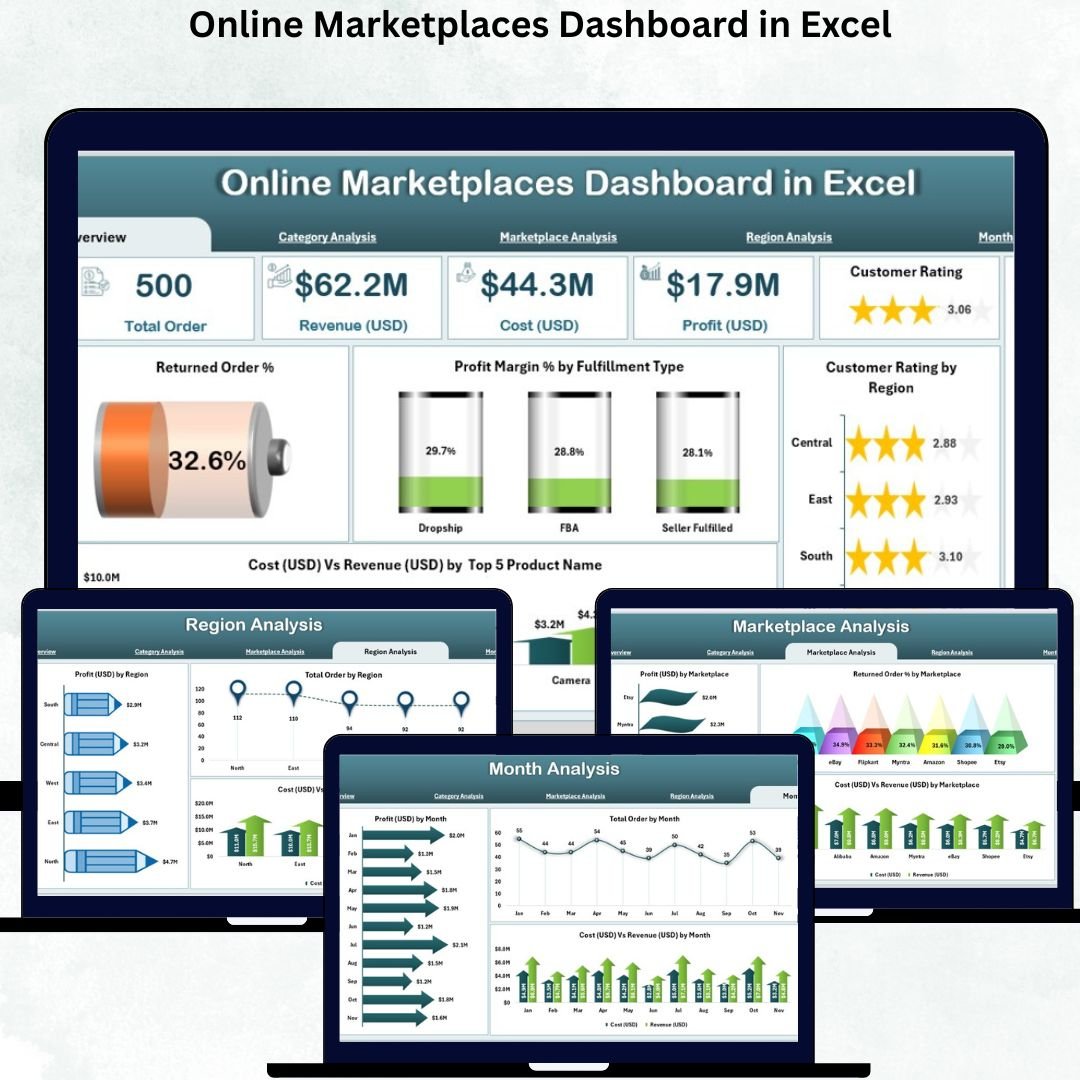
The Overview Page gives a complete snapshot of your online selling performance.
Using the slicer on the right, you can filter by category, marketplace, region, or month.
KPI Cards (5 Total)
You see instant numbers for:
Total Orders
Total Revenue
Total Cost
Total Profit
Profit Margin %
Charts Included
✔ Returned Order %
✔ Profit Margin % by Fulfilment Type
✔ Customer Rating by Region
✔ Cost vs Revenue by Top Product Names
This page helps you identify major opportunities and problem areas immediately.
2️⃣ Category Analysis — Understand What Drives Profit
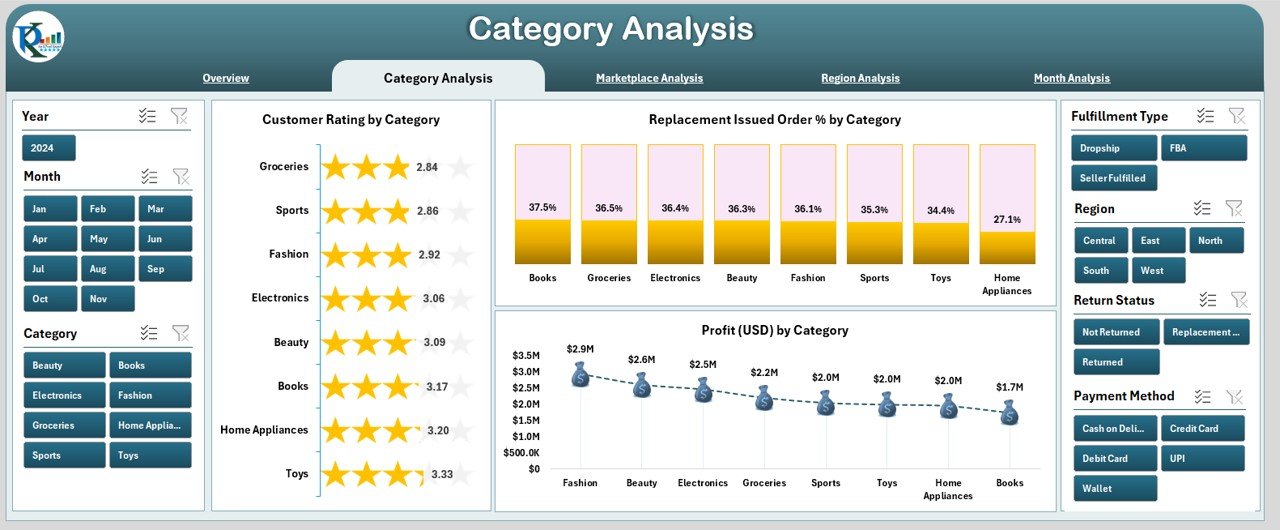
This page focuses entirely on product category behavior.
Charts Included
✔ Customer Rating by Category
✔ Replacement Issued Order % by Category
✔ Profit (USD) by Category
This helps you:
Improve categories with low ratings
Fix categories with high return or replacement %
Identify high-margin and low-margin categories
3️⃣ Marketplace Analysis — Compare All Platforms
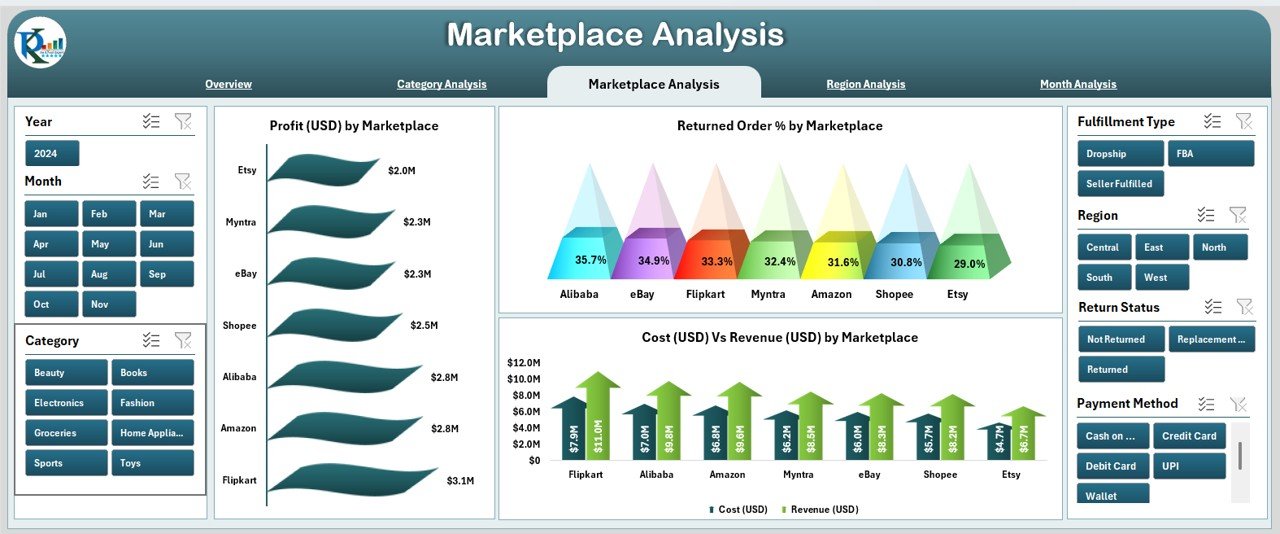
If you sell on multiple marketplaces, this page is essential.
Charts Included
✔ Profit (USD) by Marketplace
✔ Returned Order % by Marketplace
✔ Cost vs Revenue by Marketplace
This page reveals:
Your best-performing marketplace
Platforms with high return rates
Marketplace-wise profitability and growth trends
4️⃣ Region Analysis — Track Territory-Wise Success
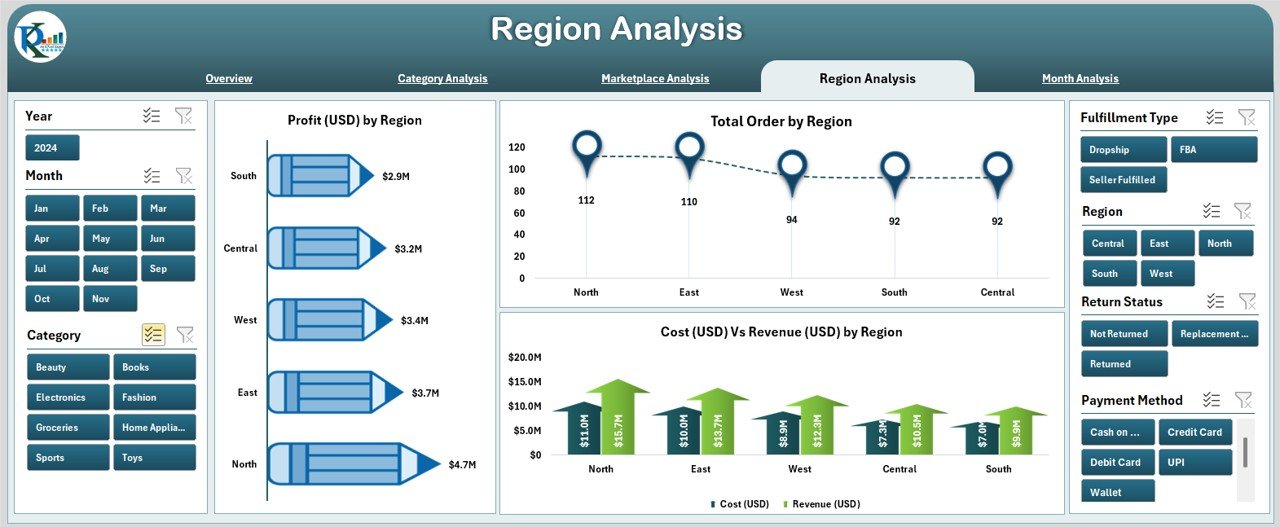
Not all regions behave the same. This page helps you analyze location-based performance.
Charts Included
✔ Profit (USD) by Region
✔ Total Orders by Region
✔ Cost vs Revenue by Region
If a region shows low ratings or high return %, you can fix issues faster.
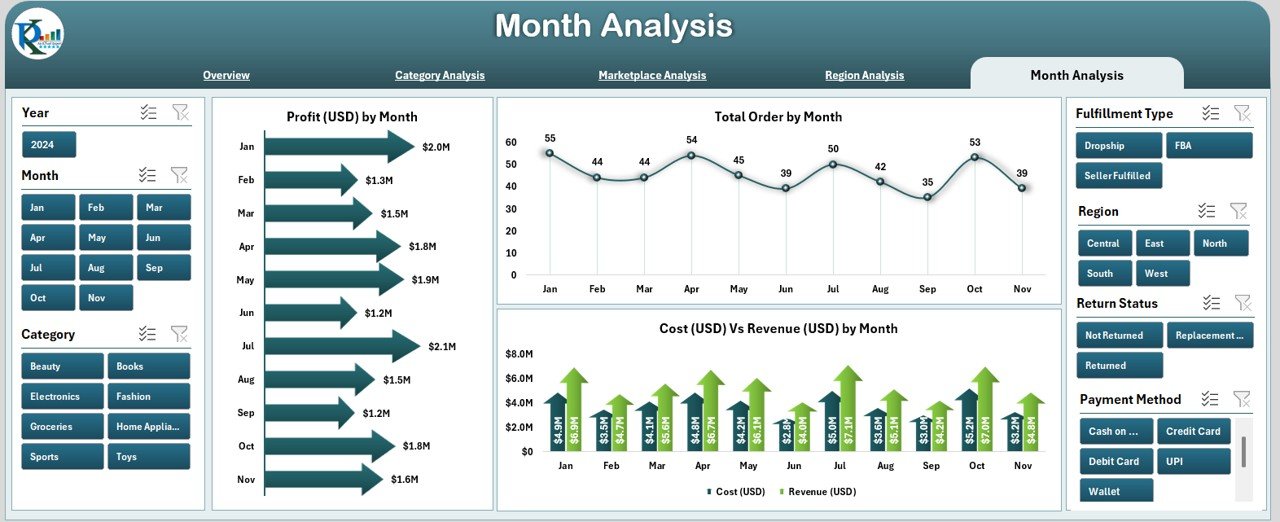
5️⃣ Month Analysis — Study Growth Patterns Over Time
The Month Analysis page reveals your long-term performance.
Charts Included
✔ Profit (USD) by Month
✔ Total Orders by Month
✔ Cost vs Revenue by Month
These trends help you plan stock, marketing, and seasonal promotions.
⭐ Support Sheet & Data Sheet
✔ Support Sheet
Contains color codes, drop-down lists, backend mappings, and theme settings.
✔ Data Sheet
This is where you paste your raw order data:
Product
Category
Marketplace
Region
Revenue
Cost
Rating
Return/Replacement
Month
Fulfilment type
Refresh → Dashboard updates instantly.
⭐ How This Dashboard Helps Your Team
With this dashboard, your team can:
Reduce manual reporting time
Improve accuracy and transparency
Track trends early and act faster
Improve customer experience
Reduce return costs
Increase profit margins
Optimize sales across multiple marketplaces
Everyone sees the same data—so teamwork becomes aligned and efficient.
⭐ Advantages of the Online Marketplaces Dashboard in Excel
Full multi-marketplace visibility
Control over returns and replacements
Clear profit margin insights
Faster decision-making
Easy forecasting and planning
Simple for any team member to use
Completely customizable
Supports unlimited marketplaces, products & regions
⭐ Best Practices for Using This Dashboard
✔ Keep the Data Sheet clean
✔ Refresh daily or weekly
✔ Use slicers to drill down
✔ Review monthly trend charts
✔ Track low-rating products early
✔ Study return % frequently
✔ Maintain a data backup
✔ Optimize pricing using cost vs revenue charts
⭐ Conclusion
The Online Marketplaces Dashboard in Excel gives online sellers complete control over their performance. You can track category-wise results, compare marketplace performance, analyze returns, monitor ratings, and understand growth trends—all in one place.
Since the dashboard runs 100% in Excel, you get full flexibility, zero extra software cost, and unlimited customization. With this dashboard, you operate with more clarity, more accuracy, and more confidence.
⭐ FAQs
1. Can this dashboard track multiple marketplaces like Amazon, Etsy, Walmart, Flipkart, etc.?
Yes, it supports unlimited marketplaces.
2. Do I need advanced Excel skills?
No. Just paste your raw data into the Data Sheet.
3. Can charts be customized?
Yes. You can modify colors, add new charts, or extend pages easily.
4. Does it help reduce returns?
Yes. You can track return % by category, region, and marketplace.
5. Can I use it for forecasting?
Yes. The Month Analysis page reveals seasonal behavior.
🔗 Click here to read the Detailed blog post
Visit our YouTube channel to learn step-by-step video tutorials












Reviews
There are no reviews yet.