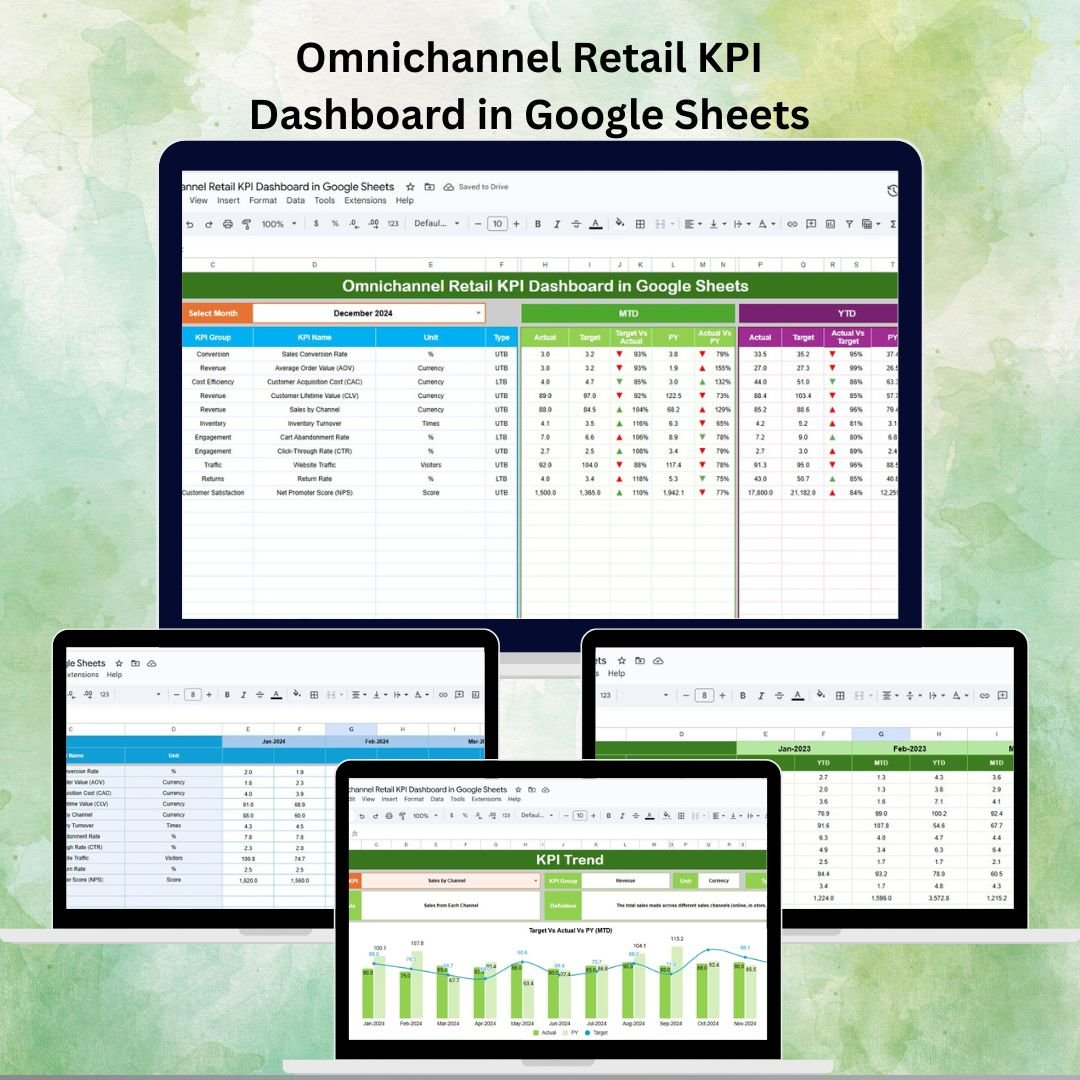
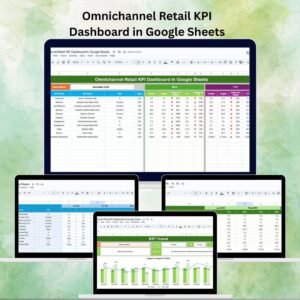
In today’s fast-paced retail landscape, businesses no longer operate in silos. Customers interact with brands through multiple touchpoints—online stores, physical outlets, marketplaces, and even social media commerce. Tracking performance across these diverse channels can be challenging without the right tools. That’s where our Omnichannel Retail KPI Dashboard in Google Sheets comes in—a ready-to-use, cloud-based solution designed to simplify monitoring and decision-making for retailers, managers, and analysts.
This dashboard consolidates sales, inventory, and customer engagement data into one central platform, giving you instant access to Month-to-Date (MTD), Year-to-Date (YTD), target comparisons, and historical performance. Whether you’re running a small retail chain or a large enterprise, this template empowers you to make data-driven decisions that boost efficiency, customer satisfaction, and profitability.
🔑 Key Features of the Omnichannel Retail KPI Dashboard
1️⃣ Dashboard Sheet Tab
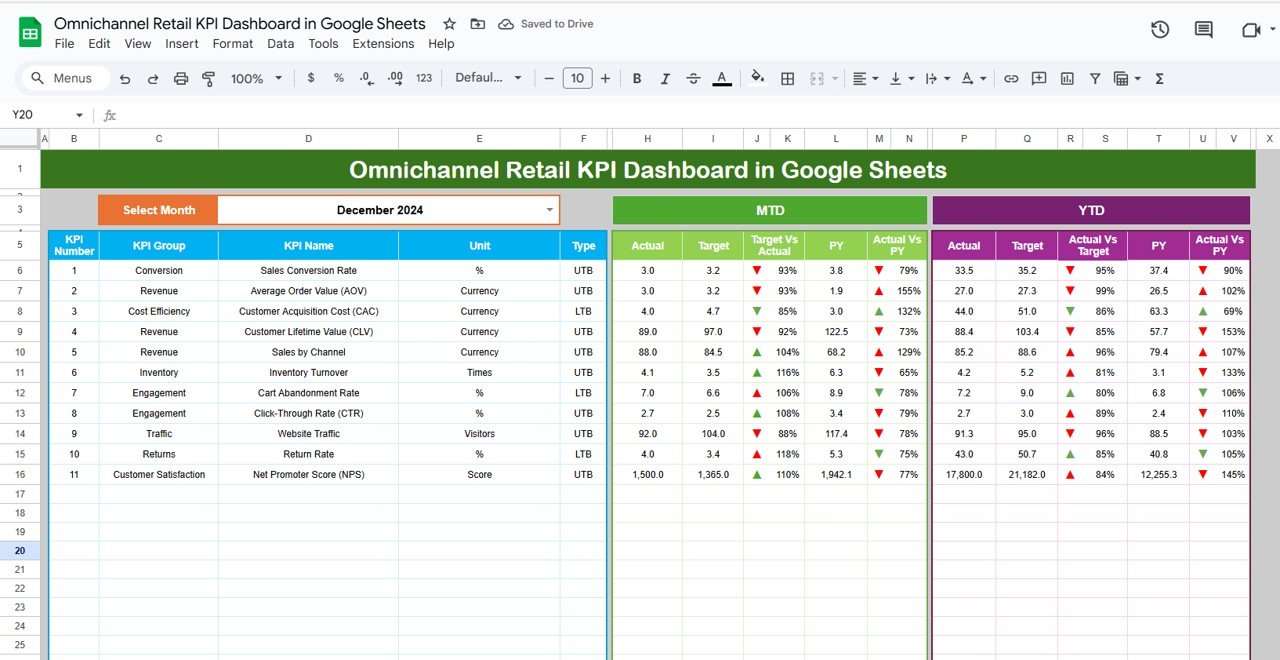
The main control center of the dashboard, providing a real-time snapshot of performance:
-
Month Selector: Choose any month from the dropdown (D3) and watch the data update instantly.
-
MTD & YTD Metrics: Compare Actual vs Target and Actual vs Previous Year with conditional formatting arrows.
-
KPIs Covered: Sales revenue, online vs offline split, Average Order Value (AOV), retention rate, conversion rate, inventory turnover, and store footfall.
-
Visual Indicators: Red/green arrows highlight underperformance or overachievement.
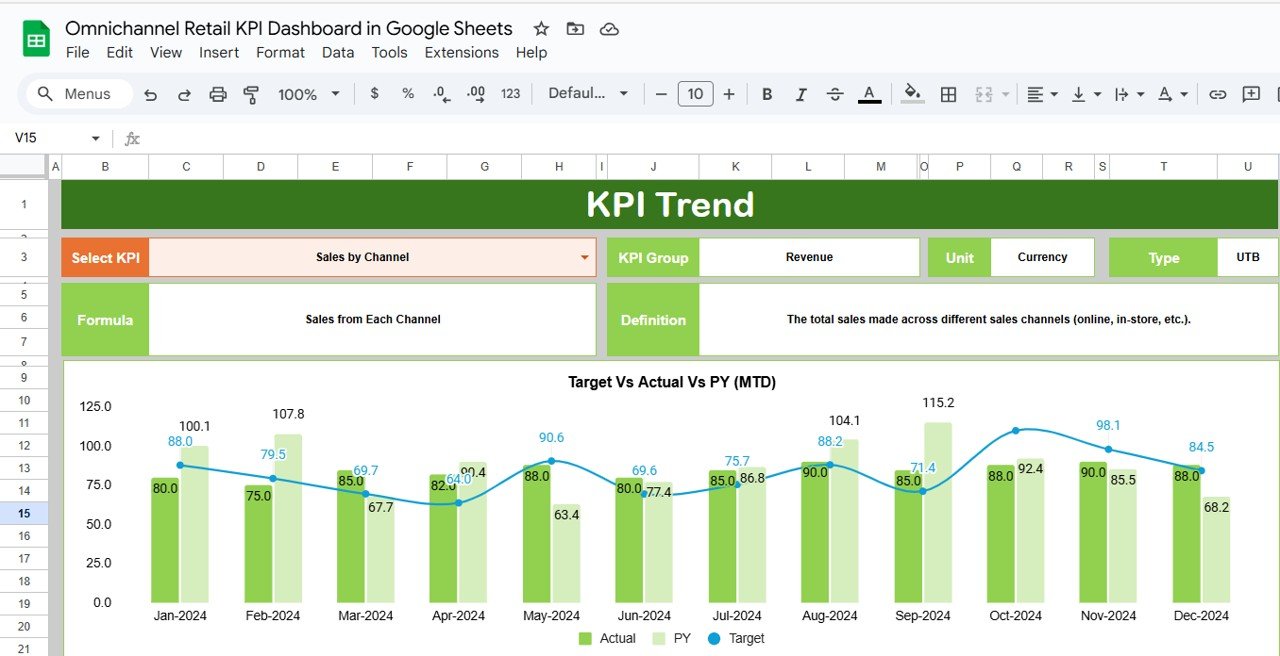
2️⃣ KPI Trend Sheet Tab
Dive deeper into individual KPIs:
-
Select any KPI from the dropdown in C3.
-
View KPI group, unit, formula, definition, and whether it’s “Upper the Better” (UTB) or “Lower the Better” (LTB).
-
Track historical performance to identify patterns.
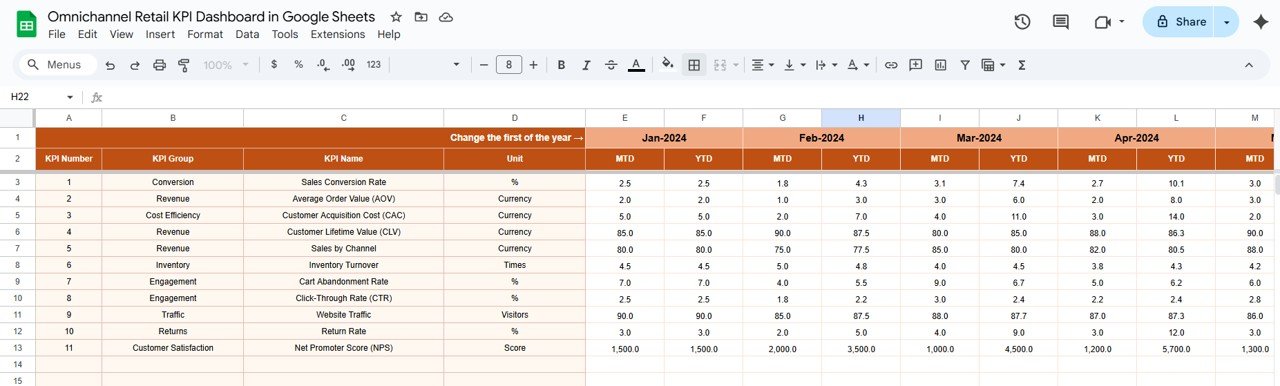
3️⃣ Actual Numbers Sheet Tab
-
Input MTD and YTD actuals.
-
Change the first month of the year in E1 to automatically adjust calculations.
-
Keeps data fresh and accurate.
4️⃣ Target Sheet Tab
-
Enter monthly and yearly KPI targets.
-
Align performance with business goals.
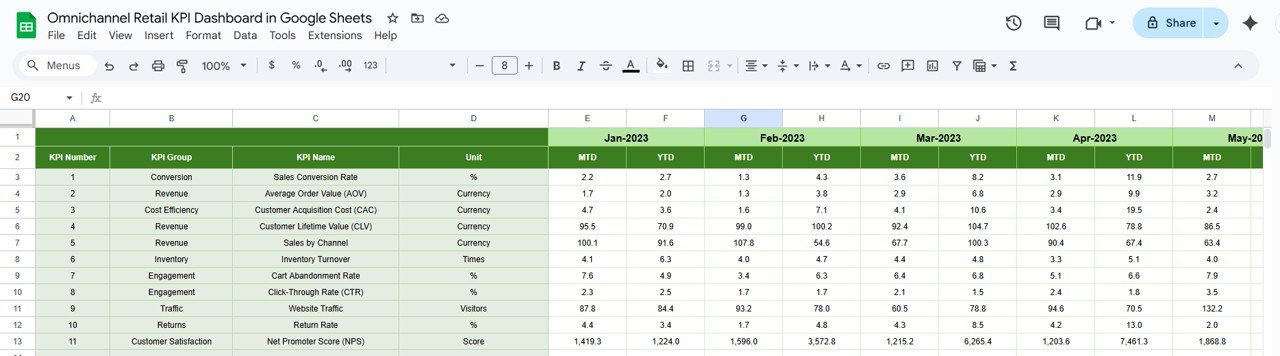
5️⃣ Previous Year Numbers Sheet Tab
-
Input historical data for year-over-year comparison.
-
Spot seasonal patterns and long-term improvements.
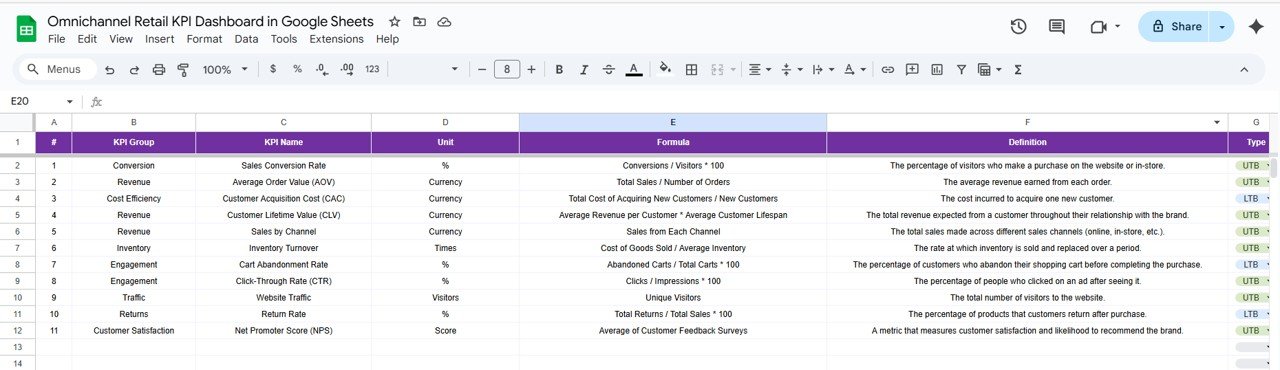
6️⃣ KPI Definition Sheet Tab
-
Maintain clarity with KPI name, group, formula, definition, and UTB/LTB classification.
-
Ensures consistency across the organization.
📦 What’s Inside the Dashboard
✔ Prebuilt KPI dashboard with cards, charts, and dropdown filters
✔ Editable KPI definitions for customization
✔ Data sheets for actual, target, and historical inputs
✔ Conditional formatting for quick insights
✔ Cloud-based collaboration with Google Sheets
🛠️ How to Use the Dashboard
-
Set Up KPIs: Define metrics in the KPI Definition sheet.
-
Input Data: Enter Actual, Target, and Previous Year values.
-
Select Month: Use the dropdown to update dashboard numbers instantly.
-
Analyze Trends: Explore KPI performance using the Trend Sheet.
-
Share Insights: Collaborate with your team by sharing the Google Sheet.
👥 Who Can Benefit from This Dashboard?
-
Retailers: Monitor online and offline performance in one place.
-
Store Managers: Gain insights into footfall, sales, and staff efficiency.
-
Marketing Teams: Track conversion rates and customer retention.
-
Inventory Managers: Manage stock levels and turnover effectively.
-
Executives & Analysts: Make strategic decisions backed by real data.
✅ Advantages of Using This Dashboard
-
Centralized Data Monitoring – Consolidate sales, inventory, and customer KPIs.
-
Cloud-Based Collaboration – Share real-time insights across teams.
-
Data-Driven Decisions – Compare current vs target vs historical performance.
-
Cost-Effective – No need for expensive BI software.
-
Customizable – Add new KPIs, change formulas, and personalize the layout.
📌 Best Practices
-
Update Actuals monthly for accurate results.
-
Set realistic, achievable targets.
-
Use dropdowns to standardize inputs.
-
Review trends regularly to spot opportunities.
-
Share findings with cross-functional teams for alignment.
🎯 Conclusion
The Omnichannel Retail KPI Dashboard in Google Sheets is a must-have for retailers seeking to streamline performance tracking across multiple sales channels. With its intuitive layout, real-time insights, and flexible customization, this dashboard empowers businesses to stay agile, customer-focused, and profitable.


Reviews
There are no reviews yet.