📊 Key Features of Office Workflow Efficiency Dashboard in Power BI
🔍 Real-Time Task Visibility
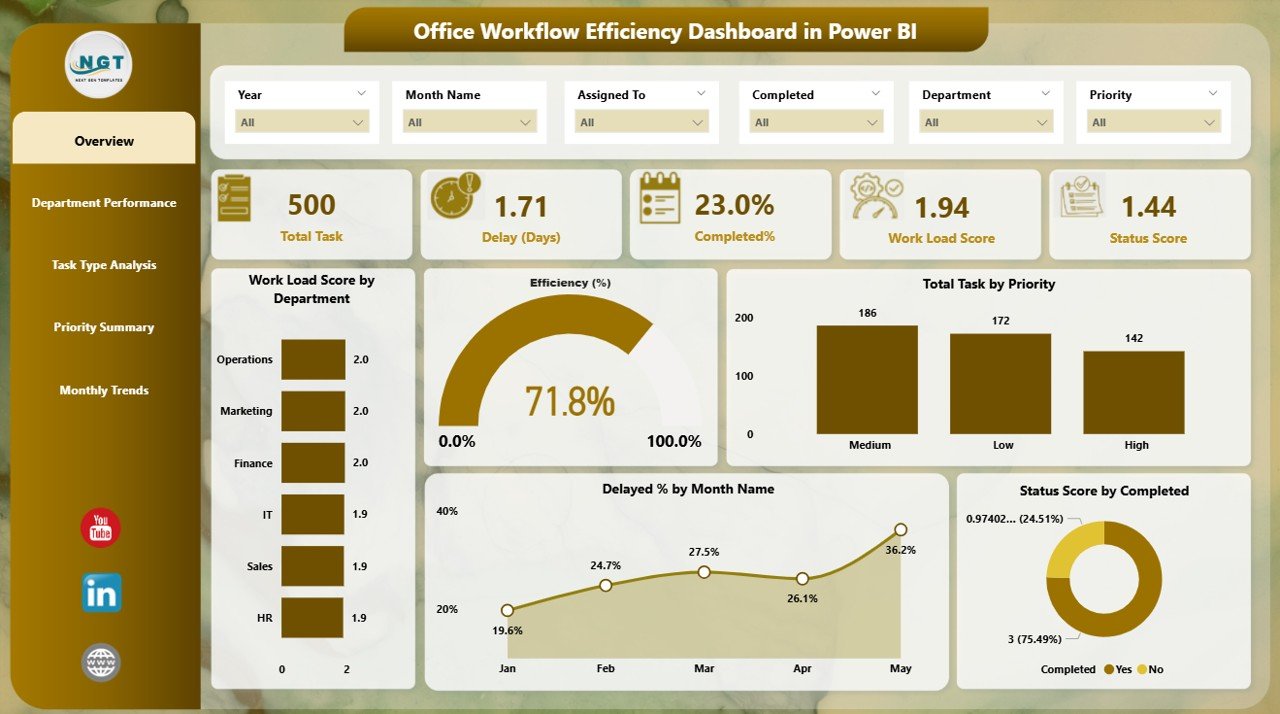
Get instant insights into total tasks, completed ones, delayed assignments, and overall efficiency—all updated in real-time from your Excel data.
📈 Interactive Dashboard with 5 Powerful Pages
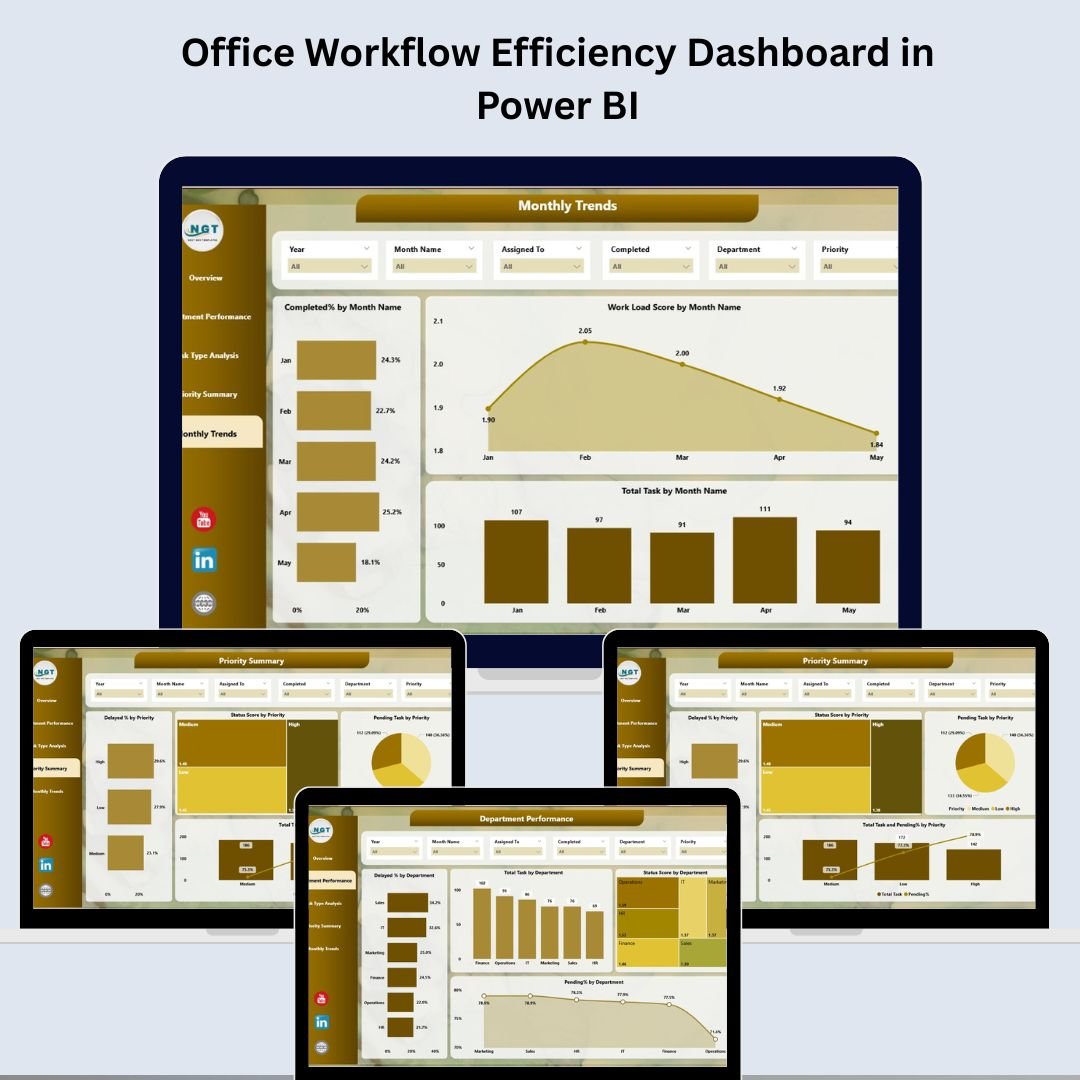
Navigate through five interactive pages including Overview, Department Performance, Task Type Analysis, Priority Summary, and Time Trend Analysis—each equipped with filters and visuals.
📌 Smart Slicers for Deep Filtering
Use slicers like Department, Task Type, Priority, Status, Month, and Year to drill down into task and team performance.
📊 KPI Cards for Quick Snapshot
Visualize key metrics like Workload Score, Efficiency %, Delayed %, Status Score, Pending %, and more through eye-catching KPI cards.
🧩 Customizable for Any Organization
Easily modify visuals, KPIs, and filters to suit your specific office structure or reporting needs.
📥 Excel-Connected Power BI Model
This dashboard connects with Excel files—just update your source sheet and refresh your dashboard with zero hassle.
👥 Department-wise Performance View
Track delays and bottlenecks across departments and act fast before it affects output.
📅 Time-Based Trend Analysis
Analyze performance across months to spot workload peaks, seasonal trends, or repetitive inefficiencies.
📂 What’s Inside the Office Workflow Efficiency Dashboard
✅ Power BI Desktop File (.pbix) – Prebuilt and ready-to-use, compatible with Excel source data.
✅ 5 Insightful Pages –
-
Overview Page
-
Department Performance Page
-
Task Type Analysis Page
-
Priority Summary Page
-
Time Trend Analysis Page
✅ Data Slicers – Six to seven slicers per page to filter by department, priority, task type, etc.
✅ KPI Cards – Including Total Tasks, Delayed %, Completed %, Efficiency %, Status Score.
✅ Charts & Visuals – Dozens of well-structured visuals to track team and task efficiency.
✅ User Guide PDF (included) – With instructions on loading Excel data, customizing visuals, and publishing online.
⚙️ How to Use the Office Workflow Efficiency Dashboard
🧩 Step 1: Plug in Your Excel File
Use your existing Excel data with columns like Task ID, Assigned To, Department, Priority, Start Date, End Date, Status, Delay Days, etc.
📊 Step 2: Refresh Data in Power BI Desktop
Open the .pbix file, refresh your dataset, and watch all KPIs and visuals update instantly.
📌 Step 3: Use Slicers for Smart Analysis
Filter data by department, month, task type, or priority to view efficiency and bottlenecks from every angle.
📈 Step 4: Navigate Easily Across Pages
Jump between pages using the navigation buttons at the bottom to view different types of insights.
🧠 Step 5: Take Action on Insights
Use Delay %, Status Scores, and Workload Scores to reassign tasks, retrain teams, or identify recurring process gaps.
👥 Who Can Benefit from This Office Workflow Efficiency Dashboard
🏢 Office Managers – Visualize delays and remove process bottlenecks in daily workflows.
📋 Operations Teams – Improve resource allocation, meet SLAs, and maintain consistent task tracking.
🧑💼 HR & Admin Professionals – Monitor documentation, compliance tasks, and operational backlog effectively.
📈 Executives & Department Heads – Get a birds-eye view of all departments to make data-backed decisions fast.
👨💻 Analysts & BI Teams – Use this ready-to-use model as a base to build custom workflow KPIs and visuals.

















Reviews
There are no reviews yet.