Energy efficiency is no longer just a cost-saving strategy — it’s a business imperative that supports both financial performance and environmental responsibility. The Office Energy Consumption Dashboard in Google Sheets is a ready-to-use, interactive tool designed to help organizations track, analyze, and optimize energy usage across departments and office locations. 📊⚡
Built in Google Sheets, this dashboard empowers facility managers, sustainability officers, and finance teams to monitor energy consumption, evaluate efficiency, and reduce operational costs — all within a user-friendly, collaborative platform. 🌍💼
🔑 Key Features of the Office Energy Consumption Dashboard
📊 Dashboard Sheet Tab
-
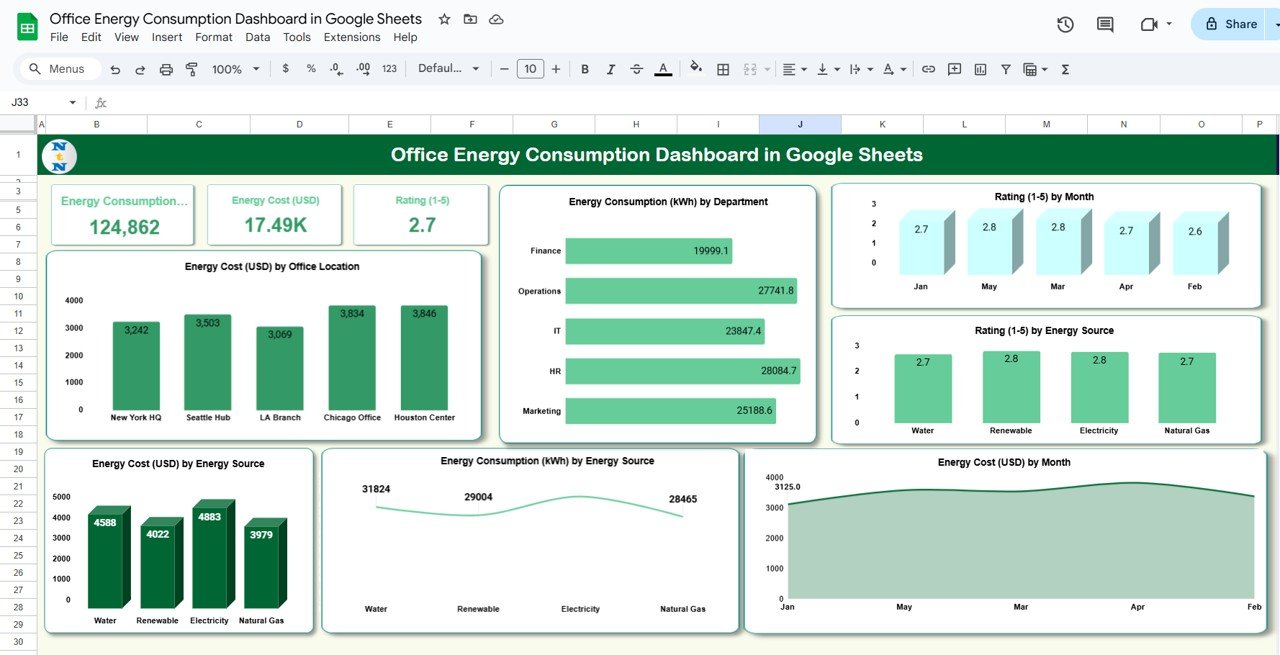
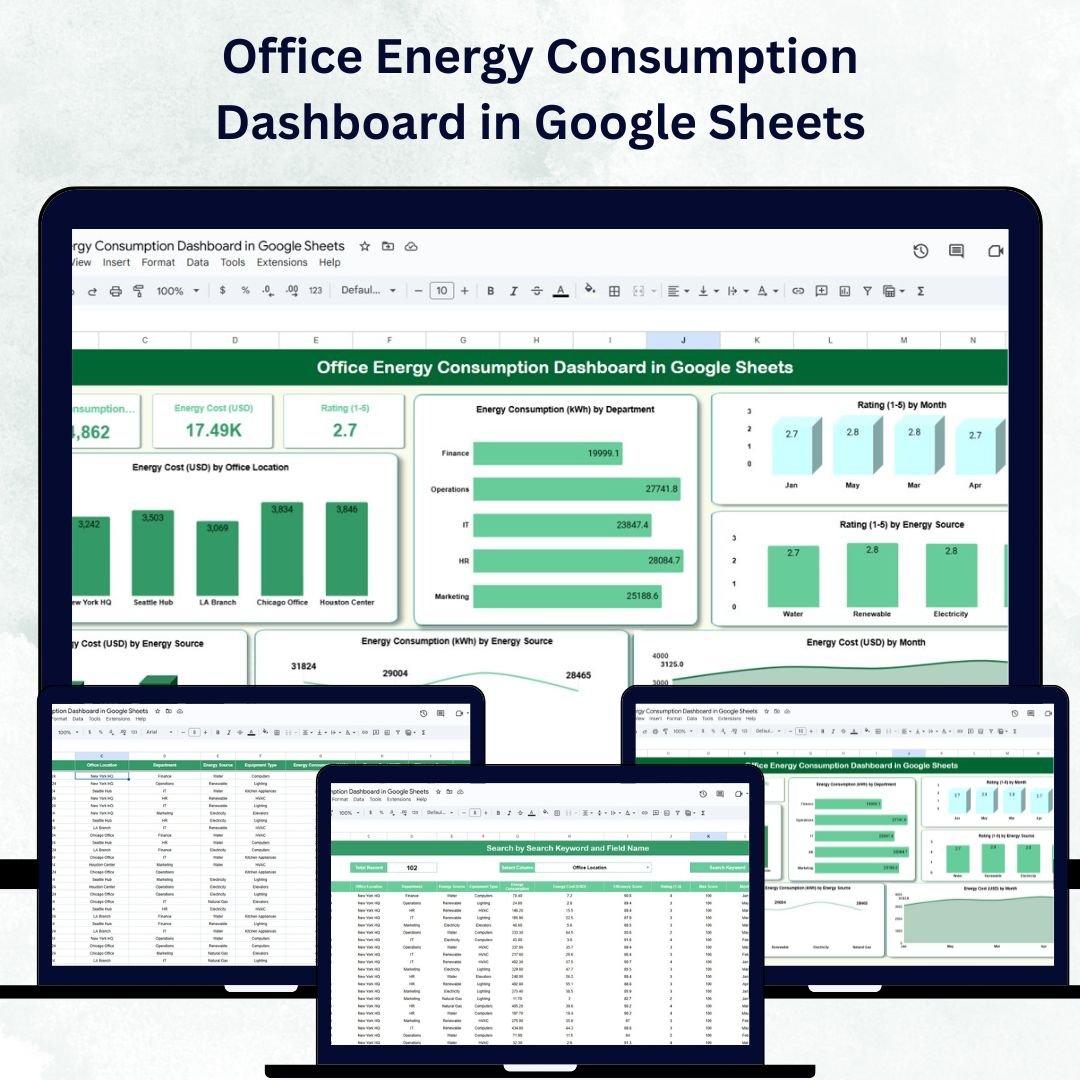
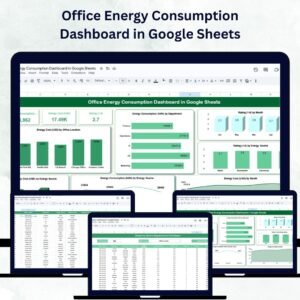
A powerful visual summary of energy usage and costs through key metrics and charts:
-
Energy Consumption (kWh): Total energy used
-
Energy Cost (USD): Total spending on energy
-
Rating (1–5): Sustainability or efficiency performance
-
-
Insightful charts include:
-
Energy Cost by Office Location
-
Energy Consumption by Department
-
Rating by Month
-
Rating by Energy Source (Electricity, Gas, Solar, etc.)
-
Energy Cost and Consumption by Energy Source
-
Energy Cost by Month for trend monitoring
-
🔍 Search Sheet Tab
-
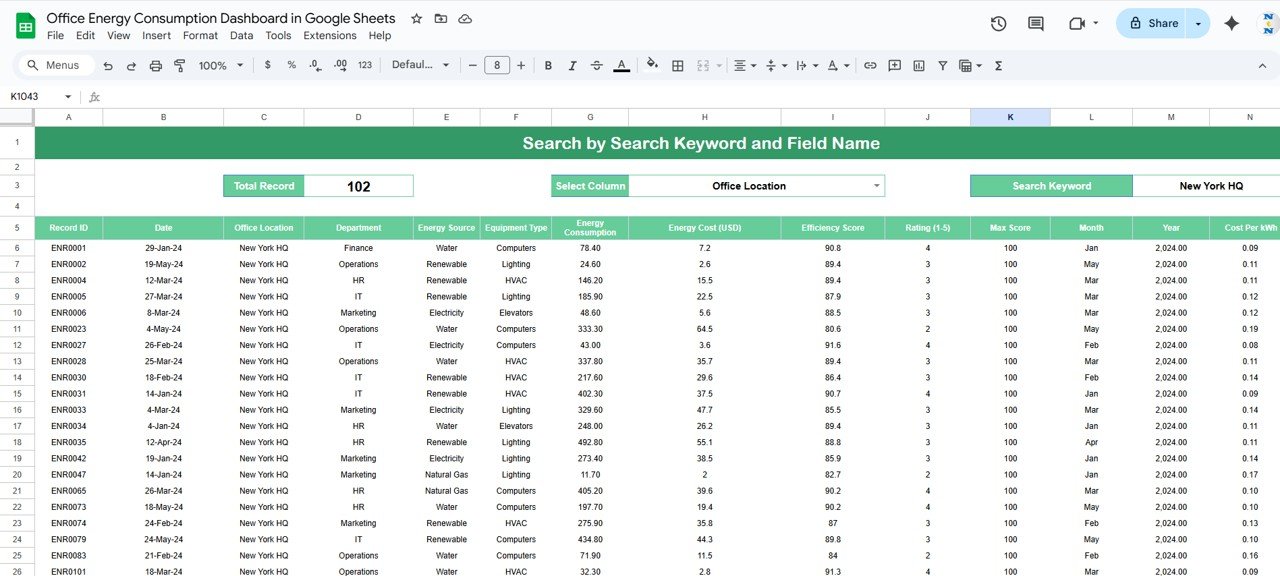
Quickly find specific records by keyword or field name
-
Filter results by department, office location, or equipment type
-
Perfect for targeted analysis and quick decision-making without scrolling through long data tables
🧾 Data Sheet Tab
-
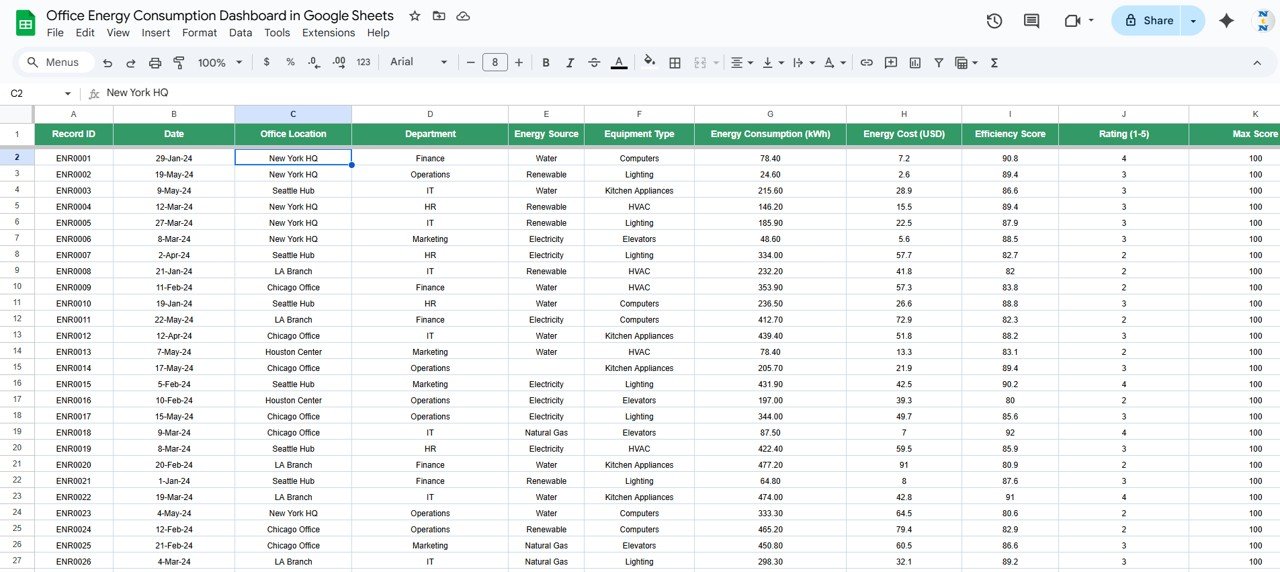
Centralized repository for all energy data, including:
-
Date, Department, Office Location, Energy Source, Cost, kWh, and Rating
-
-
Automatic updates to charts and dashboard visuals once new data is entered
-
Ensures consistent, reliable, and real-time performance monitoring
📦 What’s Inside the Office Energy Consumption Dashboard?
✅ Dashboard Sheet – Interactive charts and key performance cards
✅ Search Sheet – Easy-to-use filter for instant data lookup
✅ Data Sheet – Structured entry sheet with automated updates
✅ Sample Data Preloaded – Helps you understand functionality instantly
✅ Built-in Formulas & Dynamic Charts – No coding required
✅ Customizable Fields – Add your own metrics and energy sources
Everything is designed to be plug-and-play — just add your organization’s energy data and start tracking insights right away. 🚀
🧑💼 Who Can Benefit from This Dashboard?
🌿 Facility Managers – Monitor and control energy consumption across office buildings
💰 Finance Teams – Track energy costs and identify high-expense sources
🏢 Operations Managers – Evaluate departmental energy performance
🌎 Sustainability Officers – Measure and report on environmental KPIs
🧠 Executives & Auditors – Review high-level insights for compliance and strategy
This Google Sheets-based solution is ideal for businesses, nonprofits, and government organizations aiming to manage energy consumption more effectively.
🧪 How to Use the Office Energy Consumption Dashboard
-
Input Data – Add energy usage and cost details in the Data Sheet
-
Review the Dashboard – Visualize consumption, costs, and trends instantly
-
Search for Details – Use the Search Sheet for quick lookups by keyword or field
-
Monitor Monthly Trends – Identify seasonal patterns or spikes in energy use
-
Take Action – Implement energy-saving strategies based on data insights
With its clean design and real-time update capability, this dashboard ensures efficiency, accuracy, and collaboration for your entire team. ✅
🌟 Why Choose This Dashboard?
-
All-in-one energy tracking system in Google Sheets
-
Real-time collaboration and live updates
-
Visual insights via interactive charts and metrics
-
Monitors sustainability and efficiency scores
-
Fully customizable for any organization
-
No technical setup required — 100% ready to use
Take charge of your organization’s energy management with the Office Energy Consumption Dashboard in Google Sheets — where data meets sustainability. 🌿📈
🔗 Click here to read the Detailed blog post
Watch the step-by-step video Demo:










Reviews
There are no reviews yet.