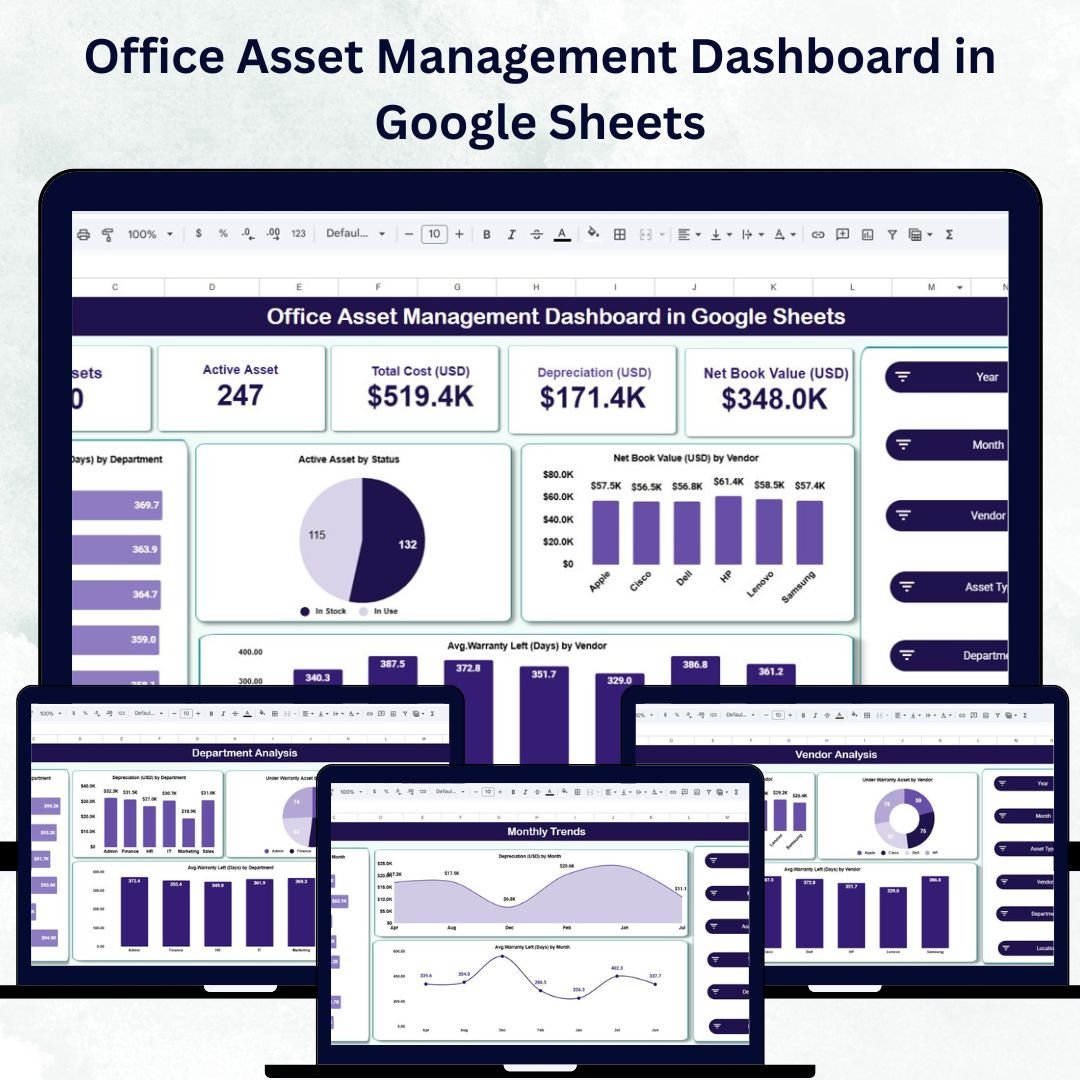

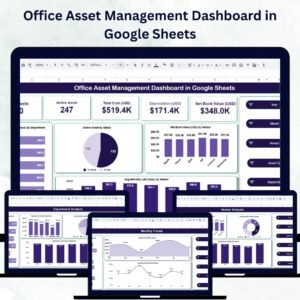
Managing office assets efficiently is key to controlling costs, minimizing downtime, and optimizing asset lifecycles. The Office Asset Management Dashboard in Google Sheets is a ready-to-use, interactive tool that allows organizations to track assets, monitor depreciation, manage warranties, and evaluate vendor performance—all in one centralized dashboard.
Designed for facility managers, finance teams, and IT departments, this dashboard simplifies complex asset management processes by consolidating data into visual charts and key insights. With its real-time updates, intuitive design, and automation capabilities, it transforms your Google Sheets into a powerful asset tracking and decision-making system.
🔑 Key Features of the Office Asset Management Dashboard in Google Sheets
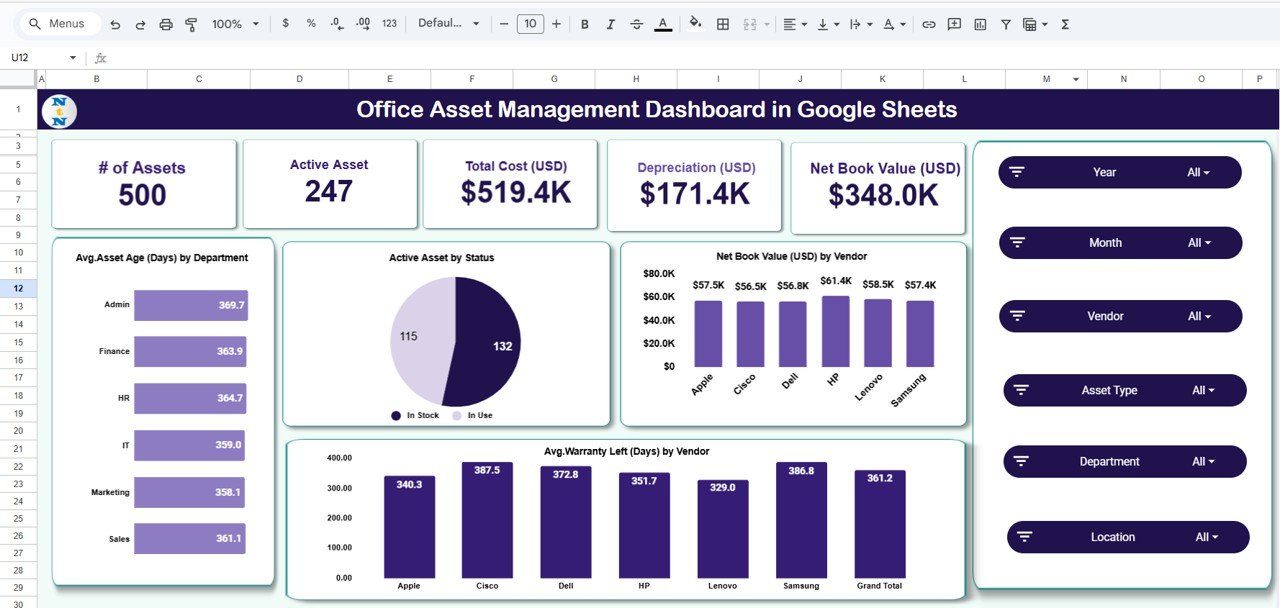
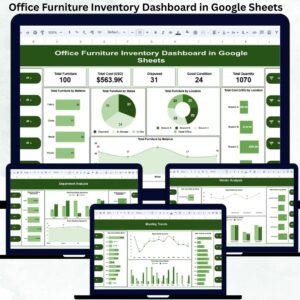
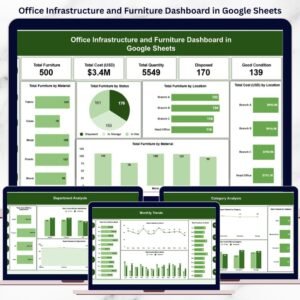
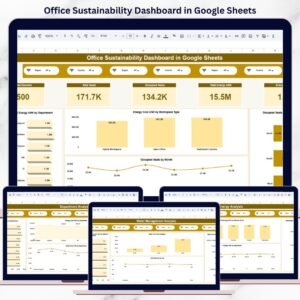
📊 Overview Sheet Tab
The Overview tab provides a comprehensive summary of your asset portfolio.
Includes:
-
🖥️ # of Assets: Total number of assets being tracked
-
⚙️ Active Assets: Currently functional and in-use assets
-
💰 Total Cost (USD): Original purchase value of all assets combined
-
📉 Depreciation (USD): Total depreciation accumulated
-
💎 Net Book Value (USD): Current value after depreciation
Charts:
-
📅 Avg. Asset Age (Days) by Department: Monitor asset longevity
-
🏢 Active Assets by Status: Identify operational, maintenance, or retired assets
-
💸 Net Book Value by Vendor: Analyze vendor performance and cost contribution
-
🧾 Avg. Warranty Left (Days) by Vendor: Track warranty periods to plan timely replacements
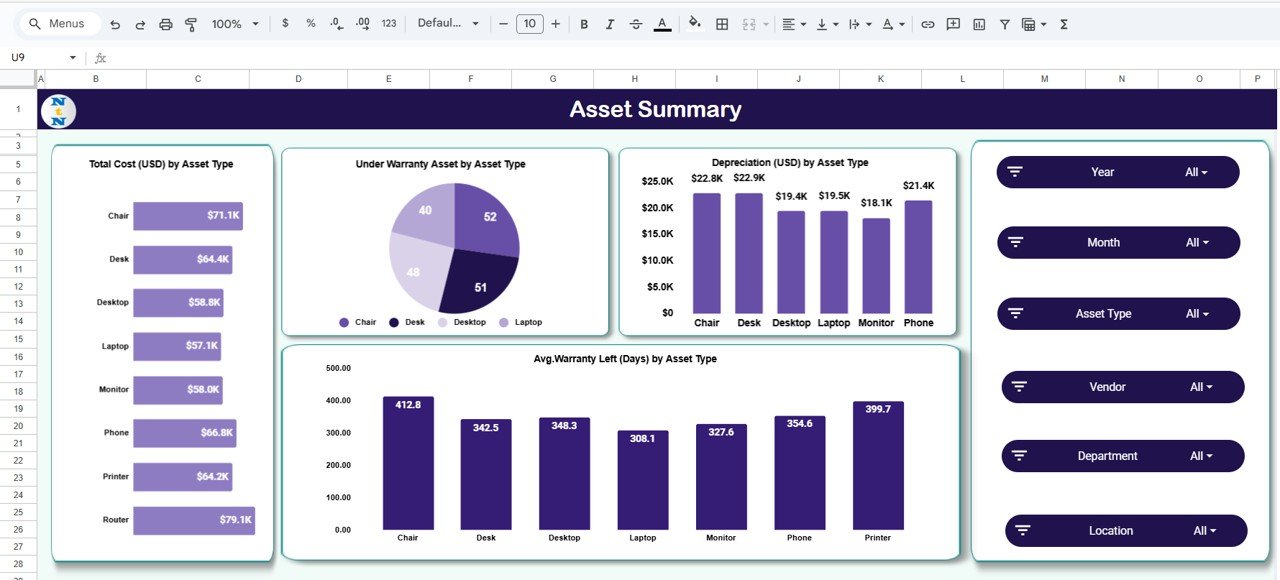
📘 Asset Summary Sheet Tab
Gain insights into assets categorized by type.
Charts Include:
-
💰 Total Cost by Asset Type
-
🧰 Depreciation by Asset Type
-
🕒 Avg. Warranty Left by Asset Type
-
🛡️ Under Warranty Assets by Asset Type
This helps managers understand which asset categories are consuming more budget or nearing end-of-life.
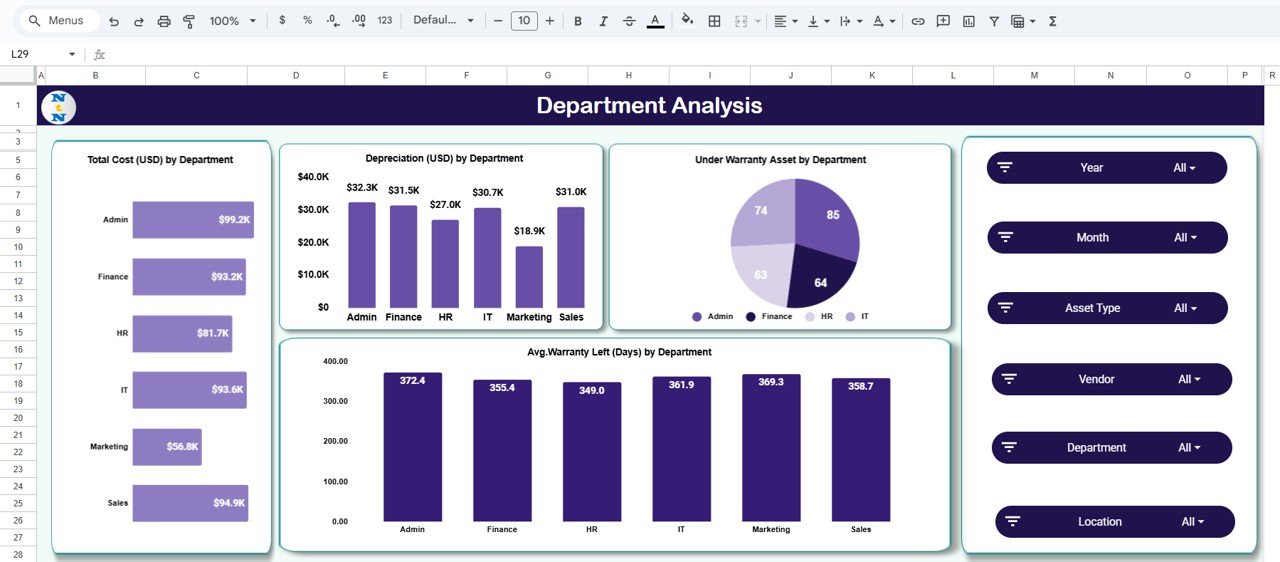
🏢 Department Analysis Sheet Tab
Analyze asset distribution across departments.
Charts Include:
-
💸 Total Cost by Department
-
📉 Depreciation by Department
-
🧾 Under Warranty Assets by Department
-
⏳ Avg. Warranty Left by Department
This enables department-level accountability and budget planning for replacements and maintenance.
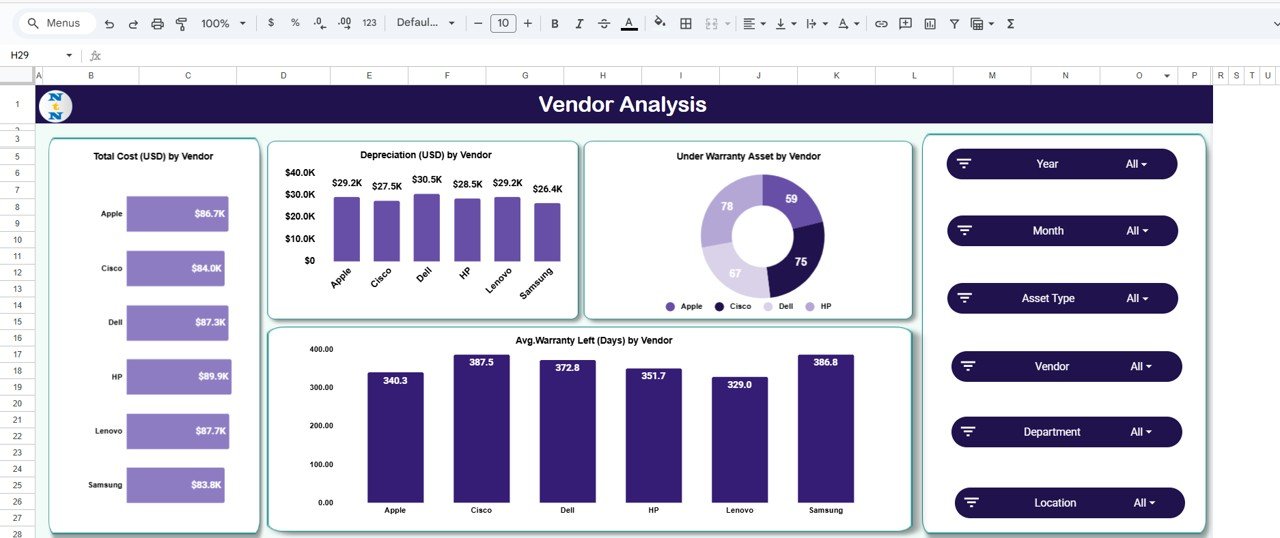
📦 Vendor Analysis Sheet Tab
Evaluate vendor performance with real-time analytics.
Charts Include:
-
💰 Total Cost by Vendor
-
📉 Depreciation by Vendor
-
🛡️ Under Warranty Assets by Vendor
-
⏱️ Avg. Warranty Left by Vendor
Helps finance and procurement teams identify reliable vendors and negotiate better deals.
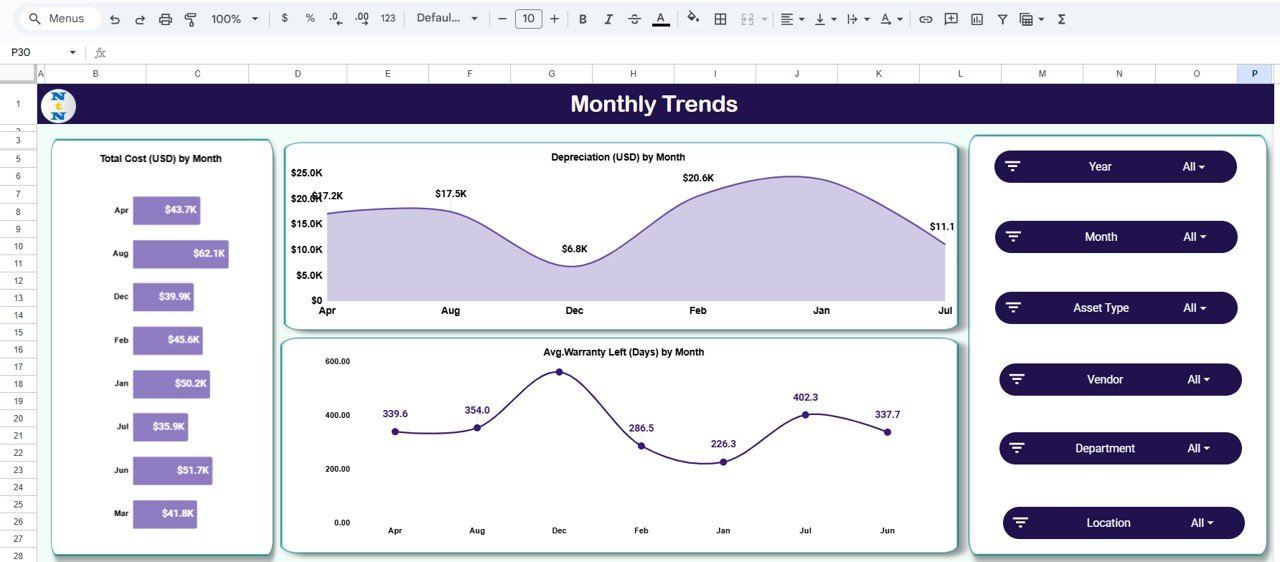
📅 Monthly Trends Sheet Tab
Visualize how asset costs, depreciation, and warranty coverage evolve over time.
Charts Include:
-
💰 Total Cost by Month
-
📉 Depreciation by Month
-
🧾 Avg. Warranty Left by Month
This enables forecasting and financial planning for future asset acquisitions.
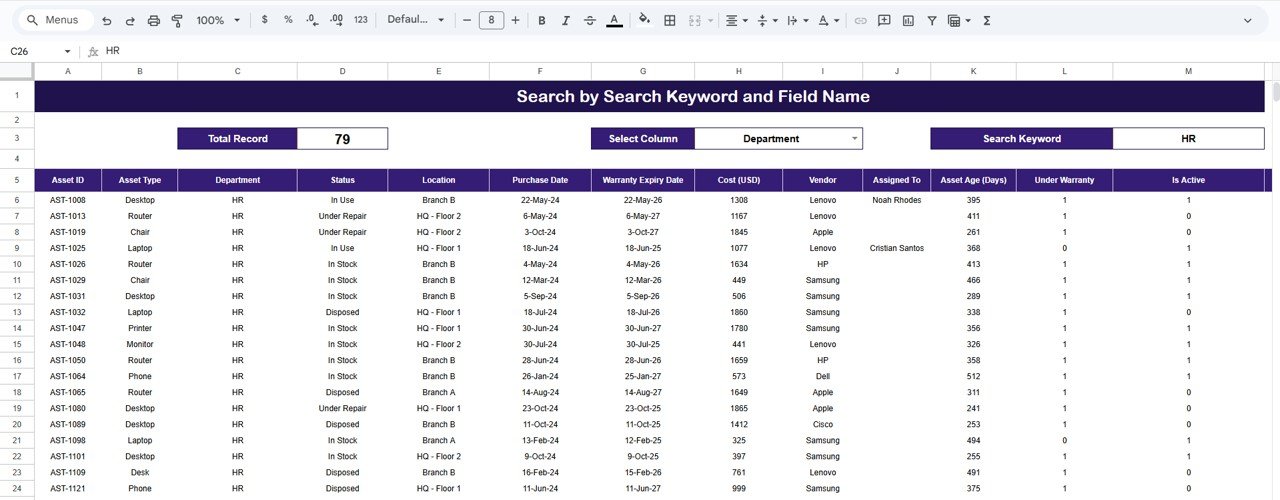
🔍 Search Sheet Tab
Quickly locate assets using keywords.
Search by:
-
Asset Name
-
Department
-
Vendor
-
Asset Type
Makes it easy to find specific records without scrolling through long data lists.
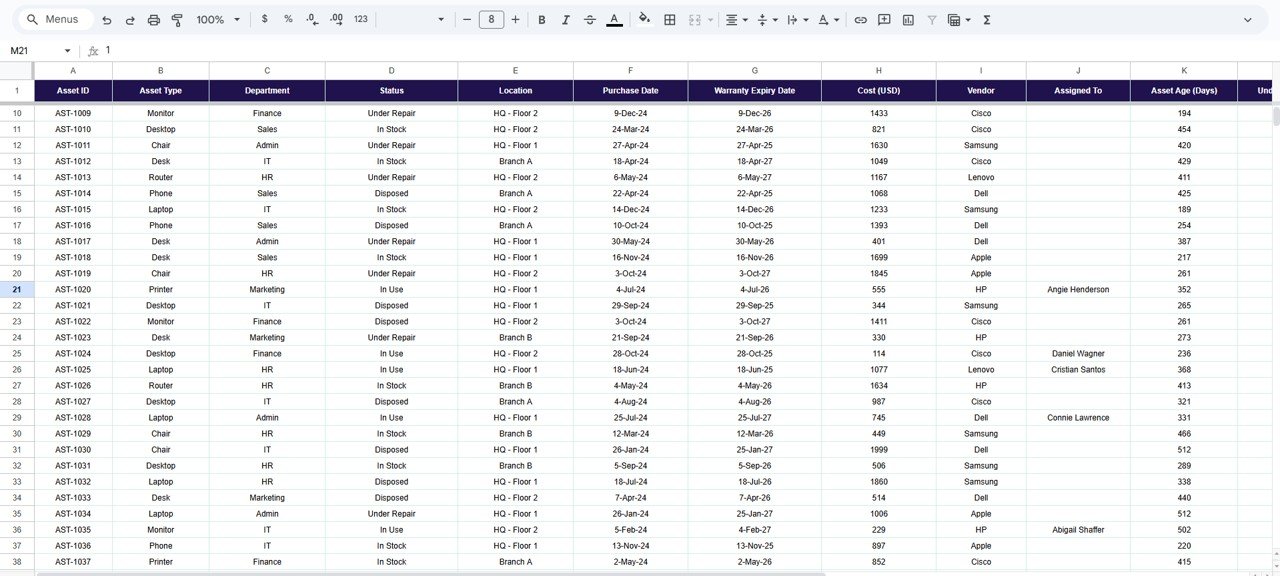
📋 Data Sheet Tab
This is the central database containing all asset information:
-
Purchase Date, Cost, Vendor, Department, Warranty, and Status
-
Automatically updates dashboard visuals
This ensures data accuracy, real-time analytics, and audit-ready tracking.
🌟 Advantages of Using the Office Asset Management Dashboard
✅ Centralized Tracking: Manage all assets in a single dashboard
📊 Visual Insights: Instantly understand performance through dynamic charts
📉 Depreciation Monitoring: Track declining asset value for accounting and planning
🛡️ Warranty Management: Prevent costly repairs by monitoring expiry dates
🏢 Department & Vendor Insights: Evaluate asset utilization across functions
📅 Trend Analysis: Predict upcoming replacement and maintenance needs
⚙️ Customizable & Collaborative: Modify fields and formulas; share in real time
This dashboard empowers your team to make smarter, faster, and more informed asset decisions.
💡 Best Practices for Using the Dashboard
-
Update Regularly: Keep purchase dates, costs, and depreciation up to date.
-
Segment Smartly: Use department and vendor filters for focused analysis.
-
Monitor Warranties: Set alerts or conditional formatting for nearing expirations.
-
Analyze Monthly Trends: Identify seasonal asset spending patterns.
-
Collaborate: Allow multiple departments to update and manage data together.
🧠 How This Dashboard Helps Businesses
💼 Finance Teams: Track asset depreciation and book value for accurate reporting.
⚙️ Facility Managers: Monitor maintenance, warranties, and replacements.
💻 IT Departments: Manage hardware lifecycles and vendor efficiency.
📈 Executives: Get a visual, real-time overview of asset health and costs.
This Office Asset Management Dashboard in Google Sheets turns your daily asset management tasks into a data-driven, organized, and proactive process.
🔗 Click here to read the Detailed blog post
Watch the step-by-step video Demo:


Reviews
There are no reviews yet.