
Running a successful craft brewery isn’t just about brewing great beer 🍺 — it’s about mastering your data! The Craft Brewery KPI Dashboard in Google Sheets is your all-in-one performance tracker designed to help you monitor production, sales, inventory, and efficiency with ease.
Built in Google Sheets, this ready-to-use dashboard transforms your brewery data into clear visuals and real-time insights — so you can focus less on spreadsheets and more on brewing success! 🌟
⚙️ Key Features of the Craft Brewery KPI Dashboard in Google Sheets
💡 Interactive Dashboard Controls: Select any month from the dropdown, and watch all charts and KPIs update instantly.
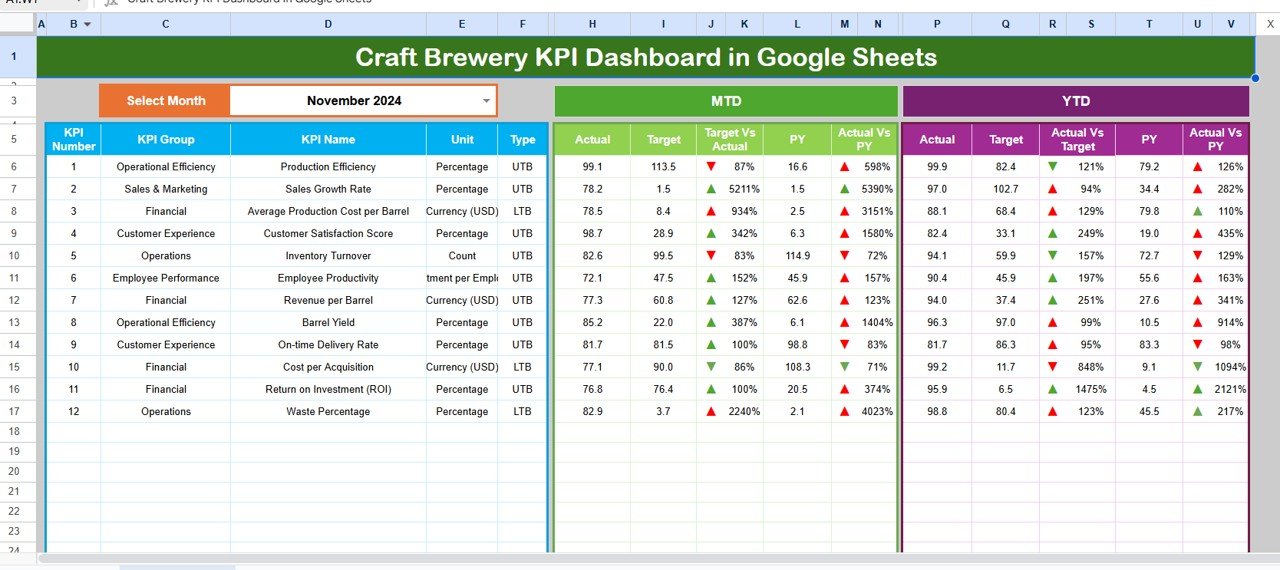
📊 MTD & YTD Tracking: View Month-to-Date and Year-to-Date performance at a glance, complete with Actual vs Target and Actual vs Previous Year comparisons.
📈 Automatic Calculations: Forget manual math — all formulas are pre-built and auto-calculated for accurate reporting.
🚦 Smart Visual Indicators: Up and down arrows 🔼🔽 and color coding instantly highlight areas of success or concern.
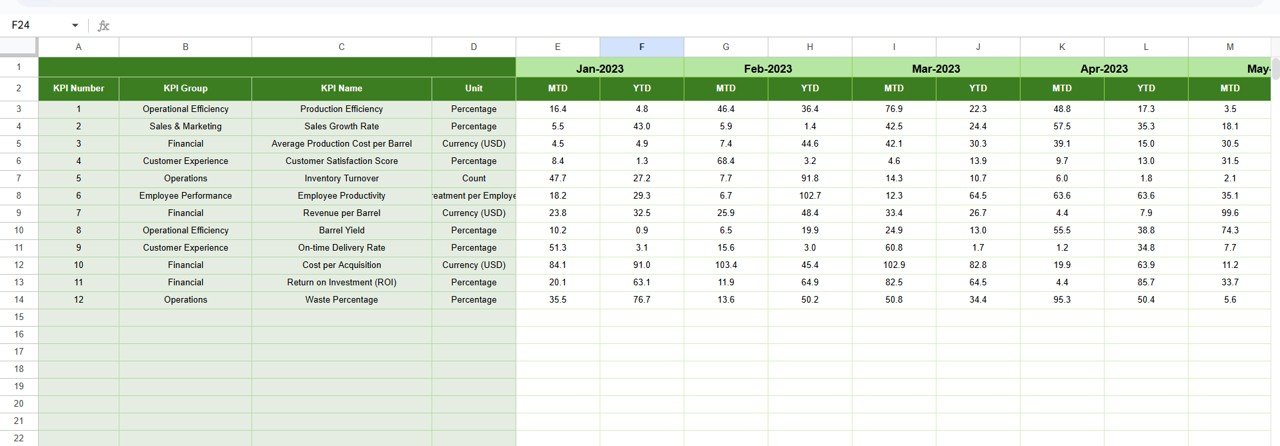
📅 Historical Insights: Compare current performance against previous year data to understand growth trends.
🌐 Cloud-Based Collaboration: Multiple team members can update data in real-time from anywhere.
🎯 Customizable Metrics: Add or remove KPIs to match your unique brewery goals.
💻 No Extra Software Needed: 100% built in Google Sheets — no coding, no add-ons!
📂 What’s Inside the Craft Brewery KPI Dashboard in Google Sheets
When you download this product, you’ll get a complete, organized system built for performance clarity:
1️⃣ Dashboard Sheet: The main control center where you can track MTD and YTD KPIs like brewing yield, batch cycle time, and sales performance.
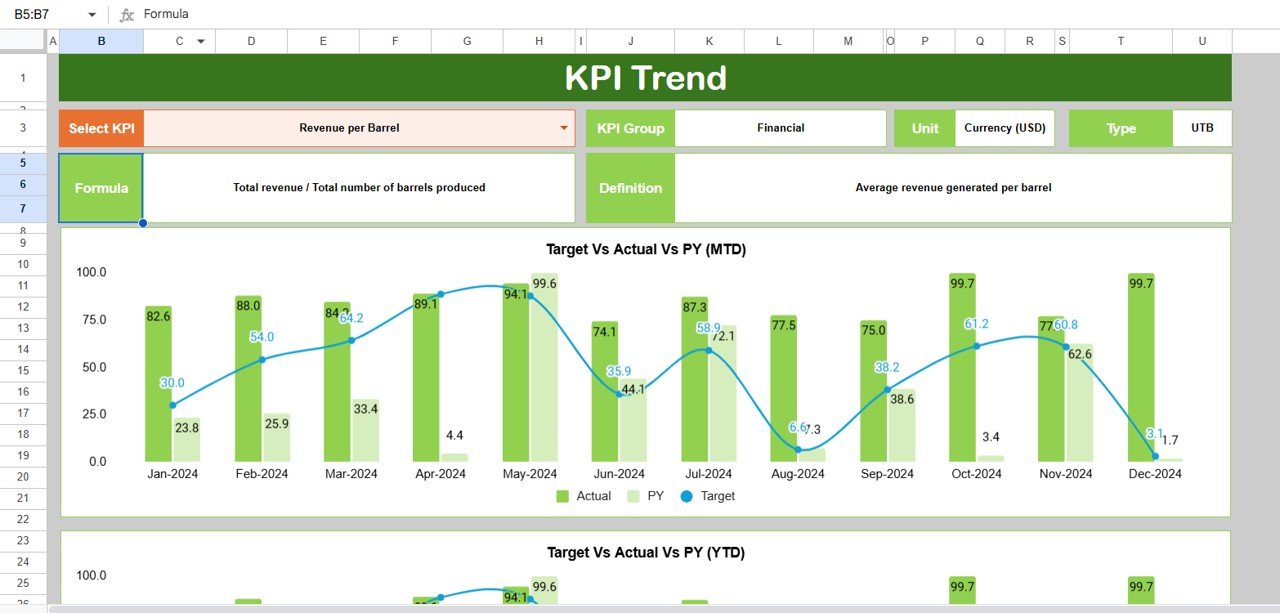
2️⃣ Trend Sheet: Choose a KPI from the dropdown and view detailed charts comparing Actual, Target, and Previous Year data.
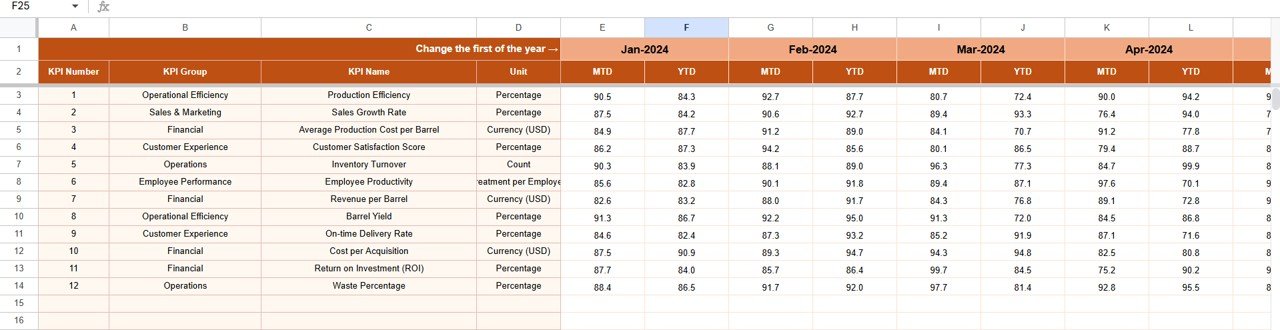
3️⃣ Actual Numbers Input Sheet: Enter your monthly data — the dashboard updates automatically!
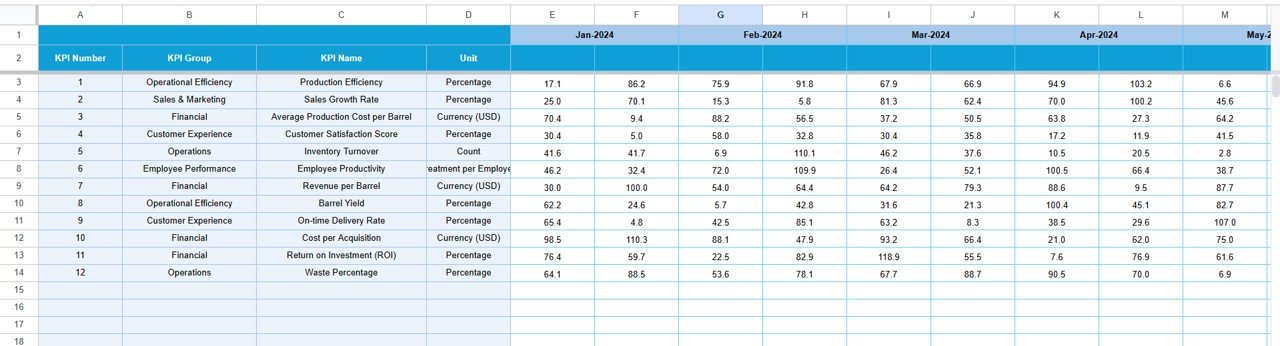
4️⃣ Target Sheet: Define your monthly and yearly goals to measure success effectively.
5️⃣ Previous Year Sheet: Store and compare last year’s figures for growth analysis.
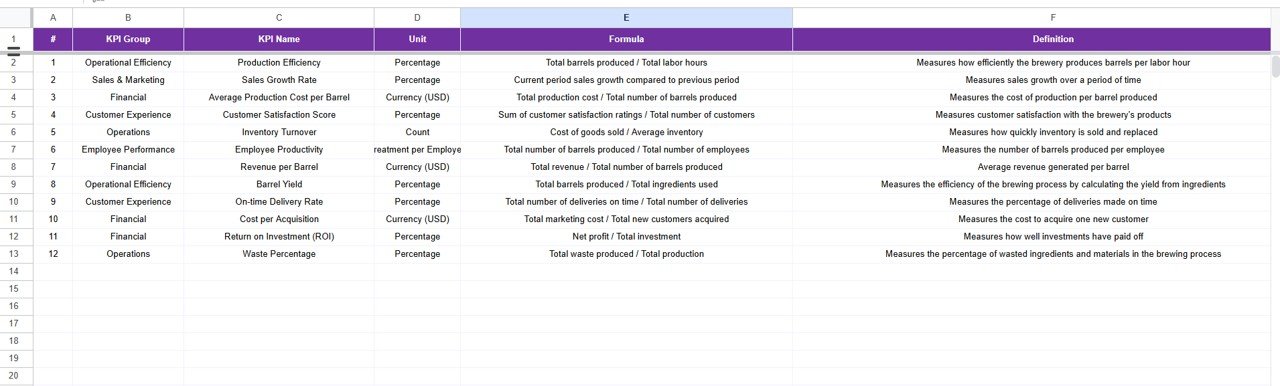
6️⃣ KPI Definition Sheet: Includes KPI name, unit, formula, type (UTB/LTB), and definition for reference clarity.
Each sheet works seamlessly together to provide real-time tracking and reporting.
🚀 How to Use the Craft Brewery KPI Dashboard in Google Sheets
Using this tool is simple and intuitive:
✅ Step 1: Open the “Actual Numbers Input” sheet and enter your monthly performance data.
✅ Step 2: Update your goals in the “Target” sheet.
✅ Step 3: Add previous year’s data for comparison.
✅ Step 4: Go to the “Dashboard” tab, pick your month, and watch the entire view update automatically!
✅ Step 5: Use the “Trend” tab to explore specific KPIs over time.
✅ Step 6: Collaborate easily with your team — everyone can edit simultaneously in Google Sheets.
That’s it! You’ll have a live, data-driven control center to manage production, sales, and efficiency all in one place. 📊
👩💼 Who Can Benefit from This Craft Brewery KPI Dashboard
🍻 Brewery Owners & Managers: Gain real-time visibility into production efficiency and costs.
📉 Operations Teams: Track batch yields, waste levels, and optimize resources.
💰 Finance & Accounting Teams: Compare sales revenue vs. cost for better budgeting.
📈 Sales & Distribution Teams: Measure performance by channel or region.
📊 Consultants & Analysts: Use customizable visuals to create performance reports for clients.
🧠 Start-Ups & Small Breweries: Build a data-driven culture without heavy investment in BI tools.
With this dashboard, every decision you make will be backed by accurate, up-to-date data.


Reviews
There are no reviews yet.