
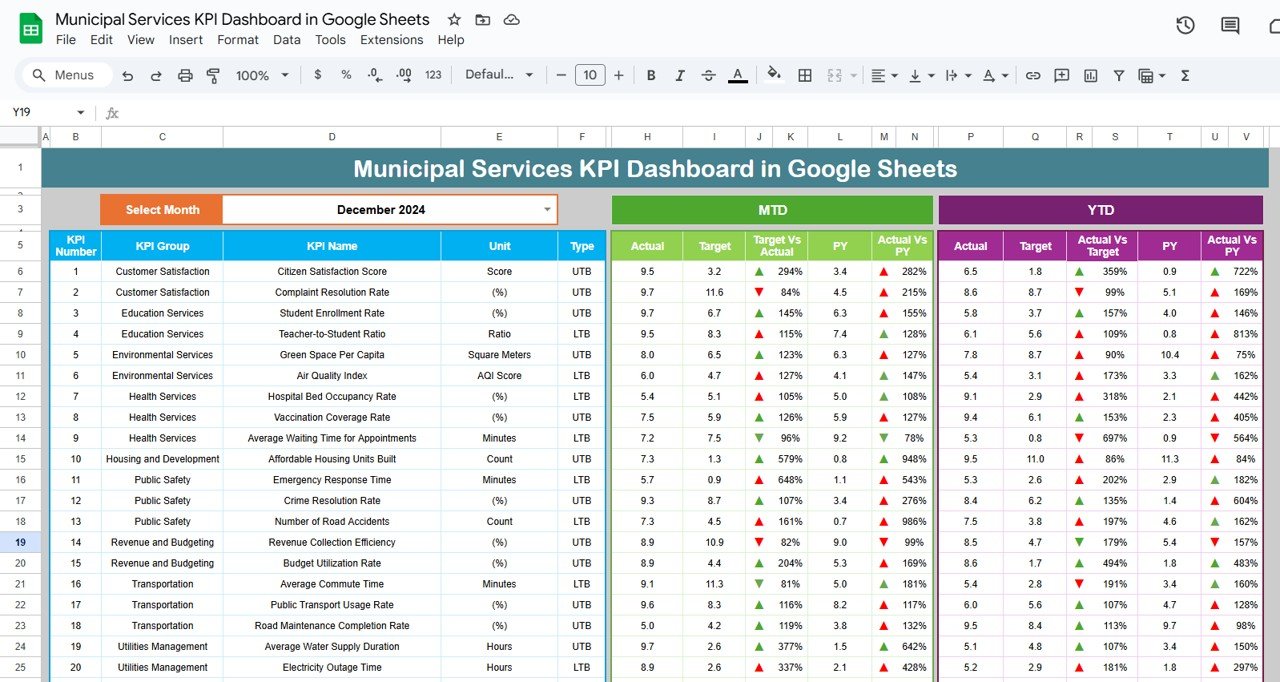
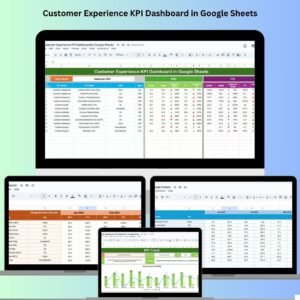
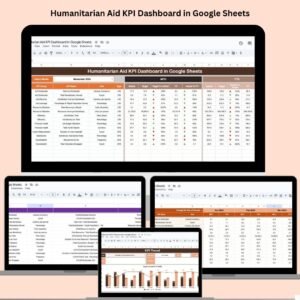
The Municipal Services KPI Dashboard in Google Sheets is a dynamic, all-in-one tool designed to help local governments effectively track the performance of essential public services. This powerful dashboard helps municipal authorities monitor KPIs like water supply efficiency, waste collection rates, street maintenance, and more. It offers a comprehensive, easy-to-use platform for data-driven decision-making.
🔑 Key Features of the Dashboard:
-
Real-time Data: Quickly update your data as it changes, ensuring accurate reporting at all times.
-
Month-to-Date & Year-to-Date (MTD & YTD): Track performance in real-time and analyze long-term trends to stay on top of municipal service delivery.
-
Visual Comparisons: See how current performance compares to past results with Target vs Actual and Previous Year vs Actual data.
-
Conditional Formatting: Visual indicators like up/down arrows offer at-a-glance performance insights.
-
Customizable for Your City: Tailor the dashboard to fit the specific needs and KPIs of your city, adjusting for local requirements.
What’s Inside the Municipal Services KPI Dashboard 🏙️💼
Inside this product, you’ll find six key worksheets designed for maximum impact and easy usage:
-
Dashboard Sheet: The core of your municipal performance tracking, featuring KPIs across various public services.
-
KPI Trend Sheet: Analyze specific KPIs over time, including detailed metrics, trends, and definitions.
-
Actual Numbers Sheet: A simple place to input real-time data on current municipal performance for MTD and YTD.
-
Target Sheet: Track targets for various KPIs and compare them to actual performance.
-
Previous Year Numbers Sheet: Use this sheet to compare this year’s data with previous year figures to spot improvements or regressions.
-
KPI Definition Sheet: Keep a clear record of the definitions, units, and formulas for each KPI.
How to Use the Municipal Services KPI Dashboard 🧑💼📈
To make the most of the Municipal Services KPI Dashboard, follow these simple steps:
-
Download and Open the Template: Once you’ve purchased the dashboard, open it in Google Sheets.
-
Update the Data: Regularly enter the MTD and YTD data for your municipal services into the Actual Numbers Sheet.
-
Set Targets: Define your target KPIs in the Target Sheet to track how your performance compares.
-
Track Performance: Use the Dashboard Sheet to monitor key performance indicators and identify areas needing attention.
-
Make Data-Driven Decisions: Leverage this data to drive improvement in municipal services, such as street maintenance or waste collection.
Who Can Benefit from This Municipal Services KPI Dashboard? 💼🏙️
This KPI Dashboard is perfect for local government officials, municipal managers, and city planners looking to streamline operations and improve service delivery. Whether you’re responsible for water supply, waste management, or street maintenance, this dashboard will help you:
-
Enhance Operational Efficiency: Identify performance gaps and streamline services to meet citizens’ needs.
-
Improve Transparency: Share progress and performance data with stakeholders for increased accountability.
-
Foster Data-Driven Decisions: Use real-time data and historical comparisons to make informed decisions that positively impact the community.
Advantages of Using the Municipal Services KPI Dashboard 🔍💡
-
Better Decision-Making: With real-time data and KPI comparisons, municipal leaders can make informed, data-driven decisions that benefit the community.
-
Improved Transparency: Clear, actionable insights make it easier to report on progress to the public, enhancing trust in local government.
-
Faster Response to Issues: Quickly identify performance gaps and take immediate action to address them—whether it’s waste collection or emergency response times.
Click here to read the Detailed Blog Post 📖
Watch the step-by-step video Demo:


Reviews
There are no reviews yet.