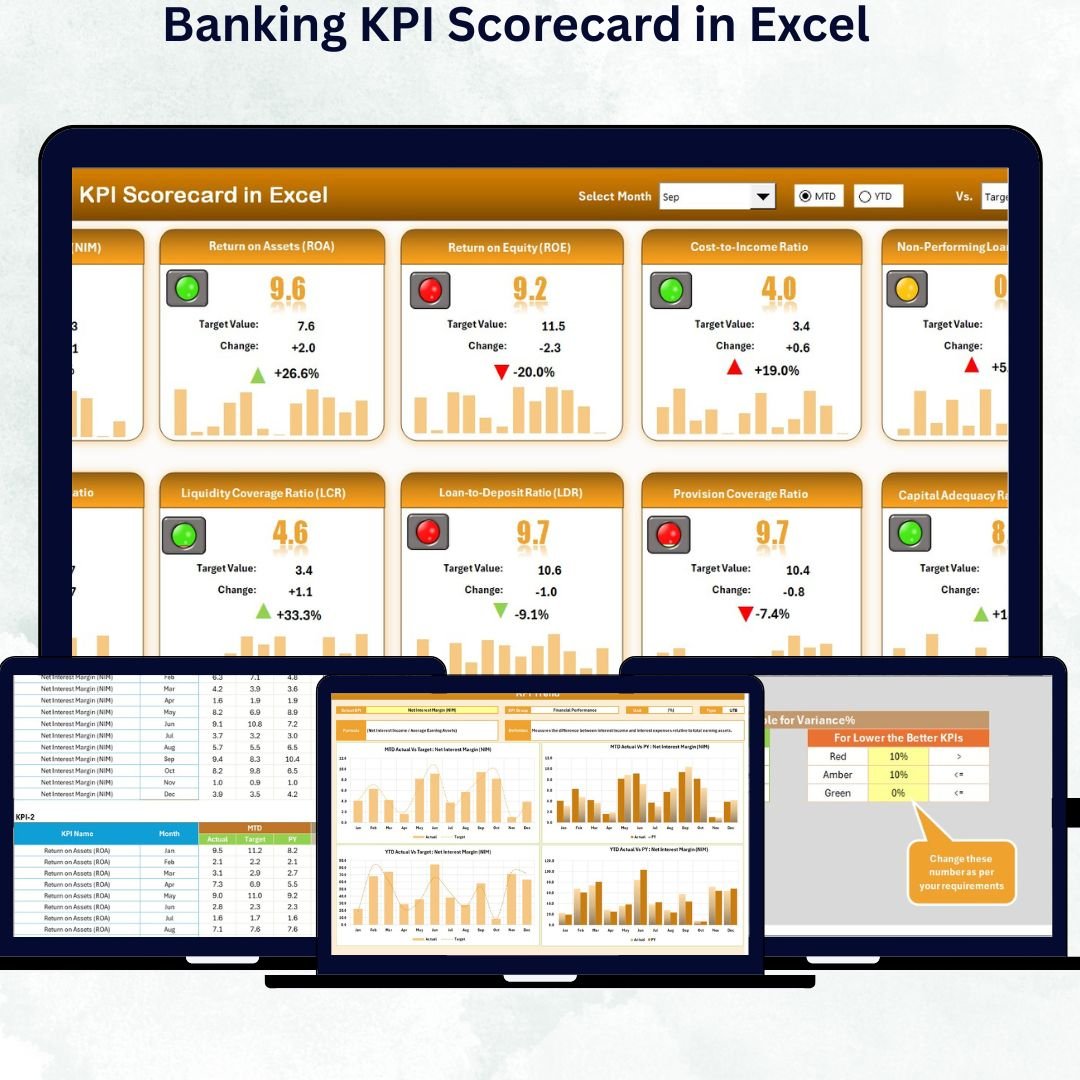
In today’s fast-moving banking industry, staying ahead requires more than intuition — it demands data-driven decisions. The Banking KPI Scorecard in Excel is your ultimate performance-tracking partner designed to help financial institutions monitor, analyze, and improve results with ease. Whether you manage a regional cooperative bank or a global financial organization, this ready-to-use Excel template transforms complex banking data into clear, visual, and actionable insights.
✨ Key Features of Banking KPI Scorecard in Excel
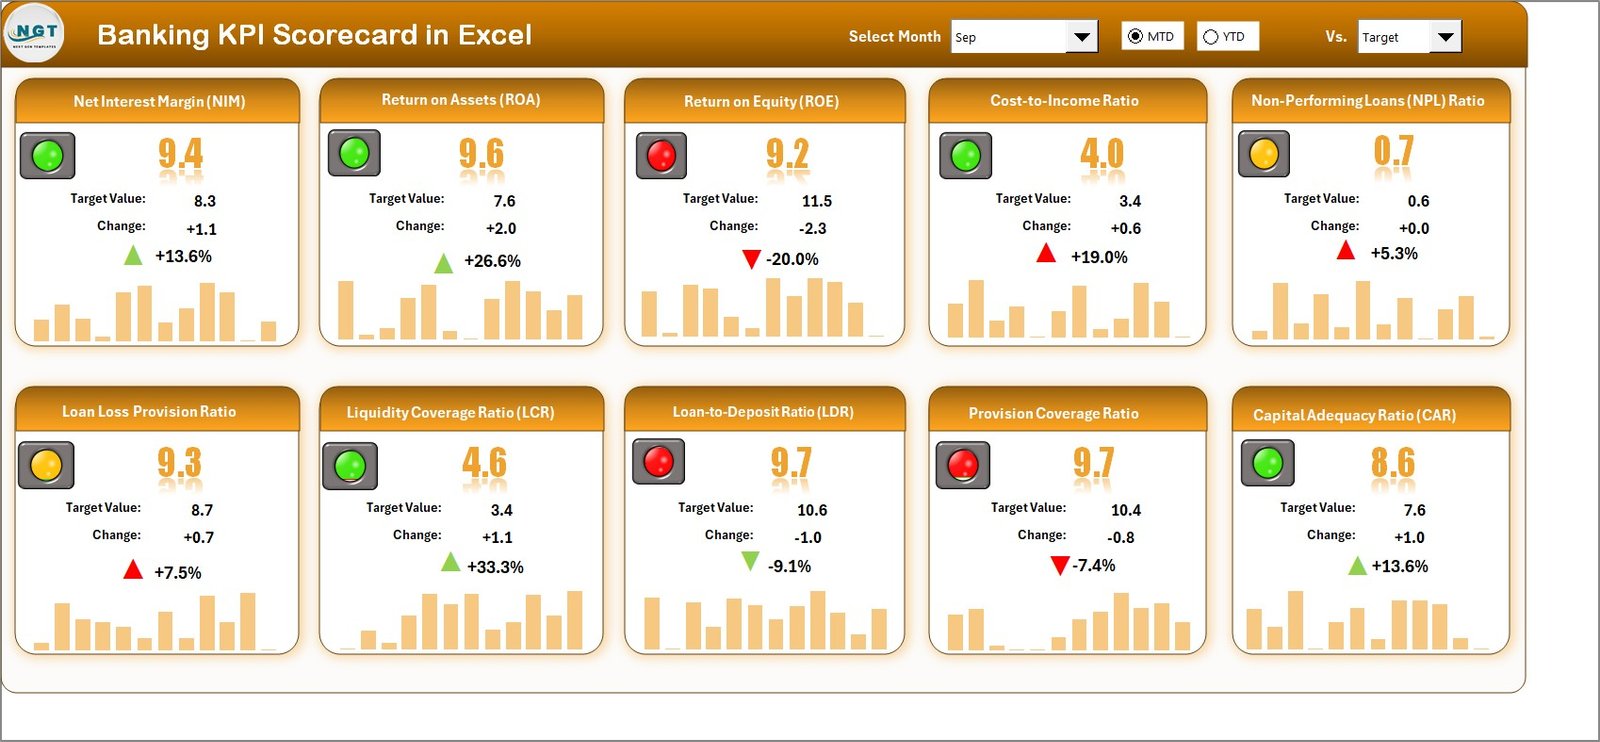
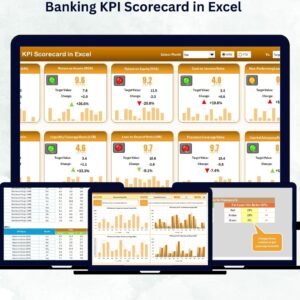
✅ Interactive Scorecard Dashboard: View all your banking KPIs in one place. Compare actuals vs targets, analyze monthly and yearly data, and instantly identify performance gaps with automated variance indicators.
📊 Dropdown Filters: Choose any month or performance period (MTD/YTD) for real-time analysis — no formulas required.
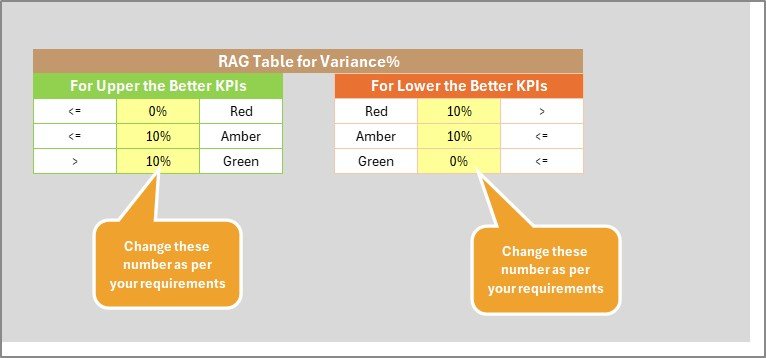
🟢 Traffic-Light Indicators: Quickly visualize performance status (Green = Good, Yellow = Average, Red = Needs Attention).
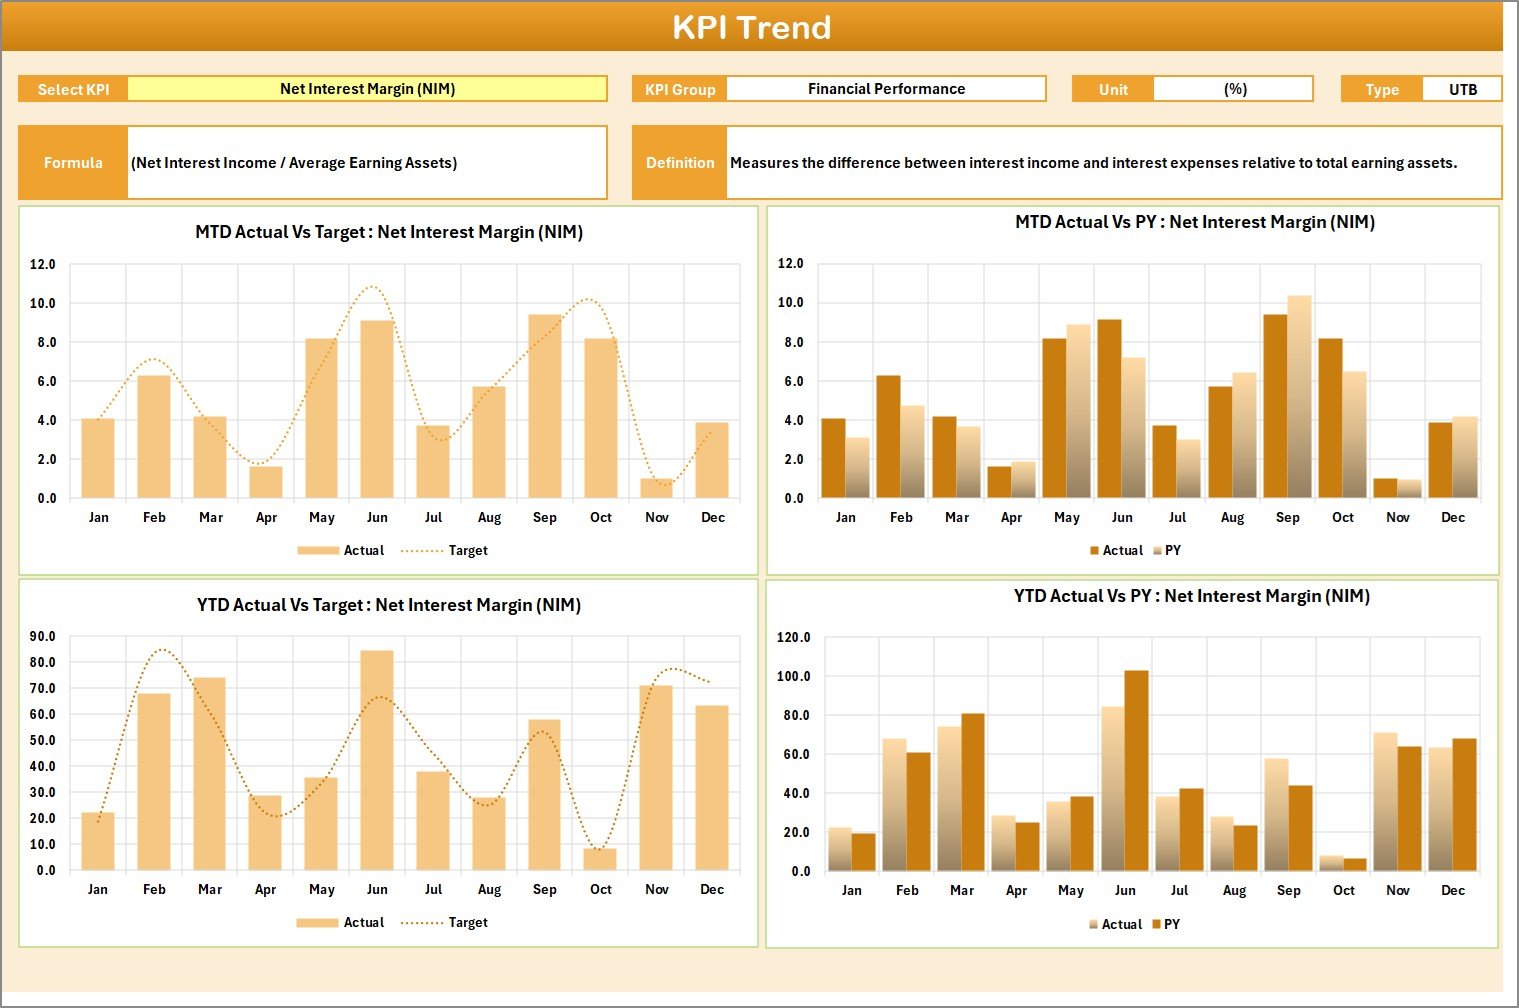
📈 Dynamic Charts & Visuals: Trend charts show KPI performance over time, helping you make data-driven forecasts and corrective actions.
💼 Multi-Department Insights: Track KPIs across Retail Banking, Corporate Banking, Risk Management, and Customer Service — all from a single file.
🔄 Auto-Refresh Calculations: Data entered once updates all dashboards automatically, ensuring consistent accuracy.
🧩 Customizable & Flexible: Add or edit KPIs, formulas, and visuals to align with your organization’s goals without extra software.
🔐 Secure & Offline Access: Protect sensitive financial data with Excel’s password tools and use it even without internet access.

🧾 What’s Inside the Banking KPI Scorecard in Excel
This powerful Excel scorecard is structured into four interactive worksheets, each designed to simplify performance management:
1️⃣ Scorecard Sheet – The central dashboard displaying all 10 key banking KPIs. Instantly compare actual vs target values, previous year data, and performance indicators in one view.
2️⃣ KPI Trend Sheet – Select any KPI from a dropdown to analyze month-to-month or year-to-year performance with visual charts. Understand patterns, spot growth areas, and address declines early.
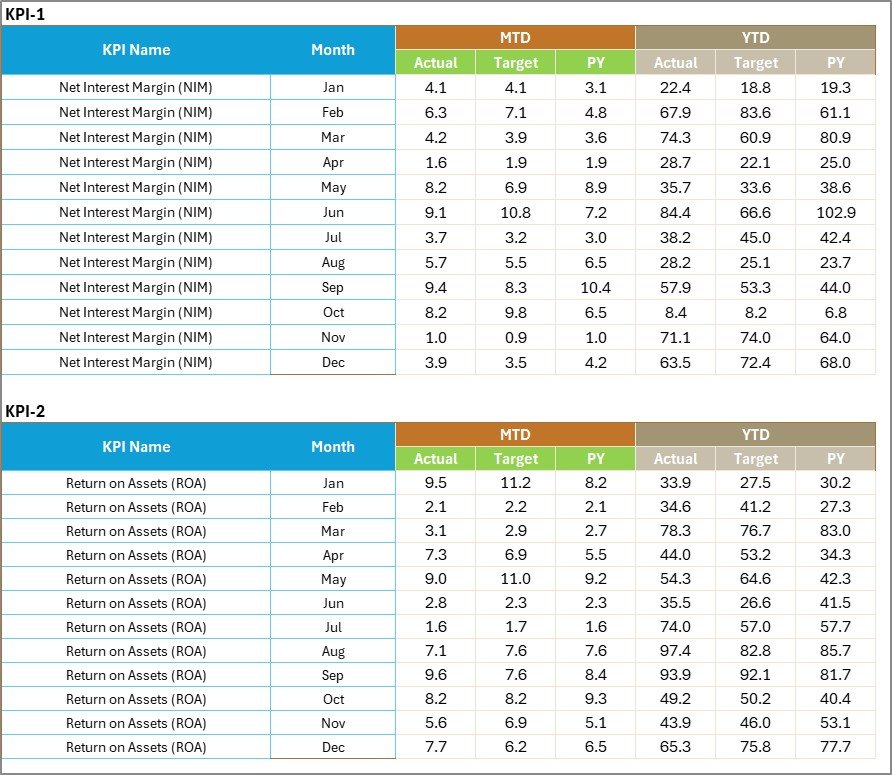
3️⃣ Input Data Sheet – Your data engine. Enter KPI values for actual, target, and previous year metrics. Once entered, all dashboards update automatically for accurate insights.
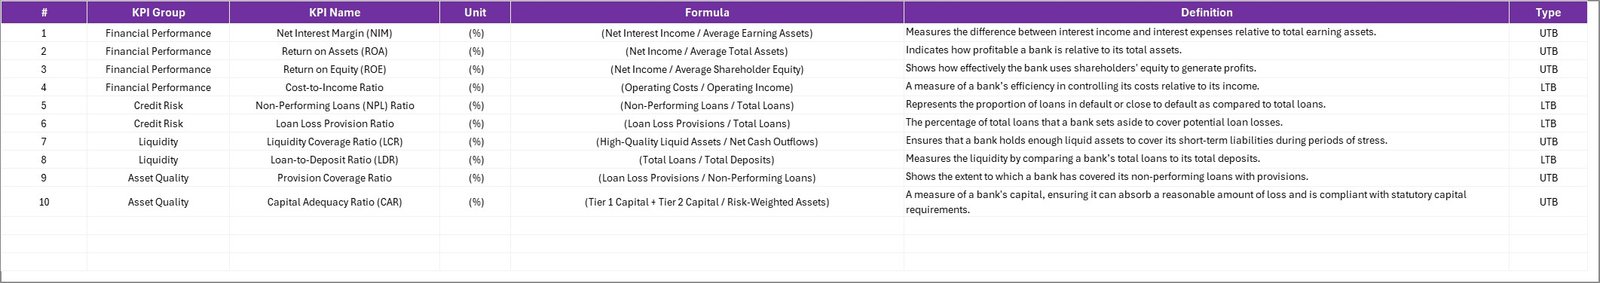
4️⃣ KPI Definition Sheet – Provides clarity for every metric, showing KPI Group, Unit, Formula, Definition, and Type (UTB / LTB). Ensures everyone in your team interprets KPIs consistently.
⚙️ How to Use the Banking KPI Scorecard in Excel
💾 Step 1: Enter your monthly KPI data in the Input Data Sheet.
🔁 Step 2: Select a month or performance type (MTD/YTD) on the Scorecard Sheet.
📉 Step 3: Review instant visuals and color-coded indicators to evaluate success.
📊 Step 4: Open the KPI Trend Sheet for deeper time-based performance analysis.
📘 Step 5: Refer to the KPI Definition Sheet for formula clarity and consistent evaluation.
No coding or VBA is needed — everything works through built-in Excel formulas and conditional formatting.
👥 Who Can Benefit from This Banking KPI Scorecard
🏦 Bank Managers & Executives: Monitor department performance and profitability with one consolidated dashboard.
📊 Finance & Strategy Teams: Align KPIs with business goals and make informed data-driven decisions.
👩💻 Business Analysts: Identify underperforming areas quickly and generate performance reports in minutes.
🧾 Risk Management Teams: Track compliance and operational risks through measurable indicators.
💡 Training & Learning Departments: Use it as a teaching tool for performance measurement and banking analytics.
This Excel-based scorecard is the perfect blend of simplicity, precision, and professional reporting, giving your banking operations a competitive edge.
✅ Why Choose the Banking KPI Scorecard in Excel
-
🚀 Boost efficiency with automated performance tracking.
-
🕒 Save hours of manual reporting.
-
💬 Improve decision-making with clear visuals.
-
🧭 Ensure alignment across all departments.
-
💰 No expensive software — just Excel.


Reviews
There are no reviews yet.