

Are your ad budgets increasing but results staying flat?Are you switching between Google Ads, Meta Ads, and reports just to understand performance?Stop guessing. Start measuring.The Media Buying KPI Scorecard in Excel is your all-in-one performance command center designed to track, analyze, and optimize your paid media campaigns with complete clarity.This ready-to-use Excel template allows you to monitor 10 powerful KPIs, compare Actual vs Target performance, and evaluate MTD (Month-to-Date) and YTD (Year-to-Date) results — all inside one structured dashboard.
No more scattered reports. No more confusion. Just clean, actionable performance insights.
🚀 Key Feature of Media Buying KPI Scorecard in Excel
✅ 4 Structured Worksheets for Complete KPI Tracking
Track, analyze, input data, and manage KPI definitions in a fully organized format.
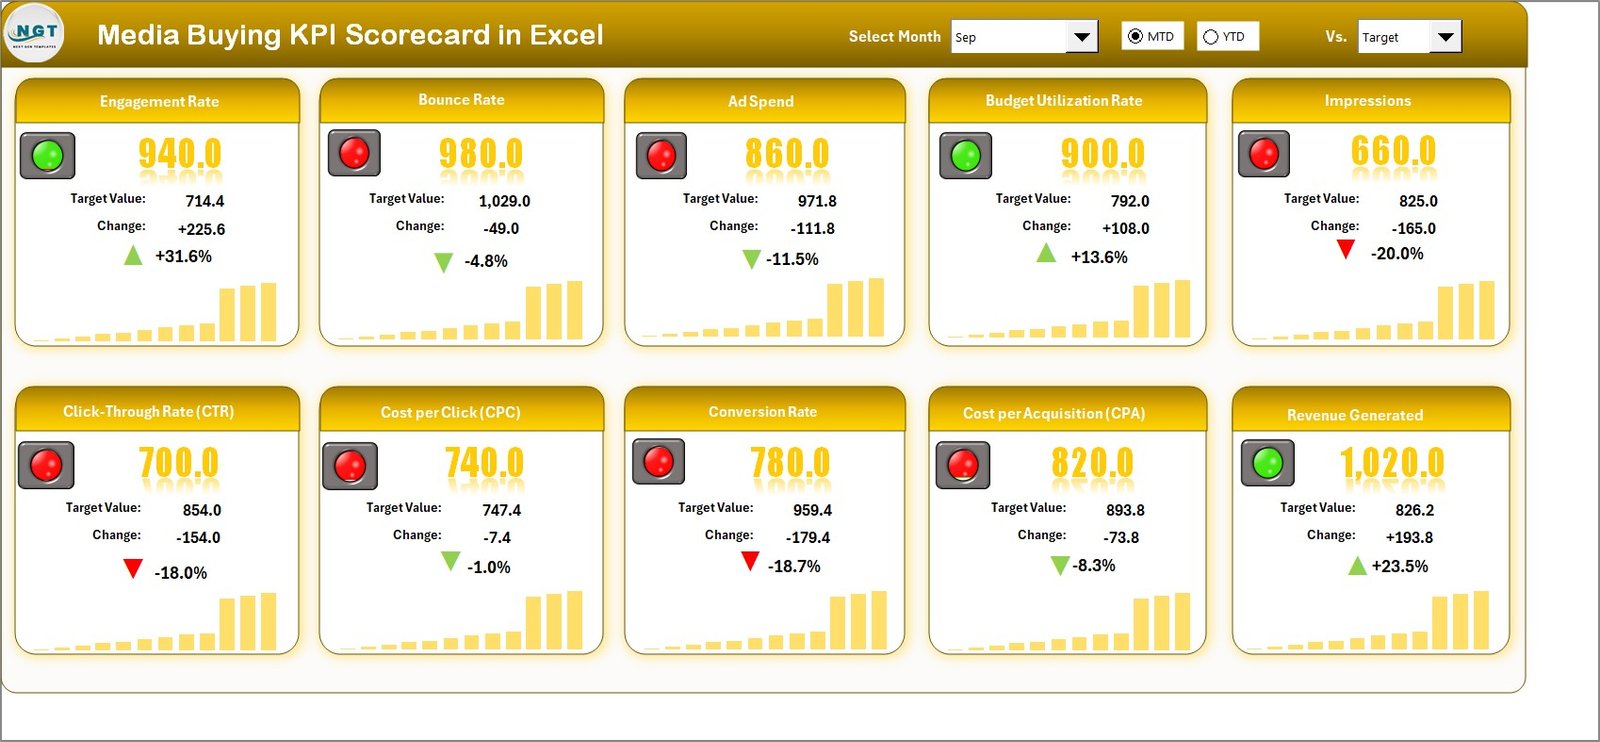
📊 Main Scorecard Dashboard
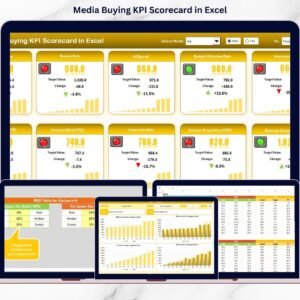
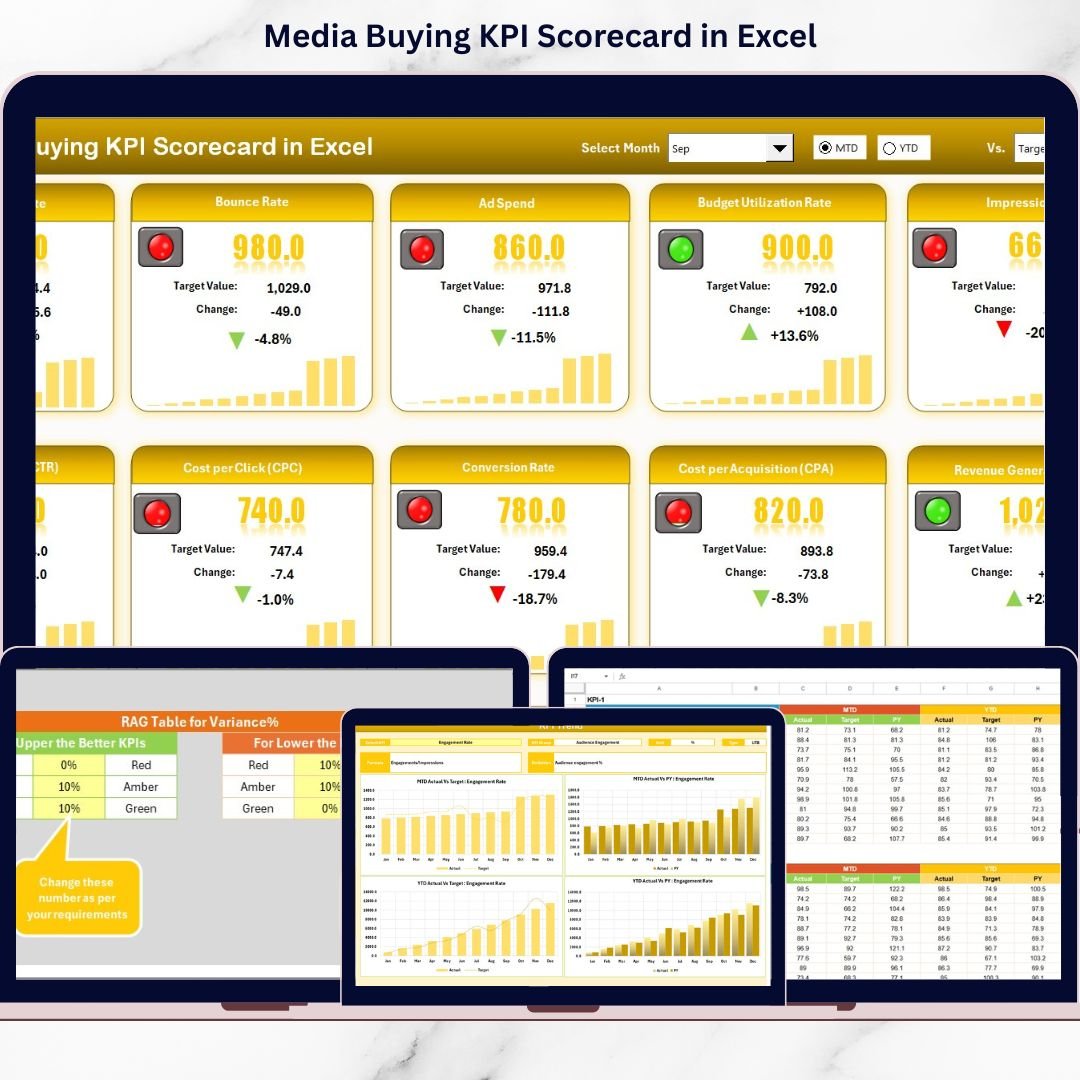
Monitor 10 KPIs at once with Actual, Target, Variance, and Performance % in a single powerful view.
📅 MTD & YTD Toggle Analysis
Switch between Month-to-Date and Year-to-Date using simple dropdown selections.
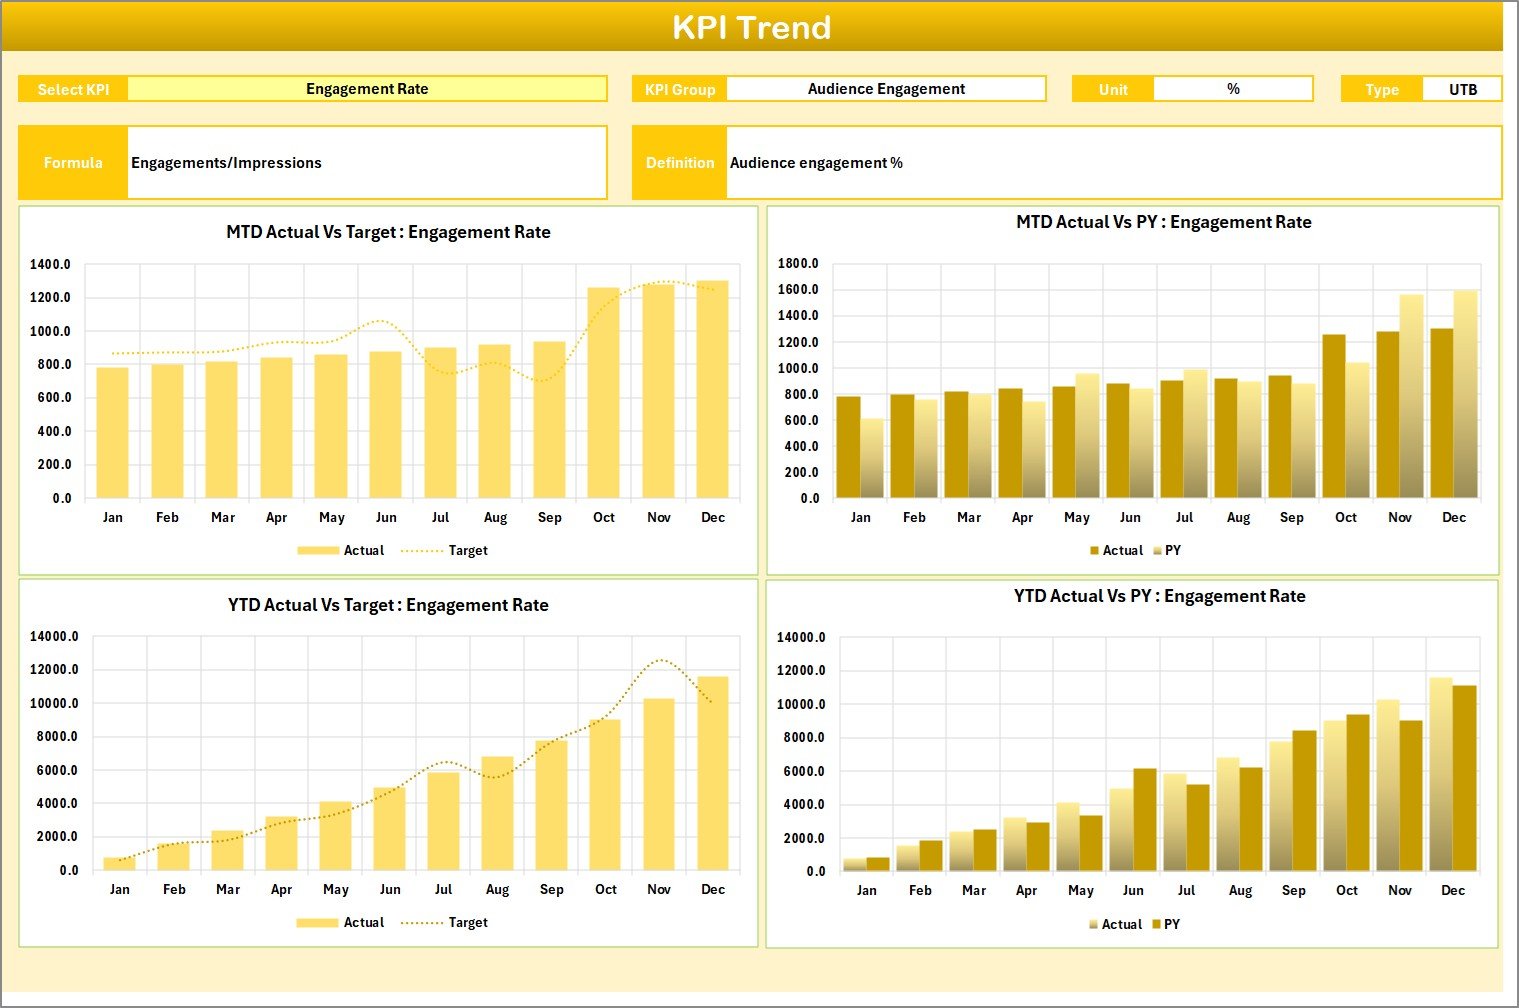
📈 Dynamic KPI Trend Analysis Sheet
Select any KPI and instantly view trend charts, KPI formula, type, unit, and definition.
🎯 Actual vs Target Comparison with Visual Signals
Color indicators, arrows, and conditional formatting instantly highlight overperformance or gaps.
🧾 Dedicated KPI Definition Sheet
Ensure team clarity by documenting KPI formulas, units, and categories.
🛠 Fully Customizable Structure
Add new KPIs, change targets, adjust thresholds, and adapt it to your campaign strategy.
📦 What’s Inside the Media Buying KPI Scorecard in Excel
When you download this product, you get:
✔ Scorecard Sheet – Central performance dashboard
✔ KPI Trend Sheet – MTD & YTD trend charts with PY comparison
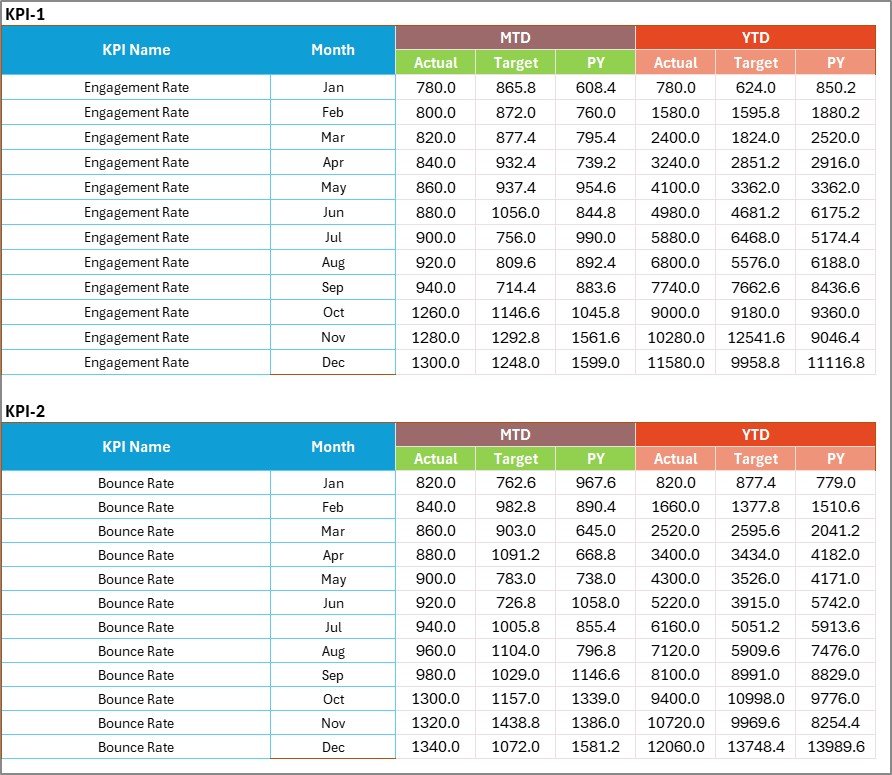
✔ Input Data Sheet – Easy data entry hub
✔ KPI Definition Sheet – KPI documentation center
✔ Pre-structured KPI groups (Traffic, Cost, Conversion, Revenue)
✔ 10 Pre-configured media buying KPIs including:
CTR
CPC
CPA
ROAS
Conversion Rate
Impressions
Reach
Engagement Rate
CPL
Revenue Generated
Everything is pre-formatted and ready to use.
🛠 How to Use the Media Buying KPI Scorecard in Excel
Using this template is simple and powerful:
1️⃣ Enter your monthly Actual and Target values in the Input Data Sheet.
2️⃣ Define KPI formulas and categories in the KPI Definition Sheet.
3️⃣ Go to the Scorecard Sheet and select:
Month
MTD or YTD view
4️⃣ Instantly review:Performance %
Variance
Visual indicators
5️⃣ Use the KPI Trend Sheet to analyze:MTD trends
YTD trends
Actual vs Target vs Previous Year
Within minutes, you gain clear visibility over campaign performance.
👥 Who Can Benefit from This Media Buying KPI Scorecard?
🎯 Digital Marketing Agencies
📊 Performance Marketing Managers
💼 Media Buyers
🛒 E-commerce Growth Teams
📈 Marketing Analysts
🚀 Startup Marketing Teams
If you manage paid campaigns, this scorecard gives you structured control over your advertising investment.
This Excel scorecard transforms how you manage paid media. Instead of reacting to overspending, you act proactively. Instead of tracking vanity metrics, you focus on ROI-driven KPIs.
When ROAS drops, you see it instantly.
When CPA rises, you adjust campaigns faster.
When MTD performance shifts, you respond strategically.
It’s not just a spreadsheet.
It’s your media buying control system.
Click here to read the Detailed blog post
Watch the step-by-step video tutorial:
Visit our YouTube channel to learn step-by-step video tutorials
Compatibility and Requirements
- Works in Microsoft Excel desktop (Excel 2016 or later, or Microsoft 365).
- You pick the month and the MTD or YTD view from dropdowns, and the Scorecard uses conditional formatting for the color signals. Microsoft explains the feature in Use conditional formatting to highlight information in Excel.
Frequently Asked Questions
Which sheets are included?
Four sheets: Scorecard, KPI Trend, Input Data and KPI Definition.
Which KPIs does the template track?
Ten media buying KPIs: CTR, CPC, CPA, ROAS, Conversion Rate, Impressions, Reach, Engagement Rate, CPL and Revenue Generated. They are grouped as Traffic, Cost, Conversion and Revenue.
How do I switch between MTD and YTD?
Select the month and the MTD or YTD view with the dropdowns on the Scorecard sheet. The Actual, Target, Variance and Performance % columns update for your selection.
Can I add my own KPIs or change targets?
Yes. You can add KPIs, change targets and adjust thresholds. Record each KPI’s formula, unit and category on the KPI Definition sheet.
Is there a dashboard version for media buying?
Yes. See the Media Buying KPI Dashboard in Excel, the Media Buying KPI Dashboard in Google Sheets and the Media Buying KPI Dashboard in Power BI.
Related Media and KPI Scorecard Templates
- Media Buying KPI Dashboard in Excel: the same topic as a dashboard
- Media Buying KPI Dashboard in Google Sheets: the Google Sheets edition
- Media Buying KPI Dashboard in Power BI: the Power BI edition
- Media & Entertainment KPI Scorecard in Excel: a scorecard for media businesses
- Marketing and Social Media Analytics Kit: 7 marketing templates in one bundle
Browse all Excel KPI dashboards.