📊 Take Control of Your Ad Spend with the Media Buying KPI Dashboard in Google Sheets
In a world where every click counts, media buyers can’t afford to guess — they need to track, measure, and optimize every dollar spent. That’s where the Media Buying KPI Dashboard in Google Sheets becomes your go-to companion. Whether you’re managing Google Ads, social campaigns, or print media, this dashboard empowers you to make smart, data-driven decisions on the fly.
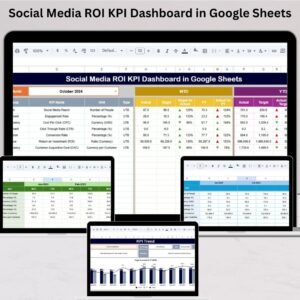
This ready-to-use dashboard offers real-time campaign visibility, helping you identify what’s working, what’s underperforming, and where your media spend is truly delivering ROI. Built entirely in Google Sheets, it’s easy to use, highly customizable, and accessible from anywhere — no software downloads, no complex tools.
✨ Key Features of Media Buying KPI Dashboard in Google Sheets
-
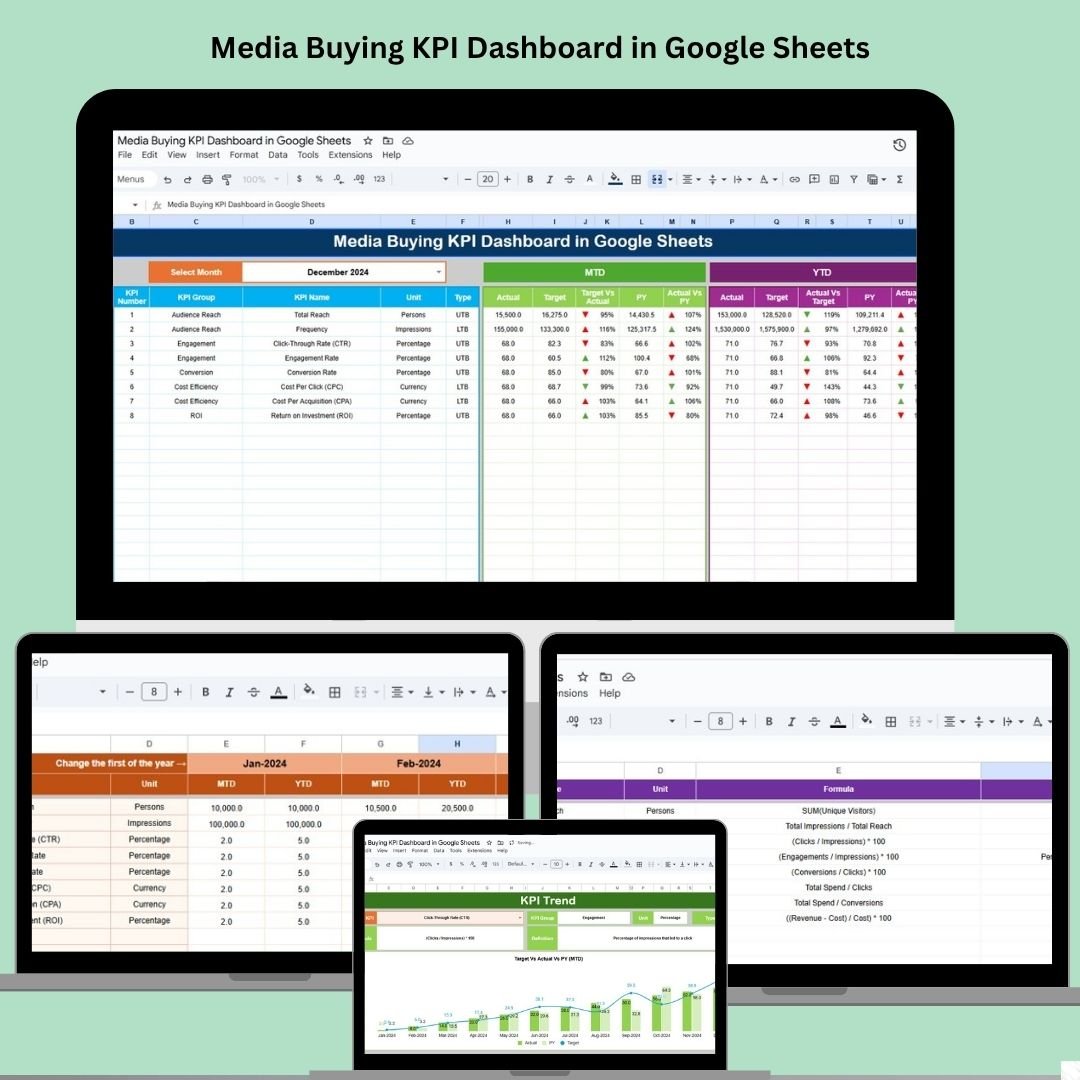
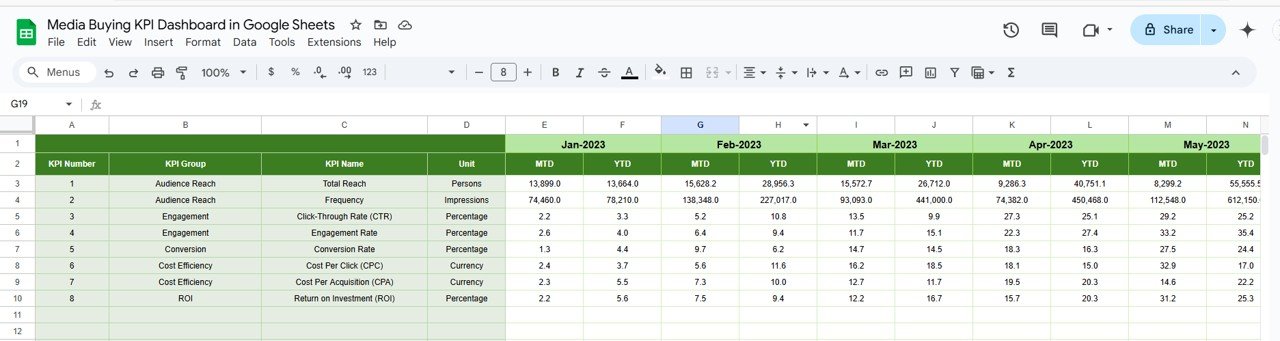
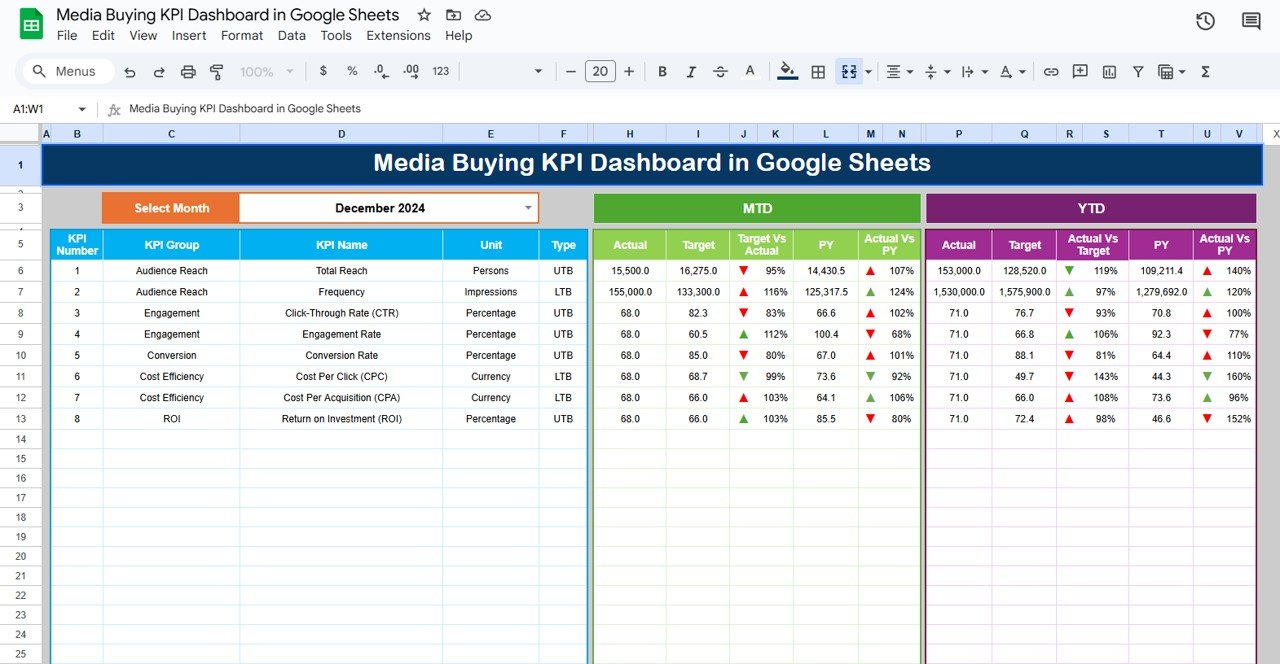
📈 Real-Time Performance Metrics
Instantly view MTD/YTD data, targets, and comparisons with previous years. -
🔀 Month-Based Filtering
Select your desired month from a dropdown, and the entire dashboard updates accordingly. -
📊 Visual Feedback with Arrows
Up/down arrows in red and green show how you’re performing against targets and last year’s numbers. -
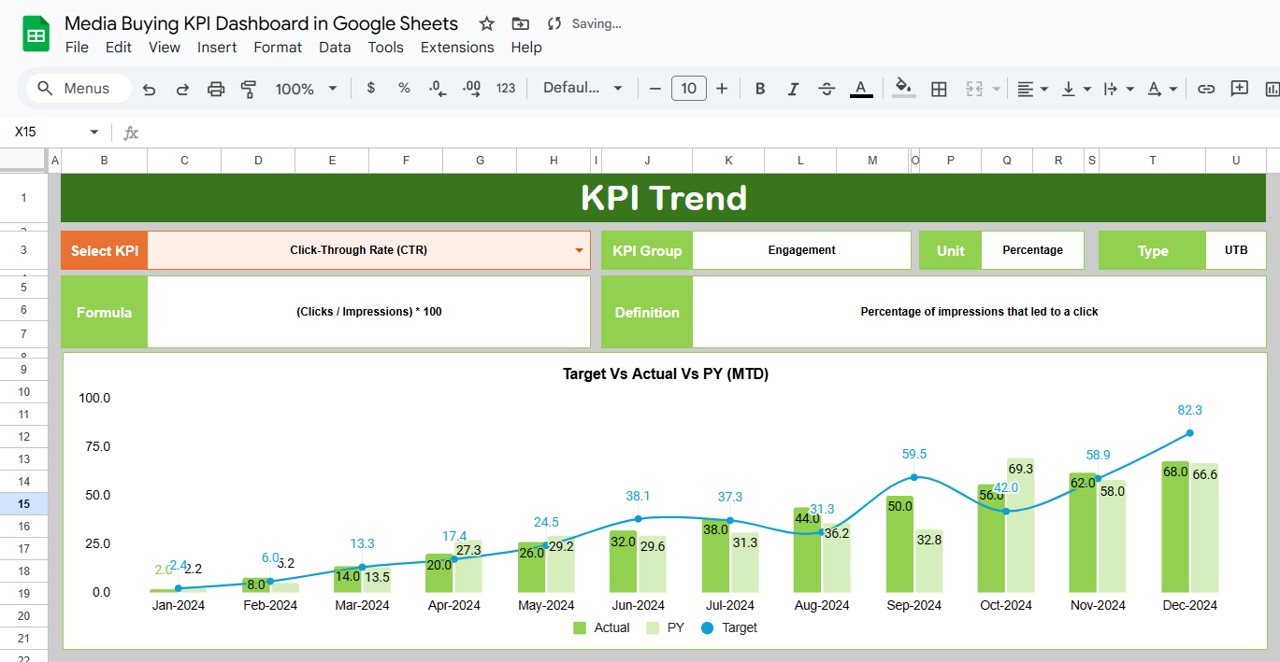
📅 KPI Trend Sheet
Monitor long-term trends of key metrics like CPC, CTR, Impressions, and more. -
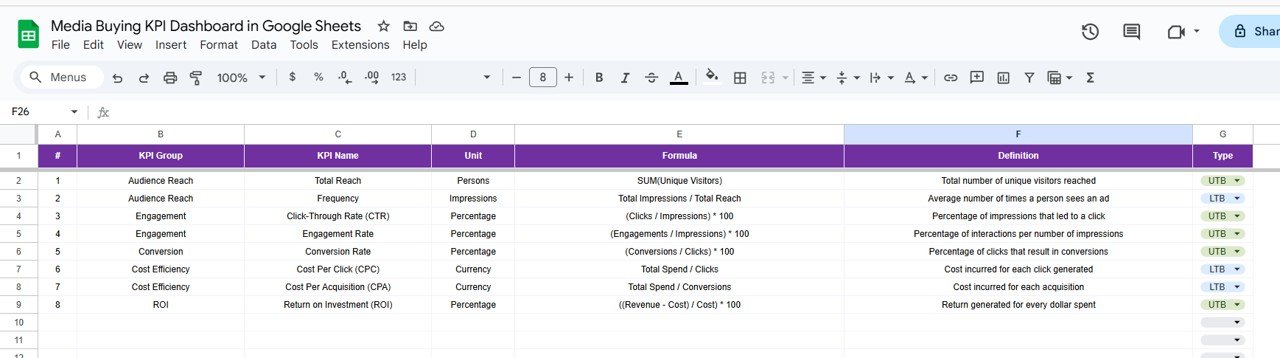
📝 Defined Metrics & Formulas
Stay clear with a separate KPI definition tab that explains formulas, unit, and KPI type. -
📂 6 Well-Structured Sheets
Organized tabs include: Dashboard, KPI Trend, Actual Numbers, Targets, Previous Year Data, and Definitions.
📦 What’s Inside the Media Buying KPI Dashboard
-
✅ Dashboard Tab
High-level overview with MTD, YTD, and conditional performance indicators. -
📉 KPI Trend Tab
Select a KPI and view visual trends over time for better planning. -
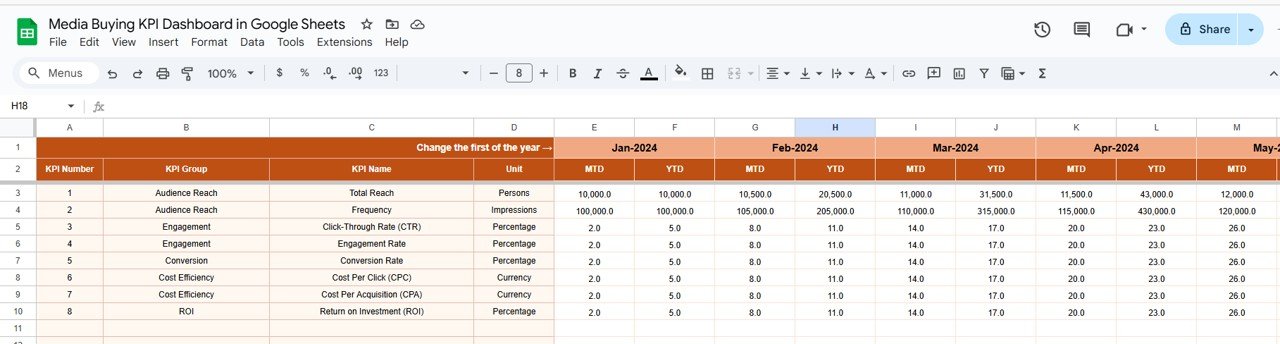
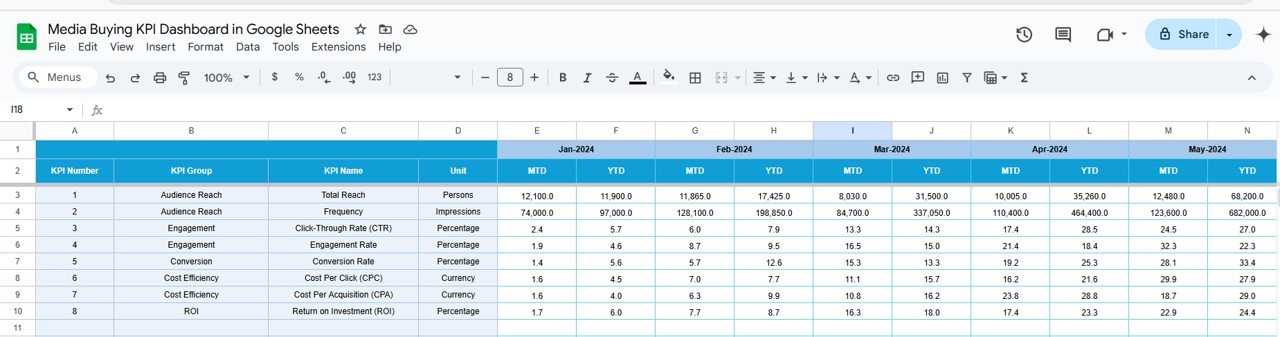
✍️ Actual Number Tab
Enter current month’s data — the dashboard updates automatically. -
🎯 Target Sheet
Set MTD and YTD goals per KPI to compare against performance. -
📆 Previous Year Data
Keep track of past campaigns to benchmark improvements. -
📘 KPI Definition Tab
Provides full definitions, formula logic, KPI types (UTB or LTB), and measurement units.
🧠 How to Use the Media Buying KPI Dashboard
-
📤 Input your actual performance data monthly in the “Actual Number” sheet.
-
🎯 Set your targets in the “Target” sheet.
-
📆 Fill out last year’s data for comparison.
-
🔍 Use dropdown filters to focus on specific KPIs or months.
-
📊 Check trends and adjust your media buying strategy based on the visuals.
👥 Who Can Benefit from This Dashboard?
🎯 Digital Marketers – Track ad spend and ROI across multiple platforms
📺 Media Planners – Optimize cross-channel campaigns
📈 Marketing Agencies – Deliver real-time results to clients
📝 Freelancers & Consultants – Impress clients with organized reporting
📢 Brand Managers – Stay on top of every media investment
🚀 Why Choose Google Sheets for KPI Tracking?
-
🌐 Access Anywhere – Cloud-based and shareable
-
🔧 Customize Easily – Add or remove KPIs based on campaign goals
-
💡 No Coding Needed – Use dropdowns, conditional formatting, and formulas
-
🔄 Instant Updates – Modify data and see real-time results
🛠️ Best Practices for Success
✅ Update your data consistently
✅ Use trend data to optimize future buys
✅ Monitor ROI, CTR, and CPC for every campaign
✅ Compare with last year to identify growth
✅ Customize KPIs to match your platform (Meta, Google Ads, etc.)
✅ Click here to read the Detailed blog post
Watch the step-by-step video Demo:


Reviews
There are no reviews yet.