A/B Testing KPI Dashboard in Google Sheets is at the heart of data-driven growth. Businesses constantly test landing pages, ad creatives, email campaigns, pricing strategies, layouts, and product features to improve conversions and user experience. However, many teams struggle to measure A/B testing performance clearly. Results often remain scattered across tools, reports, and spreadsheets, making it difficult to identify winning variations and justify decisions.A/B Testing KPI Dashboard in Google Sheets
That is exactly why an A/B Testing KPI Dashboard in Google Sheets becomes an essential solution.A/B Testing KPI Dashboard in Google Sheets
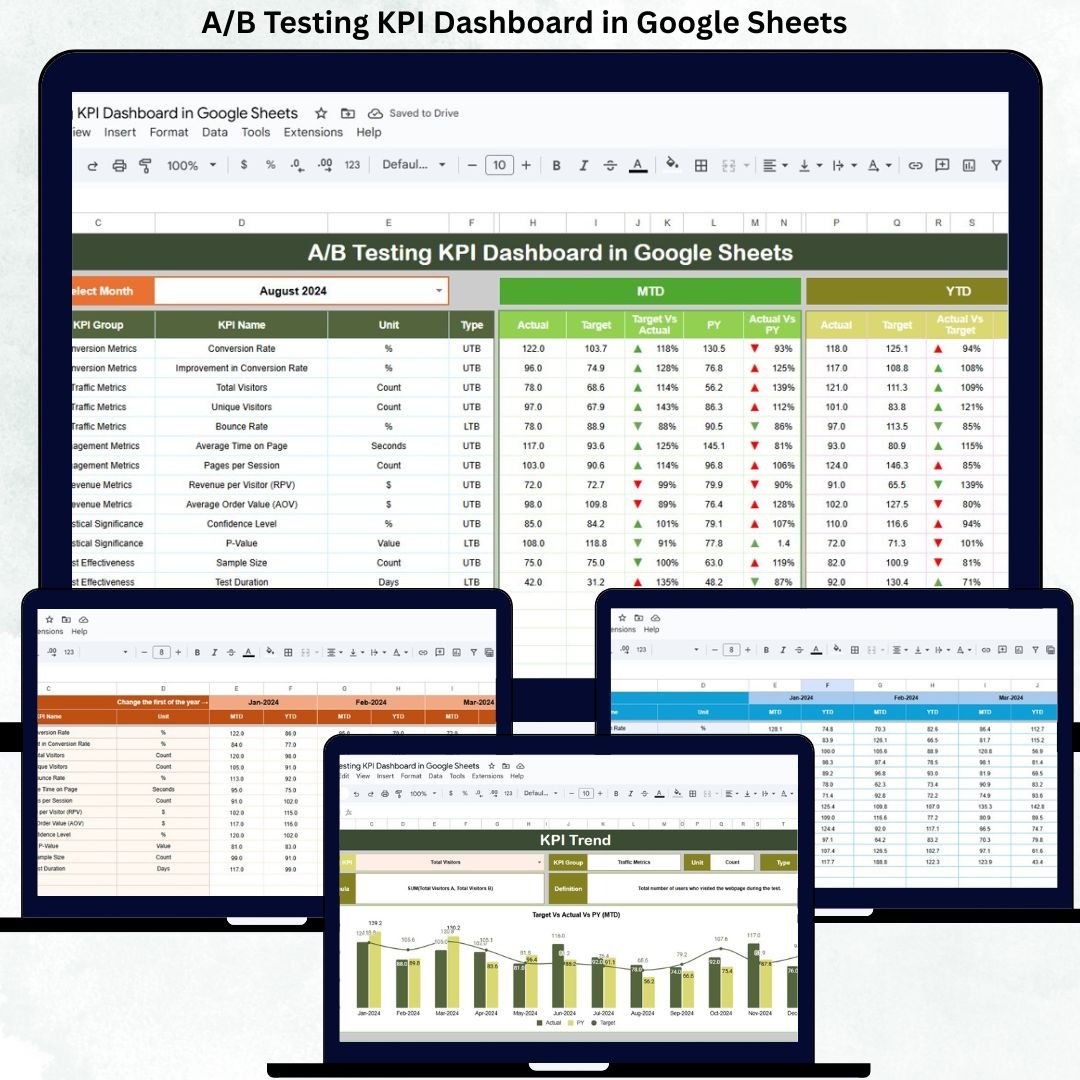
The A/B Testing KPI Dashboard in Google Sheets is a ready-to-use analytical framework designed to track, measure, and evaluate experimentation performance using structured KPIs. Instead of relying on individual test reports, this dashboard centralizes all A/B testing metrics into one interactive and standardized reporting system.
Because the dashboard is built in Google Sheets, it remains cloud-based, collaborative, cost-effective, and easy to customize. Marketing teams, product managers, CRO specialists, and leadership teams can access real-time insights without complex BI tools or technical dependencies.A/B Testing KPI Dashboard in Google Sheets
🚀 Key Feature of A/B Testing KPI Dashboard in Google Sheets
📌 Key Features of the A/B Testing KPI Dashboard
-
🧪 Centralized A/B testing performance tracking
-
📊 MTD & YTD KPI comparison framework
-
🎯 Actual vs Target performance visibility
-
🔁 Current Year vs Previous Year benchmarking
-
📈 KPI-wise trend analysis
-
🔍 Deep KPI-level drill-down
-
⚙️ Fully customizable KPI definitions
-
🤝 Real-time collaboration in Google Sheets
📦 What’s Inside the A/B Testing KPI Dashboard
The dashboard includes 6 structured worksheet tabs, each designed for clarity, accuracy, and decision-making.
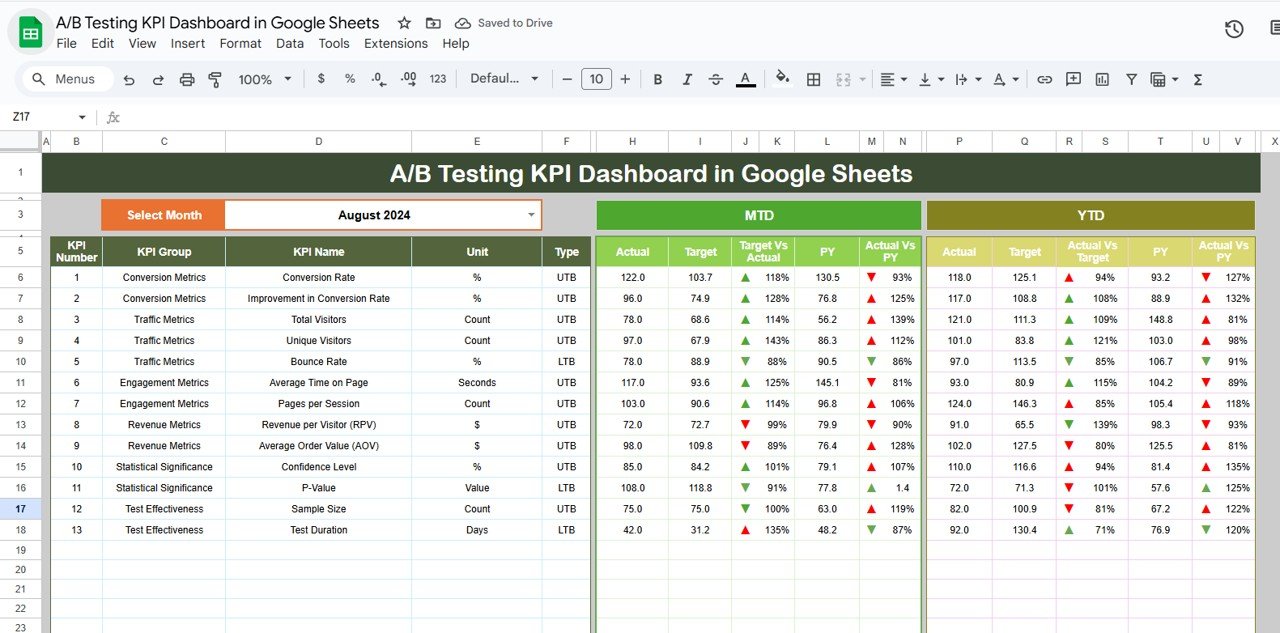
📊 Dashboard Sheet Tab (Main Page)
This is the executive overview page.
-
📅 Month selector in Cell D3
-
Selecting a month instantly updates all KPIs
-
Displays MTD and YTD performance side by side
KPIs Displayed
MTD (Month-to-Date):
-
Actual
-
Target
-
Previous Year
-
Target vs Actual
-
Previous Year vs Actual
YTD (Year-to-Date):
-
Actual
-
Target
-
Previous Year
-
Target vs Actual
-
Previous Year vs Actual
🔼 Green arrows indicate improvement
🔽 Red arrows indicate decline
This allows leadership to evaluate experimentation performance within seconds.
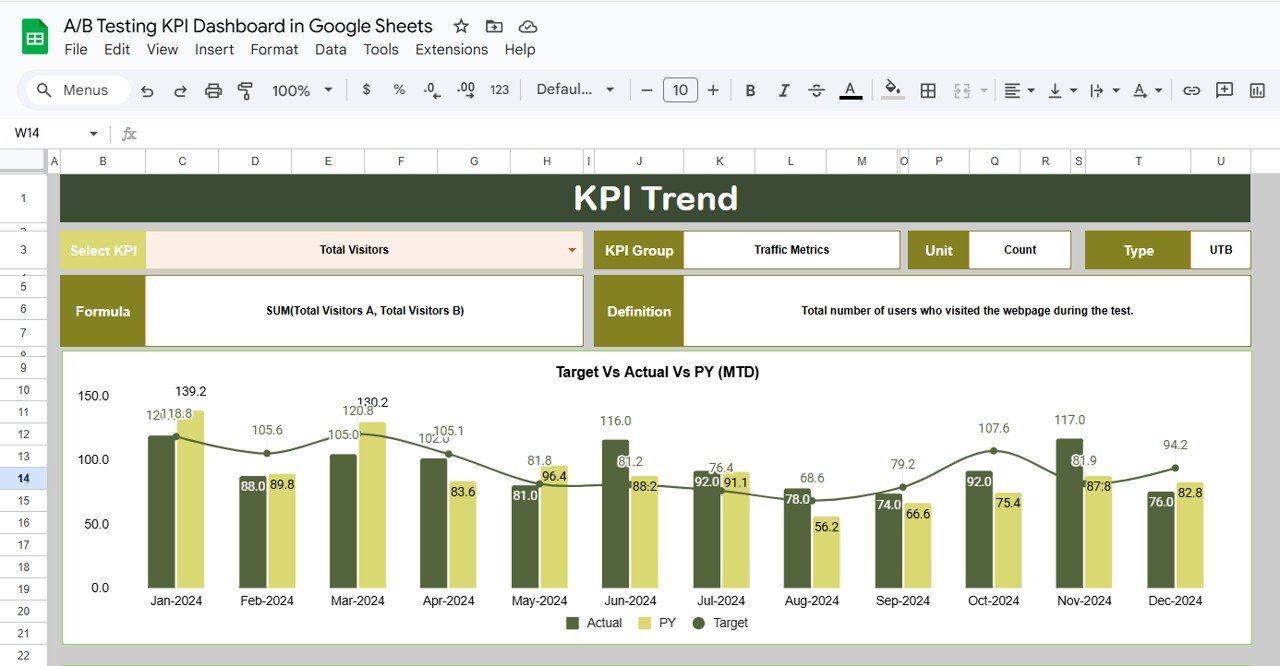
📈 KPI Trend Sheet Tab
This sheet supports deep KPI analysis.
-
Select KPI from dropdown in Cell C3
-
Automatically displays:
-
KPI Group
-
KPI Unit
-
KPI Type (UTB / LTB)
-
KPI Formula
-
KPI Definition
-
-
Includes month-wise trend chart for the selected KPI
This sheet helps teams identify long-term experimentation maturity and performance patterns.
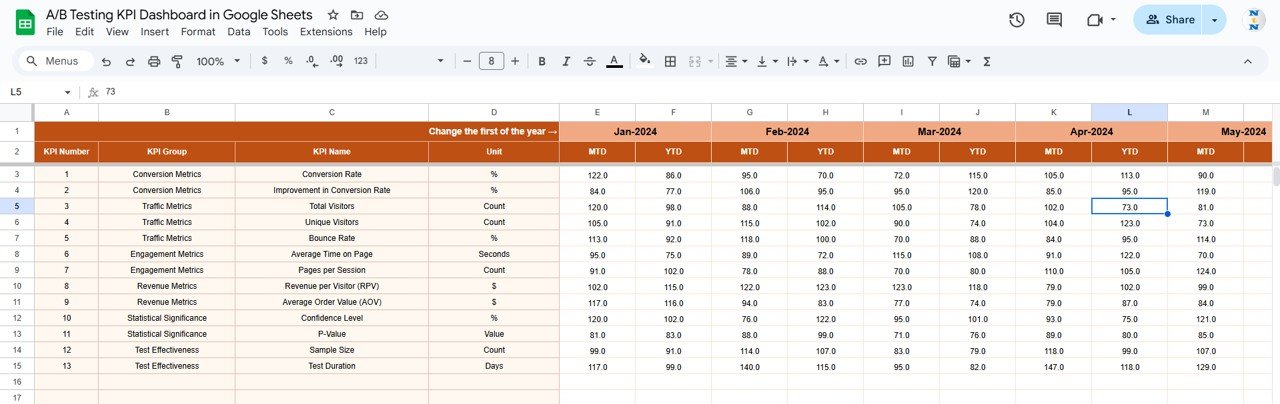
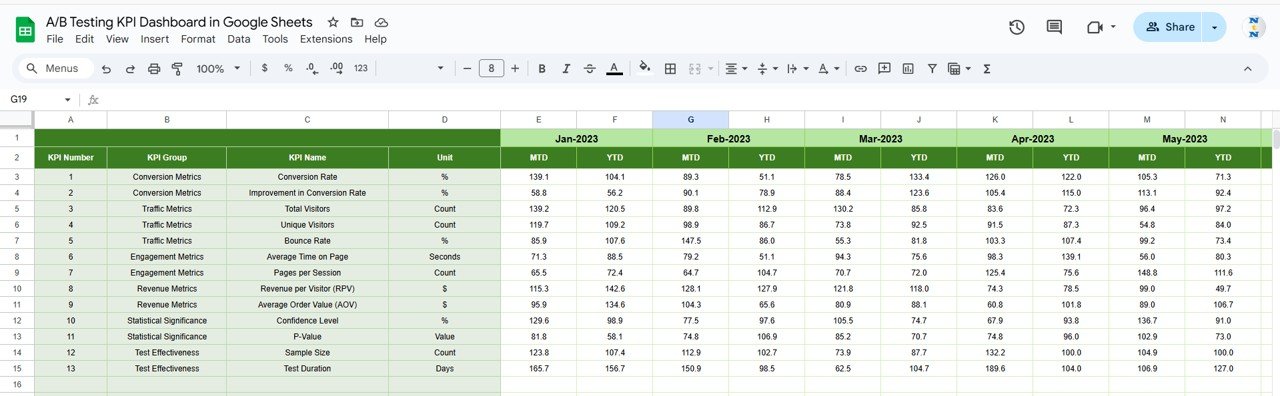
🧾 Actual Number Sheet Tab
This is the structured data-entry sheet.
-
Enter MTD and YTD actual values
-
Select first month of the year in Cell E1
-
Dashboard updates automatically
It ensures consistency and eliminates manual recalculation.
🎯 Target Sheet Tab
This sheet stores planned KPI targets.
-
Monthly (MTD) targets
-
Yearly (YTD) targets
Targets help teams measure whether A/B testing initiatives deliver expected business outcomes.
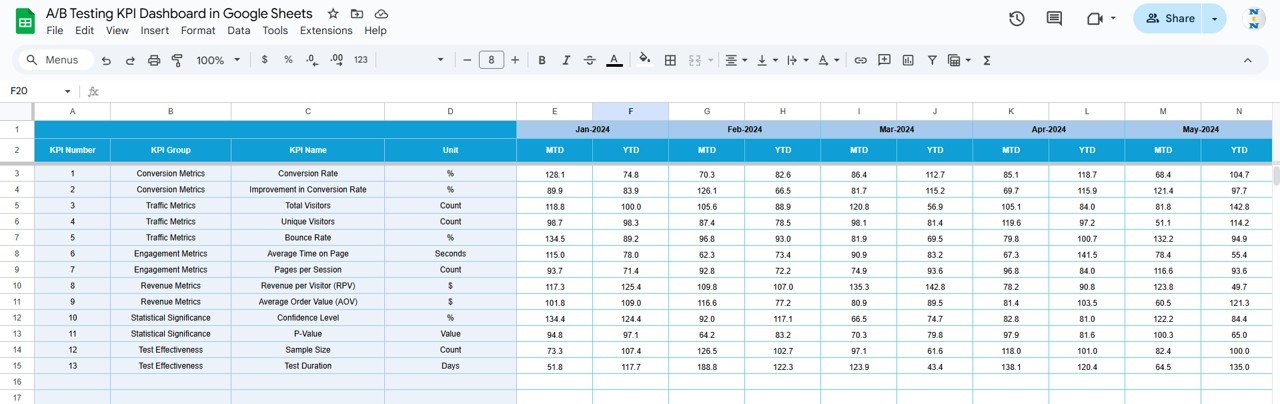
🔁 Previous Year Number Sheet Tab
This sheet contains last year’s KPI values.
-
Enables year-over-year comparison
-
Tracks experimentation maturity
-
Supports strategic optimization decisions
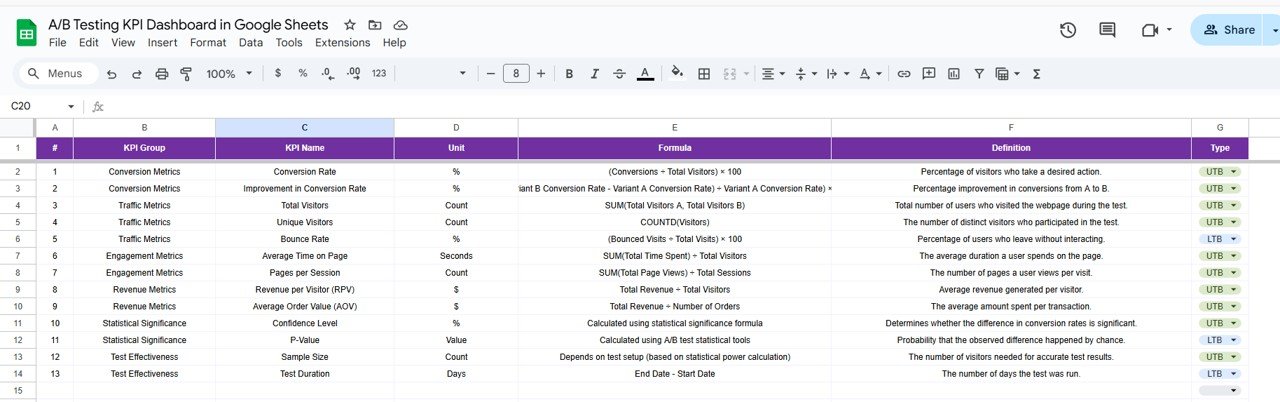
📘 KPI Definition Sheet Tab
This is the backbone of the dashboard.
It includes:
-
KPI Name
-
KPI Group
-
Unit
-
Formula
-
Definition
-
KPI Type (Lower / Upper the Better)
Any update here reflects across the entire dashboard automatically.
🛠️ How to Use the A/B Testing KPI Dashboard
1️⃣ Enter actual test performance data
2️⃣ Review MTD & YTD KPIs
3️⃣ Compare Actual vs Target
4️⃣ Analyze KPI trends
5️⃣ Benchmark with previous year
6️⃣ Optimize experimentation strategy
👥 Who Can Benefit from This A/B Testing KPI Dashboard
-
🧠 Product Teams
-
📣 Marketing & Growth Teams
-
🎯 CRO & UX Teams
-
📊 Data & Analytics Teams
-
🧑💼 Business Owners & Leadership
### Click here to read the Detailed blog post
Watch the step-by-step video tutorial:


Reviews
There are no reviews yet.