

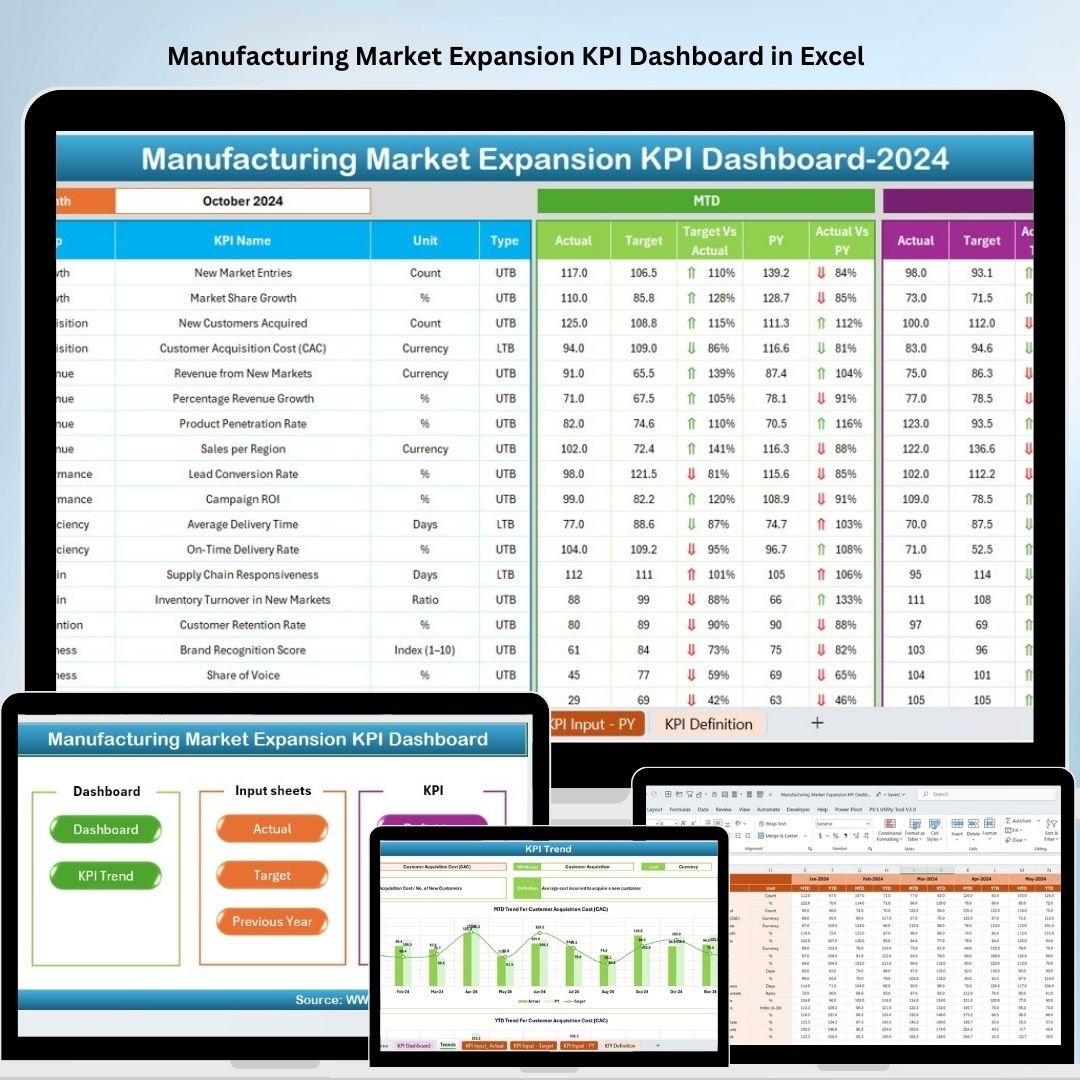
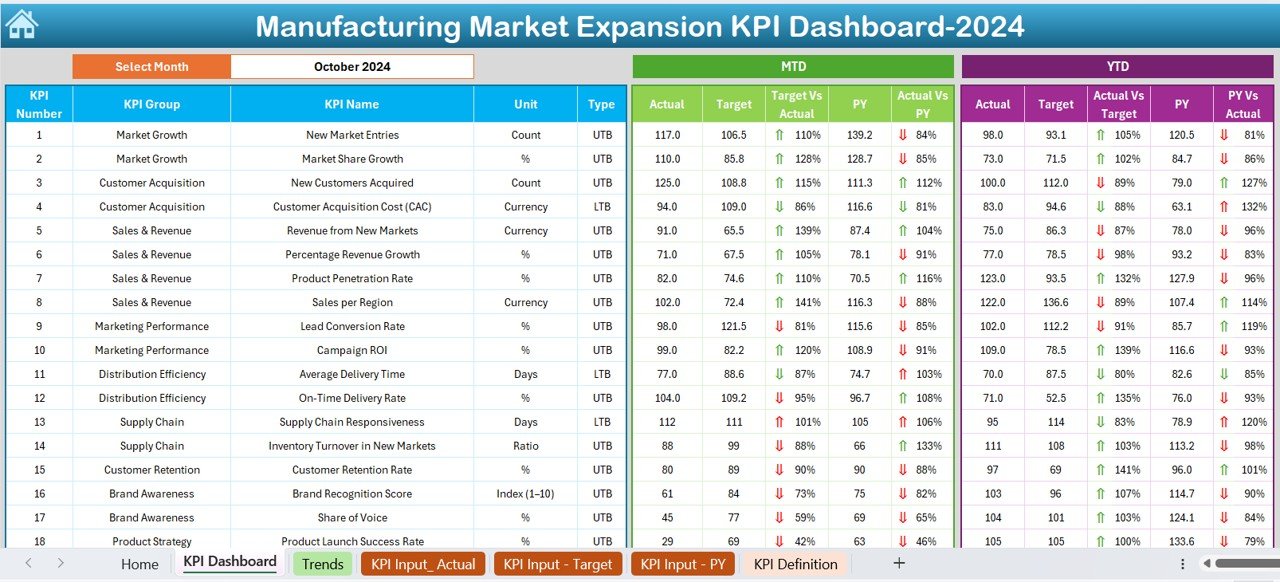


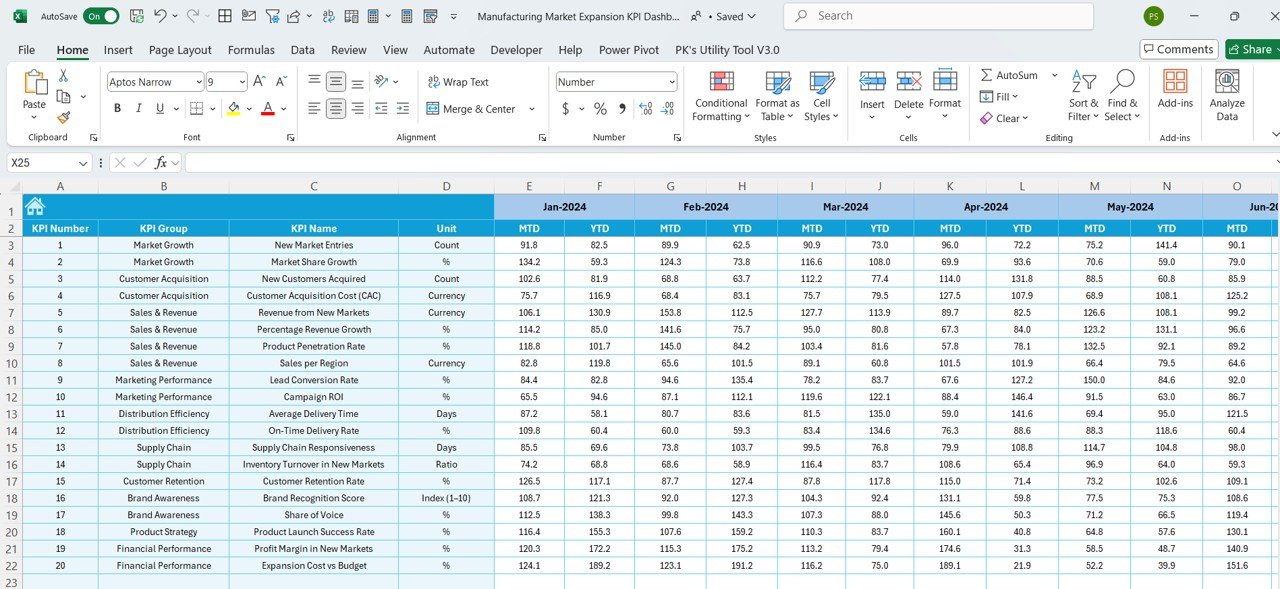
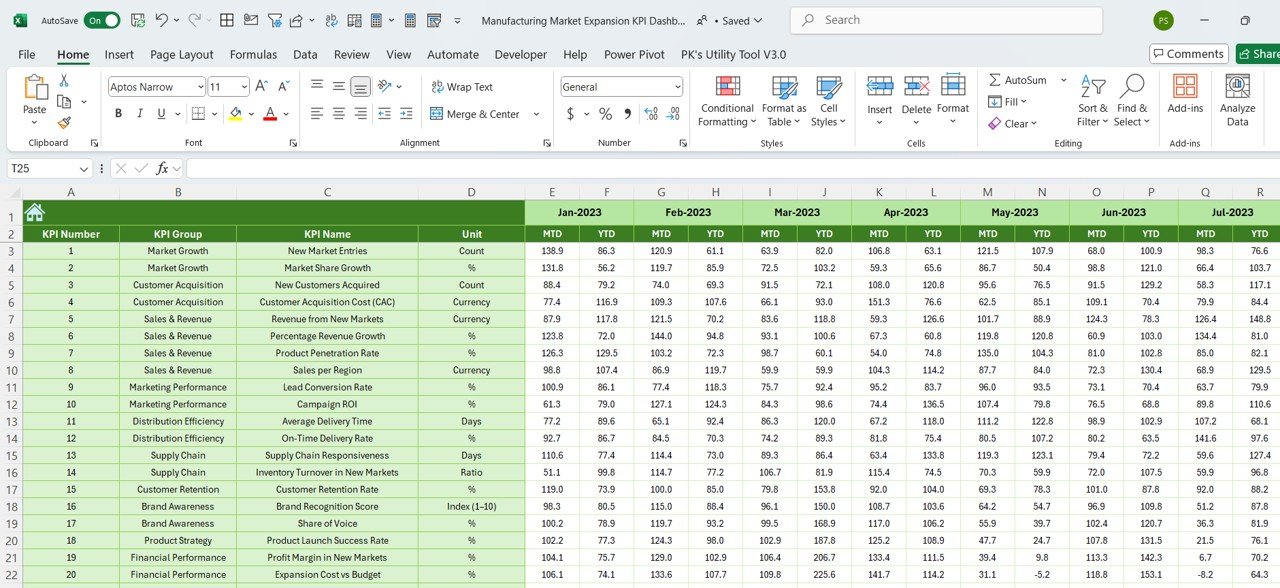
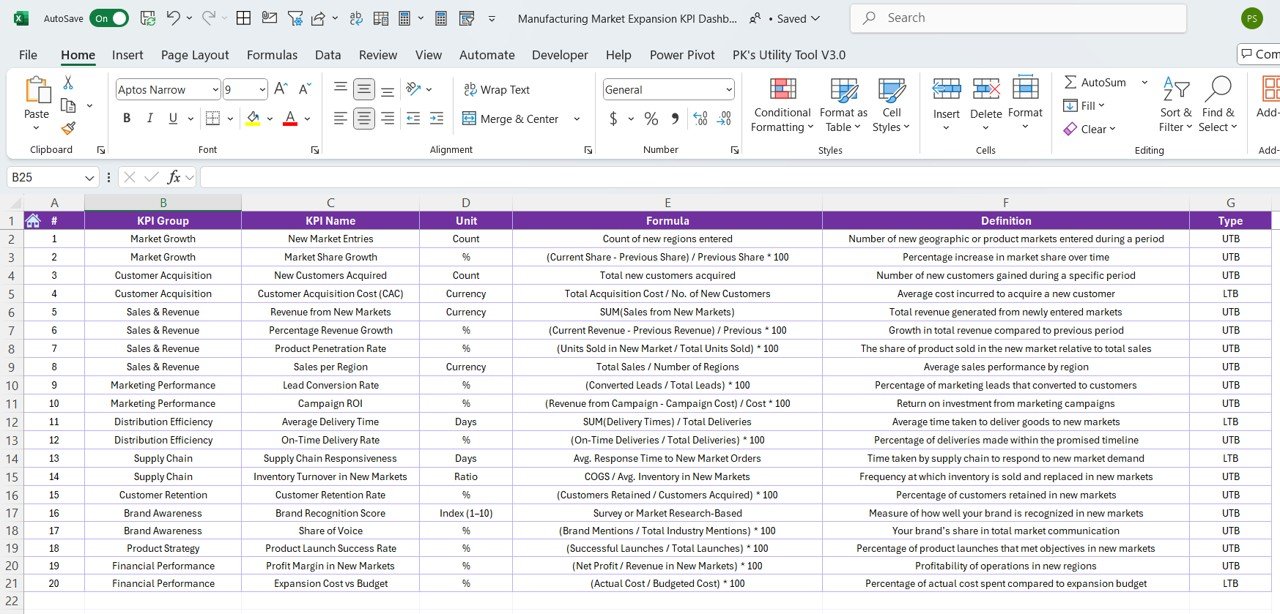

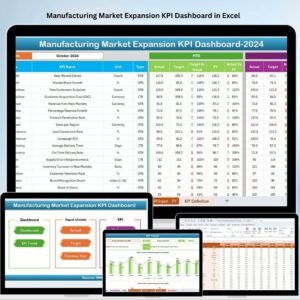
The Manufacturing Market Expansion KPI Dashboard in Excel is an essential tool for manufacturers looking to track and analyze the performance of their market expansion efforts. This Excel-based dashboard provides valuable insights into key performance indicators (KPIs) related to market growth, including sales performance, market share, product launch success, and geographic expansion. It helps businesses make data-driven decisions to improve their strategies and optimize their market entry or expansion processes.
Whether you’re entering new markets, launching new products, or expanding your manufacturing footprint, this dashboard allows you to monitor every stage of the process. The customizable features make it adaptable to your specific business needs, ensuring that you can track the metrics that matter most to your success.
Key Features of the Manufacturing Market Expansion KPI Dashboard in Excel
📊 Market Expansion Performance Tracking
Monitor key metrics such as sales growth, market penetration, and market share to evaluate your market expansion efforts. Analyze the effectiveness of different strategies in achieving business goals.
📈 Product Launch Monitoring
Track the success of new product launches, including sales performance, customer feedback, and initial market response. Use this data to refine your product launch strategies for future success.
🌍 Geographic Expansion Monitoring
Track the performance of your products or services in different geographic regions. Evaluate the success of your expansion into new markets and identify areas for improvement.
💡 Cost Efficiency Analysis
Analyze the cost of entering new markets, including marketing, logistics, and product development costs. This feature helps you track ROI and ensure that your expansion efforts are financially sustainable.
📅 Time-Based Analysis
Evaluate the performance of your market expansion strategies over various time periods—monthly, quarterly, or annually. This helps you track progress and make adjustments as needed.
⚙️ Customizable & Scalable Dashboard
Customize the dashboard to reflect the specific KPIs and metrics that are most important to your business. Scale it as your expansion efforts grow and change over time.
Why You’ll Love the Manufacturing Market Expansion KPI Dashboard in Excel

✅ Comprehensive Market Expansion Insights
Track and evaluate all aspects of your market expansion efforts, from geographic growth to product success, all in one place.
✅ Make Data-Driven Decisions
Use real-time data to inform your market expansion strategies. Analyze sales, market share, and product performance to optimize your approach.
✅ Monitor Cost Efficiency
Understand the cost of your market expansion efforts and ensure that you’re maximizing ROI while minimizing expenses.
✅ Scalable for Growing Businesses
The dashboard can grow with your business, accommodating more data and additional KPIs as your expansion efforts scale.
✅ Customizable to Your Needs
Tailor the dashboard to meet your specific business goals and track the KPIs that matter most to your market expansion strategy.
What’s Inside the Manufacturing Market Expansion KPI Dashboard in Excel?
Market Expansion Performance Tracking: Track sales, market share, and growth metrics.
Product Launch Monitoring: Monitor the success of new product launches.
Geographic Expansion Monitoring: Track performance in different regions.
Cost Efficiency Analysis: Analyze the financial performance of your expansion efforts.
Time-Based Analysis: Track progress over different time periods.
Customizable Layout: Adjust the dashboard to fit your specific business goals.
How to Use the Manufacturing Market Expansion KPI Dashboard in Excel
1️⃣ Download the Template: Access the Manufacturing Market Expansion KPI Dashboard in Excel instantly.
2️⃣ Integrate Your Data: Input your sales, market share, and other relevant data into the dashboard.
3️⃣ Track Key KPIs: Monitor your market expansion efforts, including sales growth, market penetration, and product success.
4️⃣ Analyze Cost Efficiency: Use the dashboard to evaluate the costs of market entry and expansion.
5️⃣ Make Data-Driven Decisions: Use the insights from the dashboard to optimize your expansion strategies and improve market performance.
Who Can Benefit from the Manufacturing Market Expansion KPI Dashboard in Excel?
🔹 Manufacturing Companies Expanding into New Markets
🔹 Product Managers & Marketing Teams
🔹 Business Owners & Executives
🔹 Sales & Market Expansion Teams
🔹 Supply Chain & Logistics Managers
🔹 Small & Medium Enterprises (SMBs)
🔹 Enterprises with Global Expansion Goals
Drive your market expansion efforts with the Manufacturing Market Expansion KPI Dashboard in Excel. Track key metrics, optimize your strategies, and make informed decisions to fuel your business growth.
Click here to read the Detailed blog post
Visit our YouTube channel to learn step-by-step video tutorials
Youtube.com/@PKAnExcelExpert
Watch the step-by-step video Demo:
Compatibility and Requirements
- Works in Microsoft Excel desktop (Excel 2016 or later, or Microsoft 365).
- New to Excel? Start with Microsoft’s Excel for Windows training.
Frequently Asked Questions
Which KPIs does it track?
Sales growth, market penetration and market share, plus new product launch results, regional performance and the cost of entering new markets.
Can I compare regions?
Yes. Track how your products perform in each geographic region you expand into.
Does it cover expansion costs?
Yes. It analyzes marketing, logistics and product development costs so you can follow ROI.
Can I review monthly, quarterly or yearly results?
Yes. Performance can be reviewed over monthly, quarterly and annual periods.
Related Market Expansion and Manufacturing Templates
- Healthcare Market Expansion KPI Dashboard in Excel: market expansion KPIs for healthcare
- Supply Chain and Logistics Market Expansion KPI Dashboard in Excel: market expansion KPIs for logistics
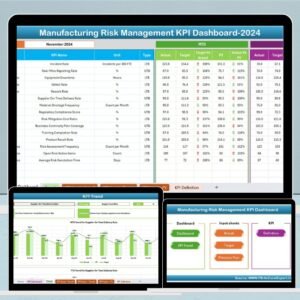
- Manufacturing Risk Management KPI Dashboard in Excel: track production risks and incidents
- Manufacturing KPI Dashboard in Power BI: manufacturing KPIs in Power BI
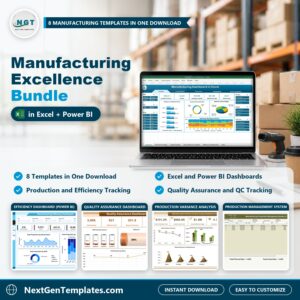
- Manufacturing Excellence Bundle: 8 manufacturing templates for Excel and Power BI
Browse all Excel manufacturing templates or the Excel KPI dashboards.





























Reviews
There are no reviews yet.